pganalyze vs. Splunk Observability Cloud

Overview
ProductRatingMost Used ByProduct SummaryStarting Price
pganalyze
Score 9.0 out of 10
Small Businesses (1-50 employees)
Founded in 2012, pganalyze provides actionable insights into Postgres. Specializing in PostgreSQL database monitoring and optimization, pganalyze gives automatic insights into Postgres query plans, helps improve Postgres query performance with its Index Advisor and VACUUM Advisor, and lets the user perform query drill-down analysis, observe per-query statistics and conduct trend analysis in a platform that integrates with both self-managed Postgres servers as…
$149
per month for 1 database server
Splunk Observability Cloud
Score 9.0 out of 10
N/A
Splunk Observability Cloud aims to enable operational agility and better customer experience through real-time AI-driven streaming analytics allowing accurate alerts in seconds. It is designed to shorten MTTD and MTTR by providing real-time visibility into cloud infrastructure and services.
$15
per month (billed annually) per host
Pricing
pganalyzeSplunk Observability Cloud
Editions & Modules
Production
$149
per month for 1 database server
Scale
$399
per month for up to 4 database servers ($100/mo for each additional billable server)
Enterprise Cloud
Contact us
per year per database server
Enterprise Server
Contact us
per year per database server
Infrastructure
$15
per month (billed annually) per host
App & Infra
$60
per month (billed annually) per host
End-to-End
$75
per month (billed annually) per host
Offerings
Pricing Offerings
pganalyzeSplunk Observability Cloud
Free Trial
YesYes
Free/Freemium Version
NoNo
Premium Consulting/Integration Services
NoNo
Entry-level Setup FeeNo setup feeNo setup fee
Additional DetailsScale plan offers additional database servers at a cost of $100/month for each additional billable server. In general, each 1 Postgres server that is running (i.e. one parent postgres process) is considered 1 billable server. In the case of cloud providers these are often called "instances". Depending on the subscription plan you are on, you may have a special price for replica servers (also called "readers", or "followers"), which is implemented by multiplying the replica count with a multiplier (e.g. 0.5), with the total rounded up. Annual plans are available and come at a discount compared to the monthly plans Contact us for custom requirements
More Pricing Information
Community Pulse
pganalyzeSplunk Observability Cloud
Best Alternatives
pganalyzeSplunk Observability Cloud
Small Businesses

No answers on this topic

InfluxDB
InfluxDB
Score 8.8 out of 10
Medium-sized Companies
LogicMonitor
LogicMonitor
Score 8.4 out of 10
Sumo Logic
Sumo Logic
Score 9.4 out of 10
Enterprises
LogicMonitor
LogicMonitor
Score 8.4 out of 10
NetBrain Technologies
Score 9.2 out of 10
All AlternativesView all alternativesView all alternatives
User Ratings
pganalyzeSplunk Observability Cloud
Likelihood to Recommend
9.0
(0 ratings)
8.6
(0 ratings)
Likelihood to Renew
-
(0 ratings)
6.4
(0 ratings)
Usability
-
(0 ratings)
7.3
(0 ratings)
User Testimonials
pganalyzeSplunk Observability Cloud
Likelihood to Recommend
pganalyze works great with the postgresql and gives a good alternatives to the existing producsts available out there like Slick or basic as microsoft SQL server manaagement studio. We have used in our projects of data migration and integration of enterprise data warehouseing and reporting . And it has provides us satisfactory results.
Read full review
The query language is relatively easy and flexible when looking into an application's problems. These queries can then be used for alerts, reports, and dashboards. I believe Splunk is a platform that can help a system grow into its proactive application management, using incidents to add insights as needed without trying to work out every scenario in advance.
Read full review
Pros
  • User and role setup
  • Performance tuning
  • Tracking of queries
Read full review
  • The first one is its Kubernetes container monitoring.
  • I really like this features because as we know how much K8s is vast and to manually monitor each part of the Kubernetes it takes so much time but Splunk Observability Cloud makes it easier. And even once we integrate K8s with Splunk Observability Cloud it gives us some prebuilt dashboards which gives holistic view of our Cluster and its nodes, pods, etc.
  • The dashbaord feature of Splunk Observability Cloud, it gives us full flexibility to customize our dashboard with a wide range of predefined chart types.
  • Now it also supports OTEL, which is a plus point for observability. As now everyone is moving towards Otel and in current market there are only few tools who supports OTEL based integrations, Splunk Observability Cloud is one out of them.
Read full review
Cons
  • Visualization
  • Database insights
Read full review
  • An indicator for errors on the navigations pane so that we don't have to go through each tab.
  • As we go more and more cloud maybe you guys can implement a pay-as-you-use strategy so that small companies using it not frequently can also afford it.
  • That's it can't think of any and it wont let me skip to next question. Thanks
Read full review
Likelihood to Renew
No answers on this topic
Good: Stable system with low error rate Easy to use for simple use cases Bad: UI is not very clear for complex usage Mobile view (when logged in from phone) is bad No library for .net
Read full review
Usability
No answers on this topic
When there is an issue, it’s a win if one can easily identify the root cause. To do the same, it should allow the user to dig deep with multiple data points and compare the data and identify the anomaly. In this use case, it’s good to drive from Splunk 011y.
Read full review
Support Rating
No answers on this topic
Splunk support is very quick and efficient. Pre-sale specialists are very skilled and available.
Read full review
Implementation Rating
No answers on this topic
Follow a training before starting.
Read full review
Alternatives Considered
It is better in terms of results provided. We were using Microsoft SQL Server Management Studio so far and relying only on that but some one recommend to us to use pganalyze to do the query analysis and we started using it for one project and we liked it much that we have started recomended to all projects teams ..
Read full review
We initially chose Splunk Observability Cloud because it promised full-stack visibility and tighter integration. The other tools didn't offer this as part of the core package. Their analytics and real-time dashboards looked strong during the demo but it turned out to a lot heavier and more complex than expected. If I had to decide again, I’d probably go with something more streamlined and easier to manage.
Read full review
Return on Investment
  • Efficient product
  • Good value for money
  • You dont have to depend on external services
Read full review
  • Significantly reduced the MTTR (Mean Time To Recovery), which in turn has improved the end-user experience tremendously.
  • Meets compliance requirements of security policies, audit, regulation, and forensics.
  • Helps us to track/manage the resource usage on our cloud instances which has a direct implication on the recurring cost.
Read full review
ScreenShots

pganalyze Screenshots

Screenshot of Query Performance Overview: pganalyze provides access to historic query data and provides tools to help with optimizing and performance tuning of Postgres databases, including trend analysis, and config tuning recommendations.Screenshot of Query Details Page: Displays detailed statistics on a per-query basis so users can learn what to focus on. pganalyze can also be used to perform query drill-down analysis and observe per-query statistics.Screenshot of pganalyze Index Advisor: pganalyze automatically validates that existing indexes are useful, gives index recommendations to improve performance, and helps reduce load on the database.Screenshot of pganalyze EXPLAIN Insights: pganalyze automatically collects EXPLAIN plans with auto_explain, provides visualizations and gives meaningful insights into Postgres Queries.Screenshot of pganalyze Log Insights: PostgreSQL logs often contain critical details about whats going on in an associated database. pganalyze Log Insights automatically extracts the logs into structured data, and filters any sensitive information.Screenshot of pganalyze VACUUM Advisor: pganalyze helps optimize table bloat, freezing and VACUUM performance - ensuring ideal performance, stability, and efficiency for  databases.

Splunk Observability Cloud Screenshots

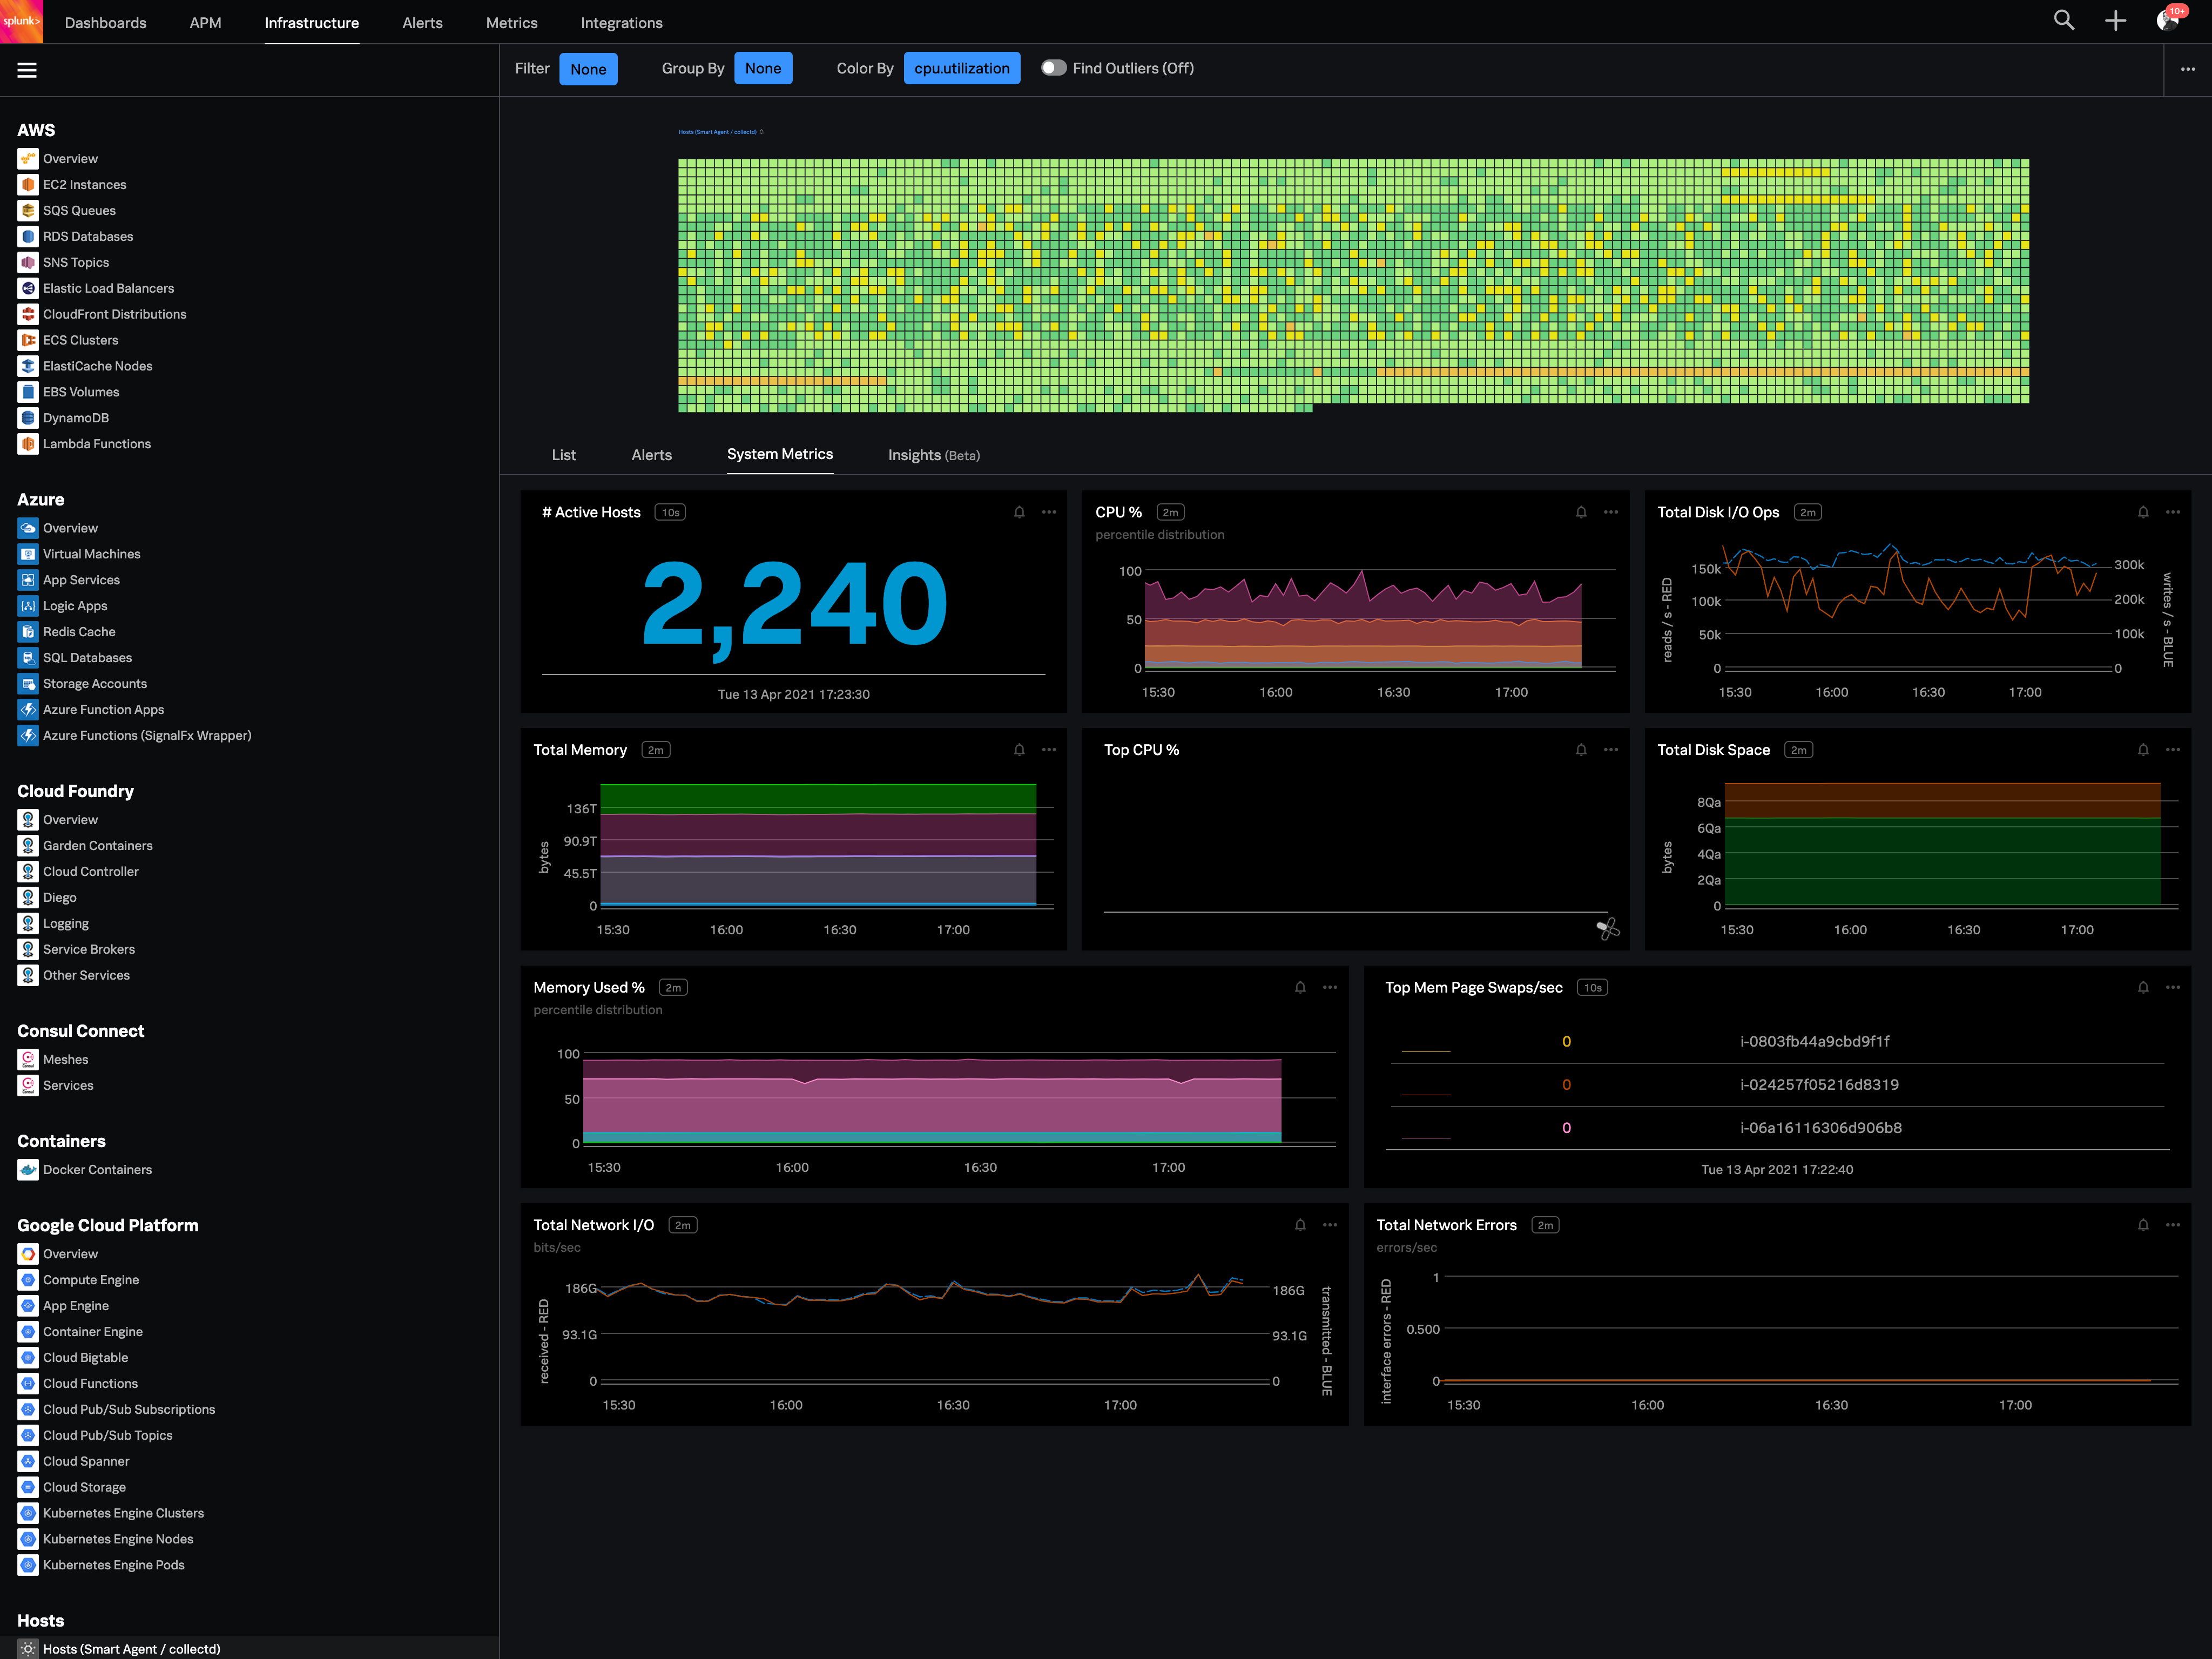
Screenshot of Real-time monitoring for public, private and hybrid cloud