Pentaho is a suite of open source business intelligence and analytics products, now offered and supported by Hitachi Data Systems since the June 2015 acquisition.
N/A
SAS Visual Analytics
Score 7.6 out of 10
Enterprise companies (1,001+ employees)
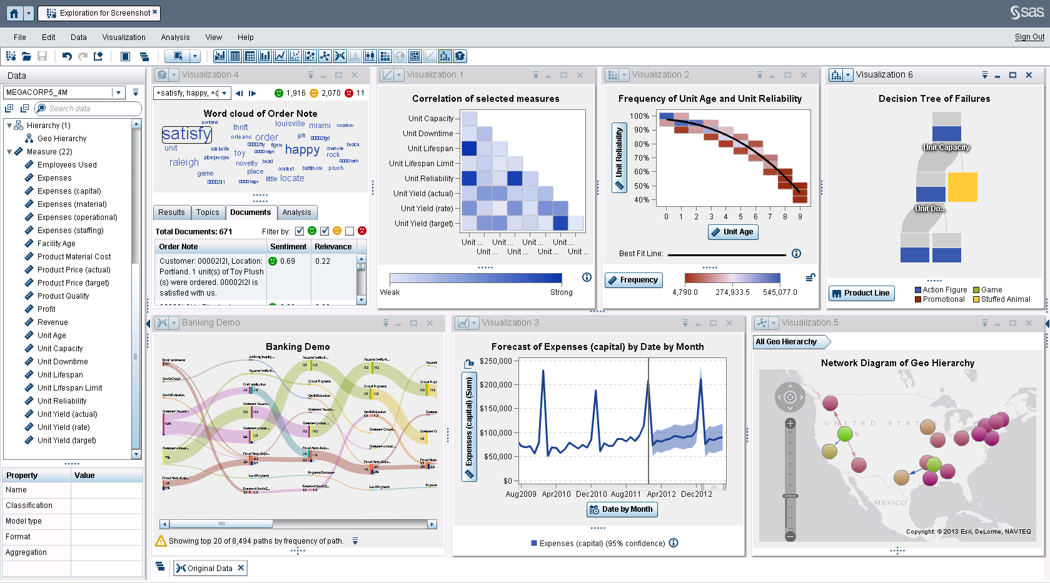
SAS Visual Analytics provides a complete platform for analytics visualization, enabling users to identify patterns and relationships in data that weren't initially evident. Interactive, self-service BI and reporting capabilities are combined with out-of-the-box advanced analytics so everyone can discover insights from any size and type of data, including text.
N/A
Pricing
Pentaho
SAS Visual Analytics
Editions & Modules
No answers on this topic
SAS Visual Analytics for SAS Cloud
$0
Annual By Users: 5, 10, 20
Offerings
Pricing Offerings
Pentaho
SAS Visual Analytics
Free Trial
No
Yes
Free/Freemium Version
No
No
Premium Consulting/Integration Services
No
No
Entry-level Setup Fee
No setup fee
No setup fee
Additional Details
—
SAS Visual Statistics and SAS Office Analytics are also available as add-ons.
More Pricing Information
Community Pulse
Pentaho
SAS Visual Analytics
Features
Pentaho
SAS Visual Analytics
BI Standard Reporting
Comparison of BI Standard Reporting features of Product A and Product B
Pentaho
9.0
Ratings
10% above category average
SAS Visual Analytics
8.3
Ratings
2% above category average
Pixel Perfect reports
8.60 Ratings
8.00 Ratings
Customizable dashboards
9.90 Ratings
8.00 Ratings
Report Formatting Templates
8.70 Ratings
9.00 Ratings
Ad-hoc Reporting
Comparison of Ad-hoc Reporting features of Product A and Product B
Pentaho
8.7
Ratings
8% above category average
SAS Visual Analytics
8.8
Ratings
9% above category average
Drill-down analysis
7.60 Ratings
9.00 Ratings
Formatting capabilities
8.30 Ratings
8.00 Ratings
Integration with R or other statistical packages
9.30 Ratings
8.00 Ratings
Report sharing and collaboration
9.70 Ratings
10.00 Ratings
Report Output and Scheduling
Comparison of Report Output and Scheduling features of Product A and Product B
Pentaho
9.7
Ratings
15% above category average
SAS Visual Analytics
9.2
Ratings
10% above category average
Publish to Web
9.60 Ratings
9.00 Ratings
Publish to PDF
9.80 Ratings
9.00 Ratings
Report Versioning
9.70 Ratings
9.00 Ratings
Report Delivery Scheduling
9.90 Ratings
10.00 Ratings
Delivery to Remote Servers
9.30 Ratings
9.00 Ratings
Data Discovery and Visualization
Comparison of Data Discovery and Visualization features of Product A and Product B
Pentaho is very well suited to perform data extraction & data mining from various cloud storage & transform that data using various available data models. However, the software struggles when it comes to visualizing the extracted data in an appealing manner & can be difficult for end-users to get an understanding of data tables created using those models.
SAS Business Intelligence is more suited to organizations which are already using SAS as the primary software for their analytics needs. Learning curve is relatively shorter for teams already skilled in BASE SAS. For organizations already working with open source software like Julia and Python, it doesn't make much sense to use SAS BI.
SAS BI makes it very easy to create interactive dashboards even for someone who is not from an IT background. For some specific requirements, basic knowledge of SQL is good enough.
A lot of functions have been predefined which makes it very convenient to create dashboards and reports. One doesn't need to be from an IT or a programming background to understand and create dashboards.
It supports other programming languages like R and also has a seamless API integration with various data management platforms.
I think the relative obscurity of the tool is a downside, not as many developers, consultants or peers you can tap into.
Lack of a solid user community held us back, looking at Power BI and Qlik, they have huge user communities that help each other out. Would have liked that here.
Smaller company means smaller sales force, and the lack of a local presence made it hard to only interact online with the account rep. Other companies have someone local who often stops by with pre-sales developers to just pitch in free of charge when they have time.
I will use Pentaho until I find a better tool with a better, easier to use report designer client. For now, Pentaho has been the most powerful reporting tool for our clients because of its ability to connect to Odoo, integrate in Odoo (reports are accessible in Odoo) and the flexibility in report design and parameter integration
There is no other product that can match SAS. There are some products that can compare to ETL but lack the analytics that SAS has. Others can perform a limited set of analytical procedures but lack the data processing that comes with SAS. Using thin client allows users to access data whenever they have an internet connection.
Even if Pentaho requires less technical skills to develop a pipeline or ETL project, its learning curve can be a bit slow since there are many ways to do the same thing as in any other platform. However, in Pentaho, some things can be confusing some moments for non-technical teams.
SAS BI is good for creating reports and dashboards and then sharing it with the users. It also has ability to manage access to the reports and dashboards but somehow with most of the world moving to open source languages R, Python and Julia, SAS BI feels to be archaic in terms of feature set and integrations it allow[s]. Also, comparing it with other Business Intelligence tools like Tableau and Microsoft BI, the functionality of SAS BI is very limited and doesn't justify the pricing.
We are an Enterprise customer. They handle problems INSTANTLY when they are critical, including initiation an immediate WebEx screen share call when needed. Smaller/less-critical problems are handled within 1-2 days -- and NEVER fall off their radar, no matter how small. As needed, we can also leverage "professional services" from them -- much of which is included in our Enterprise contract. Finally, when a problem I have discovered turns out to be a bug..they create a JIRA for the fix, and make me a watcher. I love seeing notes come in showing me status updates of bugs filed because of something I found. They really are TOP-NOTCH.
When you call tech support, you are immediately routed to a person who can answer your question. Often they can answer on the spot. However, if they cannot, you are given a track number and then followed up with. There have been times when I have had multiple track numbers open and they will actually TRACK YOU DOWN to ensure that your problem has been resolved. Issues do not fall into black holes with SAS. They are also willing to do a WebEx with you to diagnose the problem by seeing your environment, which is always helpful.
Course Taken: DI1000 Pentaho Data Integration Fundamentals Setup A week before your class started, the instructor will start sending out class material and lab setup instructions. This is helpful so that you understand how the environment is laid out and can start reviewing the content. Ultimately it saved about a 1/2 day trying to setup with 10 other people online which was great! The Course The 3-day course was laid out like many other technical classes with 15-30 minutes instruction and 15-60 minutes of lab exercises. The instructor was very knowledgeable with the functionality from version to version and answered questions as we went along. I was amazed at some of the functionality that was available that I was not using at the time and quickly implemented changes to many existing transformations and jobs. The novice users seemed to catch on quickly and more experienced users explained how some of the functionality was used in their home environments. Towards the end there was enough time so that we were able to ask very directed questions about our own environments. Overall, I really found the class to be informative and deliver enough information to be dangerous. My skills improved and I was able to design better and efficient transformations for the HIE. Course Description: https://training.pentaho.com/instructor-led-training/pentaho-data-integration-fundamentals-di1000
Get the right people in before starting implementation. Start small and build as you go approach is time consuming and involves lot of rework. Evangalize within the organization the capabilities and limitations equally so that correct delivery expectations are set. Set expectations with the Customer that the tool cannot replace proprietary software in terms of stability/usability and that timelines could change given the new ness of the product.
Perhaps Snowflake and SalesForce have some components which align with the Pentaho tools. The Pentaho tools have integrations with these technologies to add more value to the final users. Perhaps the only weakness I can honestly find in the Pentaho tools right now is the lack of a powerful web interface for data transformations. There is a web component from which you can access existing data transformations created with the Pentaho Data Integration tool. Still, the web component only allows visualization of the data transformation and remote execution. A complete web interface with remote execution would be excellent, and I'm sure that we might see something like this available at some point in the future.
I have chosen SAS Visual Analytics because one of my colleagues suggests using the software for the same for our work. As earlier, we use to take a lot of time in analyzing the data but after using the SAS Visual Analytics software our work has improved and time has decreased. It's very helpful for us.