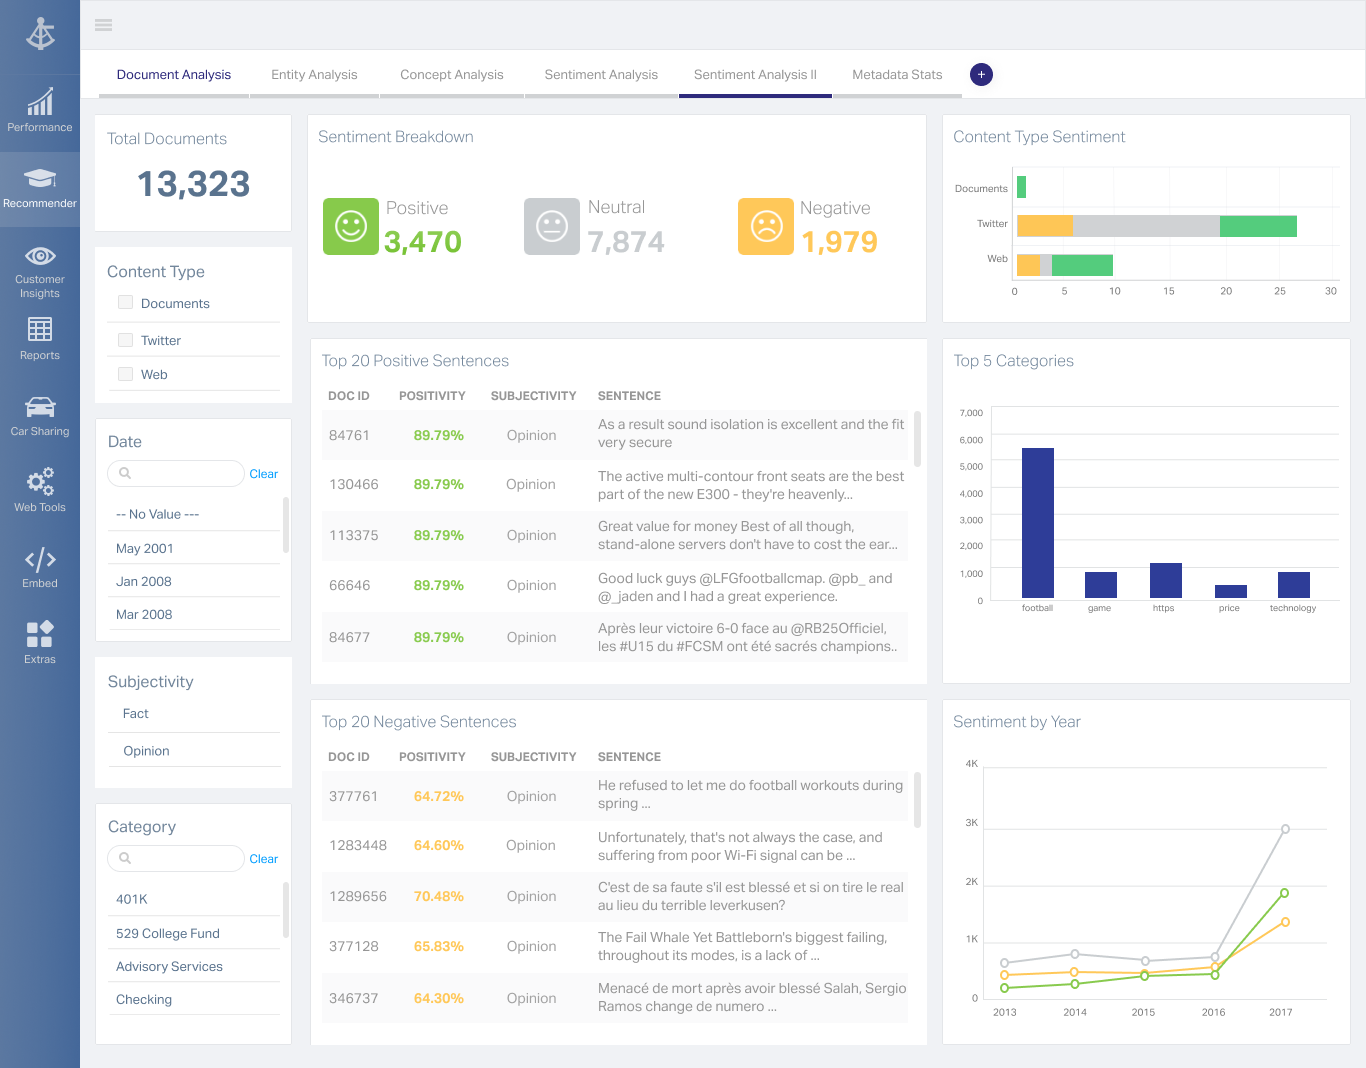
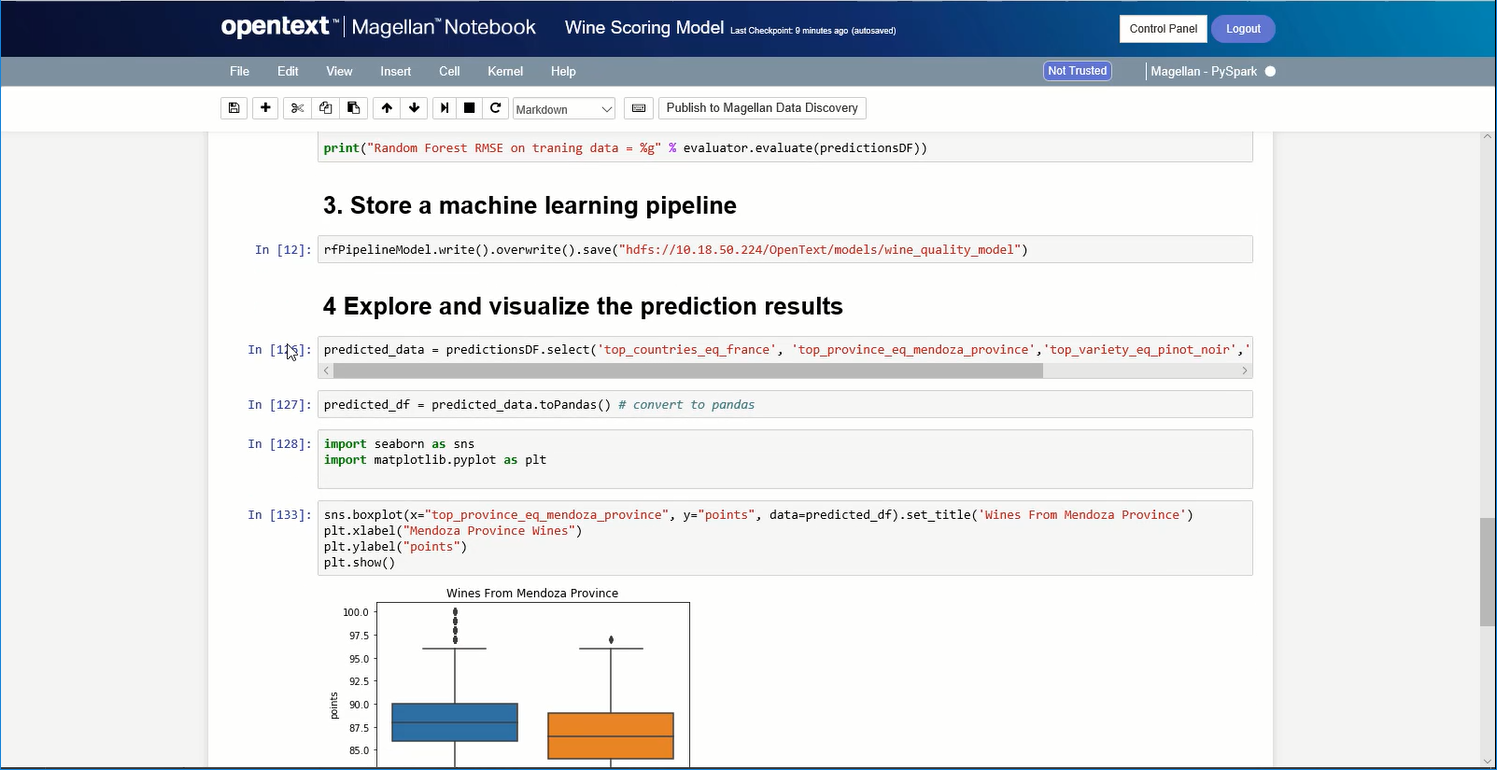
OpenText Magellan Analytics Suite leverages a comprehensive set of data analytics software to identify patterns, relationships and trends through data visualizations and interactive dashboards.
N/A
Posit
Score10 out of 10
N/A
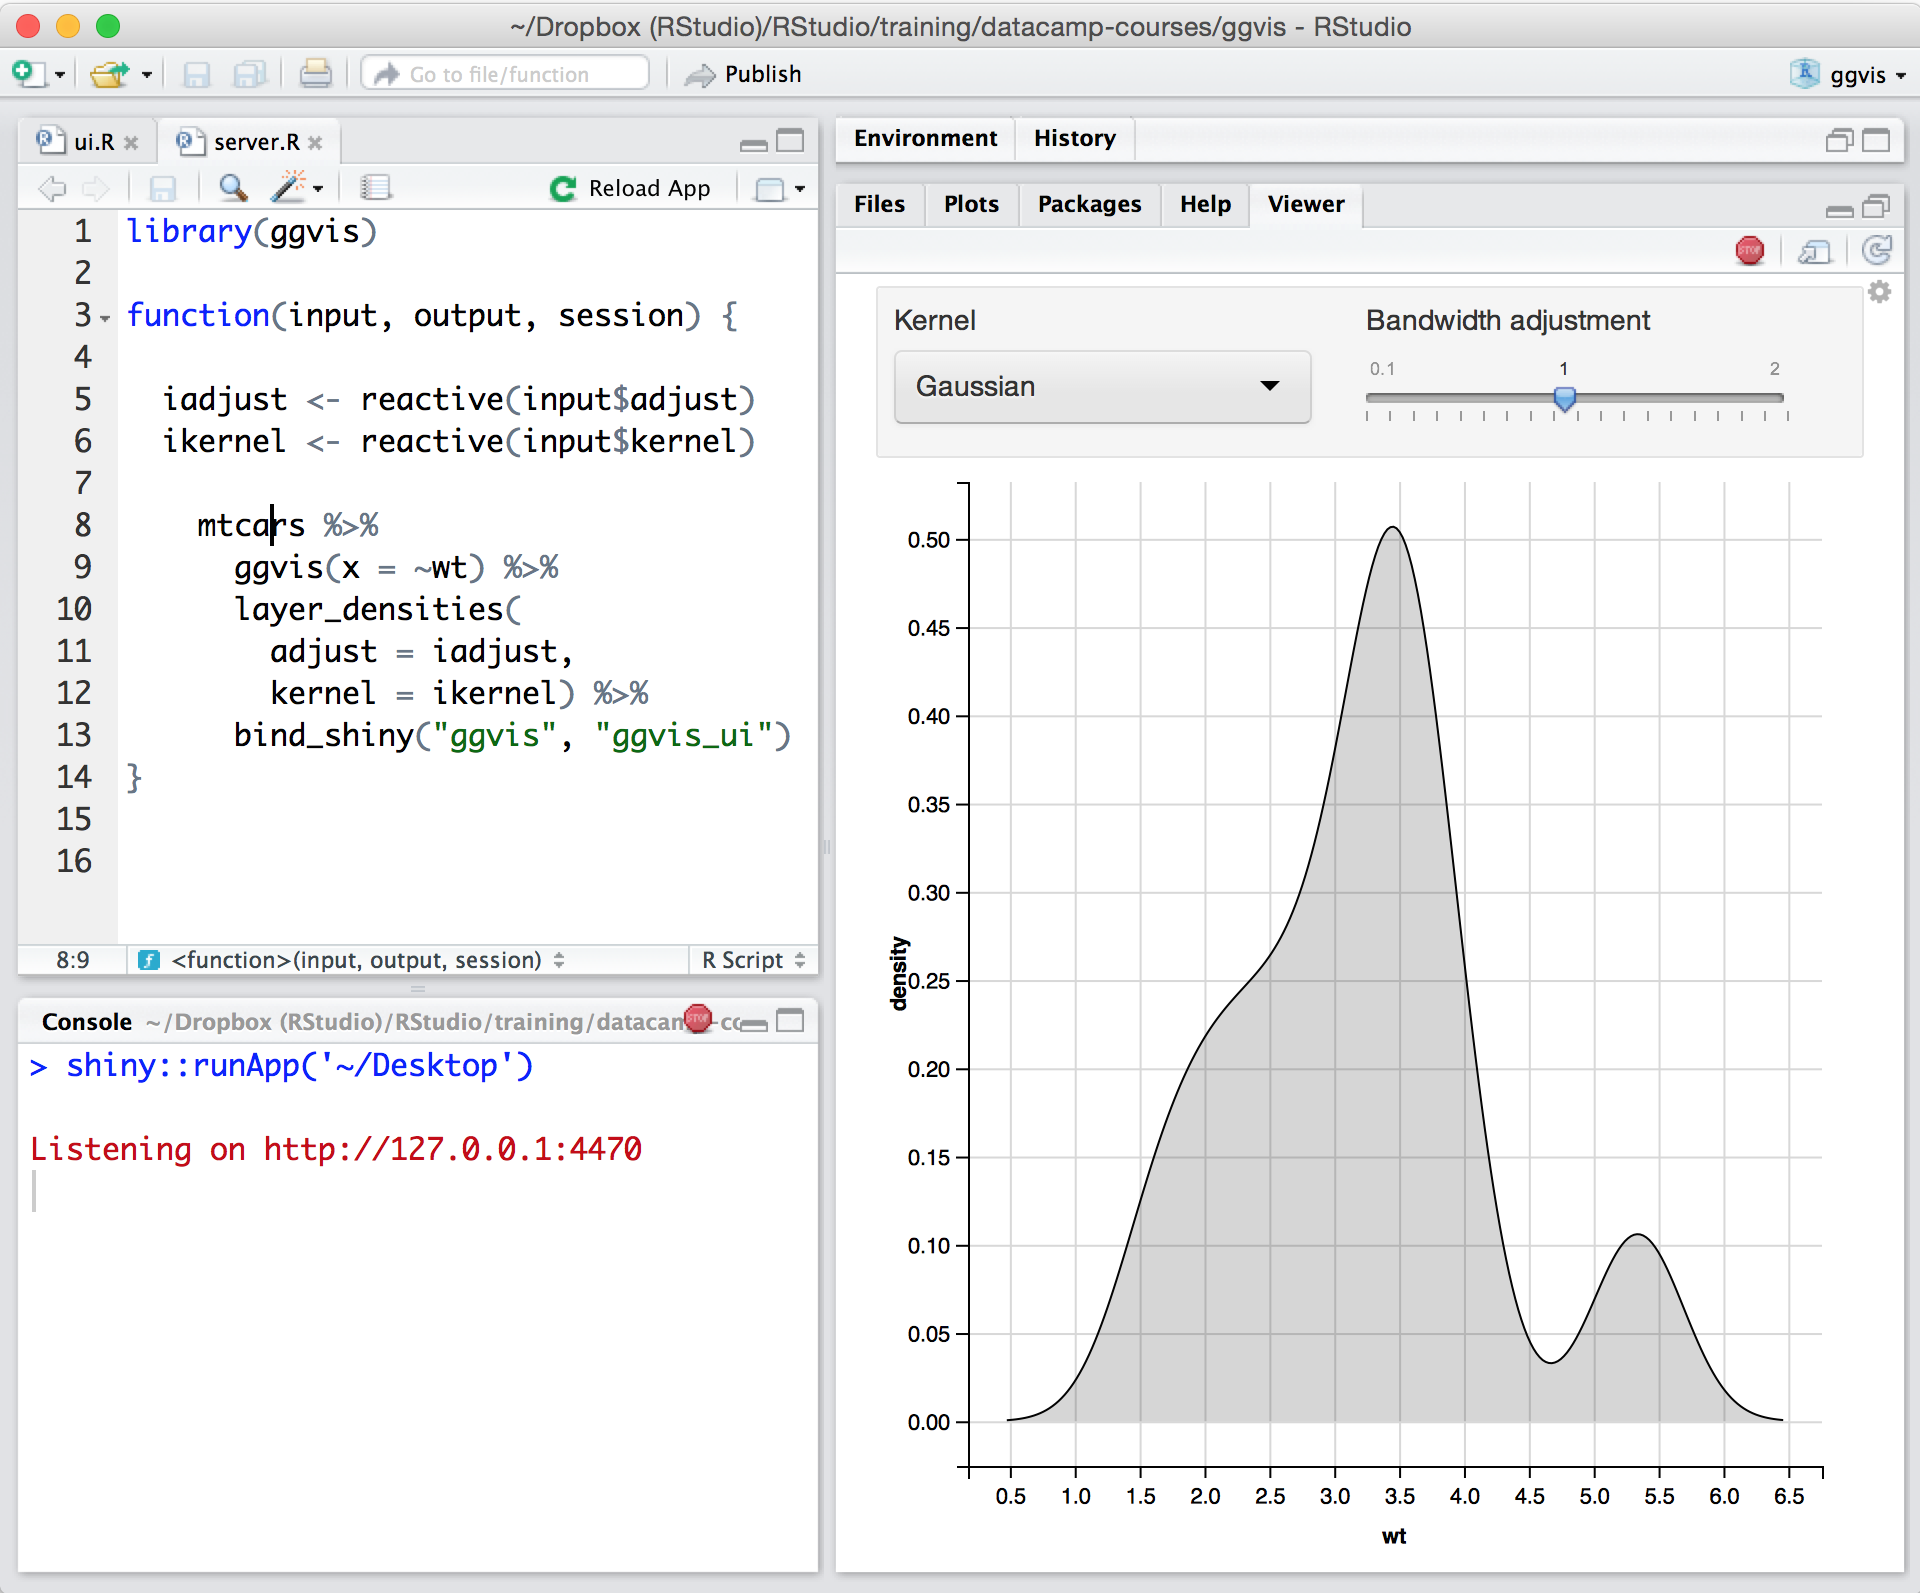
Posit, formerly RStudio, is a modular data science platform, combining open source and commercial products.
If you do not have a large budget and are a large organization, I would steer clear of Actuate. If you are looking to do very complex washboarding, I would not use them. Your developers have to be very skilled to work with this. Plan to bring in consultants if necessary to help your process. Adhoc reporting is weak. If your pricing is user based and you expand, this could be very expensive.
In my humble opinion, if you are working on something related to Statistics, RStudio is your go-to tool. But if you are looking for something in Machine Learning, look out for Python. The beauty is that there are packages now by which you can write Python/SQL in R. Cross-platform functionality like such makes RStudio way ahead of its competition. A couple of chinks in RStudio armor are very small and can be considered as nagging just for the sake of argument. Other than completely based on programming language, I couldn't find significant drawbacks to using RStudio. It is one of the best free software available in the market at present.
A de minimis incentive was given to thank the reviewer for their time. The incentive was not used to bias or drive a particular response, nor was the incentive contingent on a positive endorsement. TR verified that a representative sample of customers was invited. More Info
A de minimis incentive was given to thank the reviewer for their time. The incentive was not used to bias or drive a particular response, nor was the incentive contingent on a positive endorsement. More Info
The support is incredibly professional and helpful, and they often go out of their way to help me when something doesn't work.
The one-click publishing from RStudio Connect is absolutely amazing, and I really like the way that it deploys your exact package versions, because otherwise, you can get in a terrible mess.
Python doesn't feel quite as native as R at the moment but I have definitely deployed stuff in R and Python that works beautifully which is really nice indeed.
A de minimis incentive was given to thank the reviewer for their time. The incentive was not used to bias or drive a particular response, nor was the incentive contingent on a positive endorsement. More Info
A de minimis incentive was given to thank the reviewer for their time. The incentive was not used to bias or drive a particular response, nor was the incentive contingent on a positive endorsement. More Info
Python integration is newer and still can be rough, especially with when using virtual environments.
RStudio Connect pricing feels very department focused, not quite an enterprise perspective.
Some of the RStudio packages don't follow conventional development guidelines (API breaking changes with minor version numbers) which can make supporting larger projects over longer timeframes difficult.
A de minimis incentive was given to thank the reviewer for their time. The incentive was not used to bias or drive a particular response, nor was the incentive contingent on a positive endorsement. TR verified that a representative sample of customers was invited. More Info
I am no longer working for the company that was using Actuate but I believe they would continue to use it because the stitching costs would be to high. It would require a complete rewrite of the reports and the never version of Actuate (BIRT) even required an almost complete report rewrite
A de minimis incentive was given to thank the reviewer for their time. The incentive was not used to bias or drive a particular response, nor was the incentive contingent on a positive endorsement. More Info
There is no viable alternative right now. The toolset is good and the functionality is increasing with every release. It is backed by regular releases and ongoing development by the RStudio team. There is good engagement with RStudio directly when support is required. Also there's a strong and growing community of developers who provide additional support and sample code.
A de minimis incentive was given to thank the reviewer for their time. The incentive was not used to bias or drive a particular response, nor was the incentive contingent on a positive endorsement. TR verified that a representative sample of customers was invited. More Info
It is quite intuitive to use. It is fit specifically for doing sentiment, emotion, and intention analysis as well as text classification and text summarization. I would have given 10 if it is fit for the purpose of doing image processing and analysis as well. There is a huge market to analyze video and image data.
A de minimis incentive was given to thank the reviewer for their time. The incentive was not used to bias or drive a particular response, nor was the incentive contingent on a positive endorsement. More Info
For someone who learns how to use the software and picks up on the "language" of R, it's very easy to use. For beginners, it can be hard and might require a course, as well as the appropriate statistical training to understand what packages to use and when
A de minimis incentive was given to thank the reviewer for their time. The incentive was not used to bias or drive a particular response, nor was the incentive contingent on a positive endorsement. More Info
RStudio is very available and cheap to use. It needs to be updated every once in a while, but the updates tend to be quick and they do not hinder my ability to make progress. I have not experienced any RStudio outages, and I have used the application quite a bit for a variety of statistical analyses
A de minimis incentive was given to thank the reviewer for their time. The incentive was not used to bias or drive a particular response, nor was the incentive contingent on a positive endorsement. TR verified that a representative sample of customers was invited. More Info
Since R is trendy among statisticians, you can find lots of help from the data science/ stats communities. If you need help with anything related to RStudio or R, google it or search on StackOverflow, you might easily find the solution that you are looking for.
A de minimis incentive was given to thank the reviewer for their time. The incentive was not used to bias or drive a particular response, nor was the incentive contingent on a positive endorsement. More Info
It is vastly superior to these in many ways, for complex reporting it is a much more sophisticated solution. Visualizations are very good. Javascript extensibility is very powerful, others don't support this or as well. Pentaho and MS are both OLAP oriented. Pentaho is moving more toward big data, which was not our primary focus. Others are stuck in the Crystal Reports Band metaphor.
RStudio was provided as the most customizable. It was also strictly the most feature-rich as far as enabling our organization to script, run, and make use of R open-source packages in our data analysis workstreams. It also provided some support for python, which was useful when we had R heavy code with some python threaded in. Overall we picked Rstudio for the features it provided for our data analysis needs and the ability to interface with our existing resources.
A de minimis incentive was given to thank the reviewer for their time. The incentive was not used to bias or drive a particular response, nor was the incentive contingent on a positive endorsement. TR verified that a representative sample of customers was invited. More Info
RStudio is very scalable as a product. The issue I have is that it doesn't necessarily fit in nicely with the mainly Microsoft environment that everybody else is using. Having RStudio for us means dedicated servers and recruiting staff who know how to manage the environment. This isn't a fault of the product at all, it's just part of the data science landscape that we all have to put up with. Having said that RStudio is absolutely great for running on low spec servers and there are loads of options to handle concurrency, memory use, etc.
A de minimis incentive was given to thank the reviewer for their time. The incentive was not used to bias or drive a particular response, nor was the incentive contingent on a positive endorsement. More Info
Actuate can handle 50 to 60 sub reports inside a report very well.
Dynamically creating the datasource, chart, graph, reports are the main advantages. We can do any level of drilling, and can create a performance matrix dashboard efficiently.
Using it for data science in a very big and old company, the most positive impact, from my point of view, has been the ability of spreading data culture across the group. Shortening the path from data to value.
Still it's hard to quantify economic benefits, we are struggling and it's a great point of attention, since splitting out the contribution of the single aspects of a project (and getting the RStudio pie) is complicated.
What is sure is that, in the long run, RStudio is boosting productivity and making the process in which is embedded more efficient (cost reduction).
A de minimis incentive was given to thank the reviewer for their time. The incentive was not used to bias or drive a particular response, nor was the incentive contingent on a positive endorsement. TR verified that a representative sample of customers was invited. More Info