NETSCOUT TruView is a unified network monitoring and APM tool. TruView is deployed as hardware on-premises, and it can automate capacity planning and environment discovery and configuration.
N/A
PingPlotter
Score9.3 out of 10
N/A
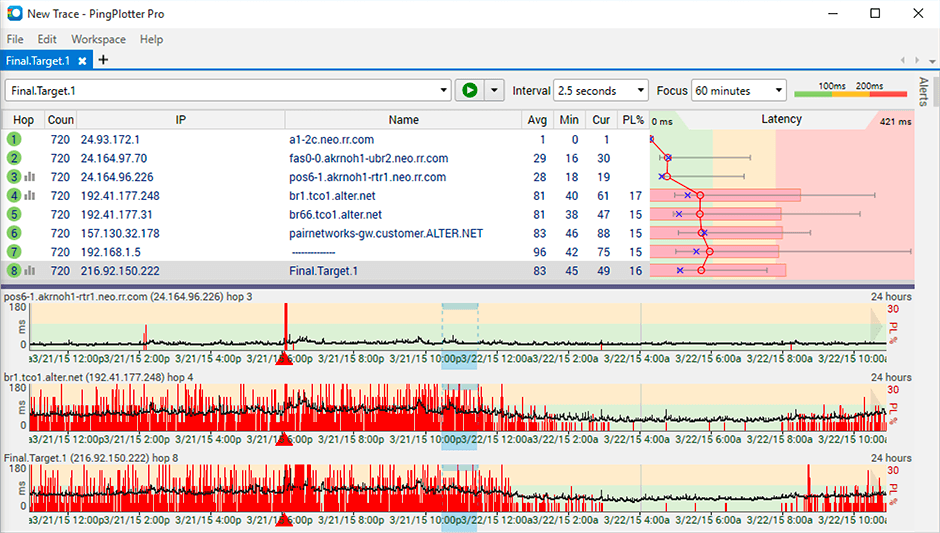
PingPlotter is a graphical traceroute and ping tool that visualizes network performance in a way that makes identifying the source of problems quicker and easier for everyone from online gamers and video streamers to VoIP admins and IT pros. Features for remote deployment, network monitoring, scripting, and a web interface are included along with several additional capabilities.
Netscout’s TruView monitoring system gives your IT department the perfect view of your network landscape. With the pulse hardware app, you can perform VoIP or HTTP network monitoring tests from specific remote locations and it will populate the analysis results into your console. This will give you perspective on how your sites are performing and detect any out of Service Level Agreement (SLA) performance even before users report it.
A de minimis incentive was given to thank the reviewer for their time. The incentive was not used to bias or drive a particular response, nor was the incentive contingent on a positive endorsement. More Info
It is well suited for performing monitoring and testing from a single device. It is less appropriate if you have to monitor from multiple different endpoints. That type of deployment would be more of an enterprise application. If you are looking for an end user monitoring solution then PingPlotter is the one for you.
A de minimis incentive was given to thank the reviewer for their time. The incentive was not used to bias or drive a particular response, nor was the incentive contingent on a positive endorsement. More Info
The app monitoring gives you the details to set different filters and do a quick identification of the root cause of the problem.
Remarkable ability to store details of performance to analyze baselining, run advance troubleshooting, error detection and catalog by trends.
The ability to sync with a device/interface whether is physical or virtual gives me the standpoint to set analysis upon network traffic across LAN or WAN and also get the insight of Cloud segments, setting the triggers to find out where the behavior changes to non-production traffic.
A de minimis incentive was given to thank the reviewer for their time. The incentive was not used to bias or drive a particular response, nor was the incentive contingent on a positive endorsement. More Info
Product features are sometimes overwhelming if the IT team is not used to this technology. For a small and mid-size company, the number of settings and work that is needed to implement the solution could be a long and exhausting process.
A "lite" version of Visual TruView could help a lot to small sized environments looking to develop the solution.
I would like to add some mitigation tools for simple/common problems that could be easily managed by a monitoring tool like Netscout TruView.
A de minimis incentive was given to thank the reviewer for their time. The incentive was not used to bias or drive a particular response, nor was the incentive contingent on a positive endorsement. More Info
Its a little confusing to see which targets are currently running pings and which ones are displayed in the plots.
Starting and stopping pings requires a right click and that would be better with a play/pause button I think.
Ability to drag and drop the graphs to reorder them.
more columns to show which targets are running and which are displayed. Currently this is done with symbols so you cant sort by just the running targets for example I've found.
A de minimis incentive was given to thank the reviewer for their time. The incentive was not used to bias or drive a particular response, nor was the incentive contingent on a positive endorsement. More Info
I installed it and it just started working. I realized I could then tweak it to show what I needed but didn't have to spend a long time configuring it before use, editing YAML files etc. Maybe that's fine for a network professional, but I only need this software if something goes wrong, and then need it to work quickly out of the box.
A de minimis incentive was given to thank the reviewer for their time. The incentive was not used to bias or drive a particular response, nor was the incentive contingent on a positive endorsement. More Info
As mentioned before, our deployment success depended on their expertise. Recommendations and overall response from their support engineers was out of this world. We, as supporters ourselves, are very critical in regards to the response times and knowledge of support services representatives. Often they just want to resolve your ticket not caring about the result, or focus only on the performance review we could give them. That's a standard behavior in most overseas support centers. The TruView engineers and management cared about us, our needs, and how they delivered the help we needed.
A de minimis incentive was given to thank the reviewer for their time. The incentive was not used to bias or drive a particular response, nor was the incentive contingent on a positive endorsement. More Info
I have not had much contact with the PingPlotter support, only one time have I went to them and it was a positive experience. The questions I had were answered quickly and professionally. I have no issue with the experience I had with the Support team. This was from before and after the purchase of the product.
A de minimis incentive was given to thank the reviewer for their time. The incentive was not used to bias or drive a particular response, nor was the incentive contingent on a positive endorsement. More Info
Visual TruView is a solid competitor with solutions such as SolarWinds NPM, Nagios, PRTG, or SolarWinds NTA. Why we chose TruView was because it goes straight to what we were looking for, no hidden modules or subscriptions to secondaries licensing terms, to get the results that we were expecting. TruView takes it to another level.
A de minimis incentive was given to thank the reviewer for their time. The incentive was not used to bias or drive a particular response, nor was the incentive contingent on a positive endorsement. More Info
A balance of a generic tool vs a network equipment product is necessary when investigating network incidents or disruptions. Need to train the engineer to use both tools to perform their analysis and to dive down to the issues as fast as they can. Experience with the tools will continue to play a part if we were to adopt PingPlotter
A de minimis incentive was given to thank the reviewer for their time. The incentive was not used to bias or drive a particular response, nor was the incentive contingent on a positive endorsement. More Info
Tool consolidation, an amazing GUI that shows the most from the very beginning helping the IT Teams to set their own dashboards according to their needs.
When they meant one price tag, that's it! You won't get a headache after the purchase process is done.
Better be ready to set the scales your organization requires because if you miss something in the design you could get an application size that overrides your initial budget.
A de minimis incentive was given to thank the reviewer for their time. The incentive was not used to bias or drive a particular response, nor was the incentive contingent on a positive endorsement. More Info
A de minimis incentive was given to thank the reviewer for their time. The incentive was not used to bias or drive a particular response, nor was the incentive contingent on a positive endorsement. More Info