NetBrain Technologies vs. Retrace

Overview
ProductRatingMost Used ByProduct SummaryStarting Price
NetBrain Technologies
Score 9.2 out of 10
N/A
NetBrain, founded in 2004, provides a no-code automation platform for hybrid network observability, allowing organizations to enhance their operational efficiency through automated workflows. The platform applies automation across three key workflows: troubleshooting, change management, and assessment.N/A
Retrace
Score 8.0 out of 10
N/A
Retrace (formerly APM+) is a lightweight Application Performance Management solution. Retrace gives developers continuous, real-time analysis through a combination of code-level visibility with in-line log and error data. Retrace helps identify top performance offenders by analyzing top page requests, top SQL queries, and top external web services.
$99
up to 3 servers, 500,000 traces, and 1,000,000 logs
Pricing
NetBrain TechnologiesRetrace
Editions & Modules
No answers on this topic
Essentials
$99
up to 3 servers, 500,000 traces, and 1,000,000 logs
Standard
249+
2,000,000+ traces and 5,000,000+ logs
Enterprise
Custom
Customer number of traces and logs
Offerings
Pricing Offerings
NetBrain TechnologiesRetrace
Free Trial
YesYes
Free/Freemium Version
NoNo
Premium Consulting/Integration Services
NoNo
Entry-level Setup FeeNo setup feeNo setup fee
Additional DetailsPricing is based on trace and log usage.
More Pricing Information
Community Pulse
NetBrain TechnologiesRetrace
Best Alternatives
NetBrain TechnologiesRetrace
Small Businesses
InfluxDB
InfluxDB
Score 8.8 out of 10
InfluxDB
InfluxDB
Score 8.8 out of 10
Medium-sized Companies
Sumo Logic
Sumo Logic
Score 9.4 out of 10
Sumo Logic
Sumo Logic
Score 9.4 out of 10
Enterprises
Sumo Logic
Sumo Logic
Score 9.4 out of 10
NetBrain Technologies
Score 9.2 out of 10
All AlternativesView all alternativesView all alternatives
User Ratings
NetBrain TechnologiesRetrace
Likelihood to Recommend
9.6
(0 ratings)
8.0
(0 ratings)
Usability
10.0
(0 ratings)
-
(0 ratings)
User Testimonials
NetBrain TechnologiesRetrace
Likelihood to Recommend
Although there are many products in the market that provides very simple and easy fault and performance monitoring metrics in notification format, reports and emails etc However NetBrain is a specialized tool when it comes to network issues troubleshooting for various kind of scenarios such as multicasting issues in a site can be detected live and bottle neck can be highlighted by a simple click of troubleshooting button.
Read full review
If you're a Java or .net shop they will do excellent. I believe that for PHP, Ruby, Java and few others they have only the error and log management and the application and server monitoring.
Read full review
Pros
  • Network discovery
  • Config comparation
  • Runbooks
Read full review
  • Integration of performance management with log management so you get the parameters sent
  • In-line log and error data in trace
  • Integration of error and log data, so in one click you can see all the logs recorded when an error was thrown
  • Very reasonably priced
Read full review
Cons
  • After every release one or the other things stop working
  • API call to create INC's in SNOW,Remedy
Read full review
  • To set up the fields that APM Plus monitors, you need to map each field area on each document.
  • APM Plus could use a way to link the documents back into the finance or business software so you can find the document under the PO, Sales Order, Invoice, etc.
  • APM Plus setup is only for the professionals. There are many areas that need tweaking on setup, having a better default setup would lessen the learning curve to set it up for use.
Read full review
Usability
This is a easly tool that i've worked.
Read full review
No answers on this topic
Alternatives Considered
The others were cumbersome, slow and there is a huge learning curve for the installation, configuration and just daily monitoring. NetBrain was the easiest of all to setup then let it run and build our network and map it out. Once it was complete, we immediately identified several circuit issues that we were unaware of within our network. With the maps and information gained, we were able to present to [management] and prove a case that we needed larger circuits in several areas.
Read full review
APM Plus does a better job of archiving documents than DocSend and makes it easier to find the documents when you need them. DocSend seemed to be more of a marketing tool than a business tool. APM Plus is all business and consistently does what you need on a daily basis. We selected APM Plus because of the great support on setup and after implementation. They are always ready to help.
Read full review
Return on Investment
  • Network automation is up to date.
  • Quicker failure discovery and resolving due to the path discovery.
  • Less time spent on documentation.
  • Much more details in the documentation.
Read full review
  • APM Plus has freed up users from having to manually attach documents to each place they are sending it. APM Plus will do it automatically.
  • APM Plus provides a searchable archive to re-visit sent documents with customers and vendors. Having to reprint a document you risk the potential that something has changed since it was last printed.
  • APM Plus does need IT staff for adjustments and to review sending problems. Not for an average user.
Read full review
ScreenShots

NetBrain Technologies Screenshots

Screenshot of how NetBrain defines what can be assessed in a network, how often it can be assessed, and how it scales through no-code automation.Screenshot of what a Golden Path through a hybrid cloud looks likeScreenshot of how using no-code network automation can cover all aspects of a network.

Retrace Screenshots

Screenshot of Detailed stack trace with inline error and logsScreenshot of Web Apps Dashboard:
The Apps Page gives you a high-level overview of all applications found and monitored across all servers in each environment. Click on any app to take you to the App Dashboard to view more information for a particular app.Screenshot of Apps Dashboard:
The App Dashboard is a powerful monitoring and troubleshooting perspective that gives you a view of application health across one or more environments.Screenshot of Performance (APM+) Dashboard:
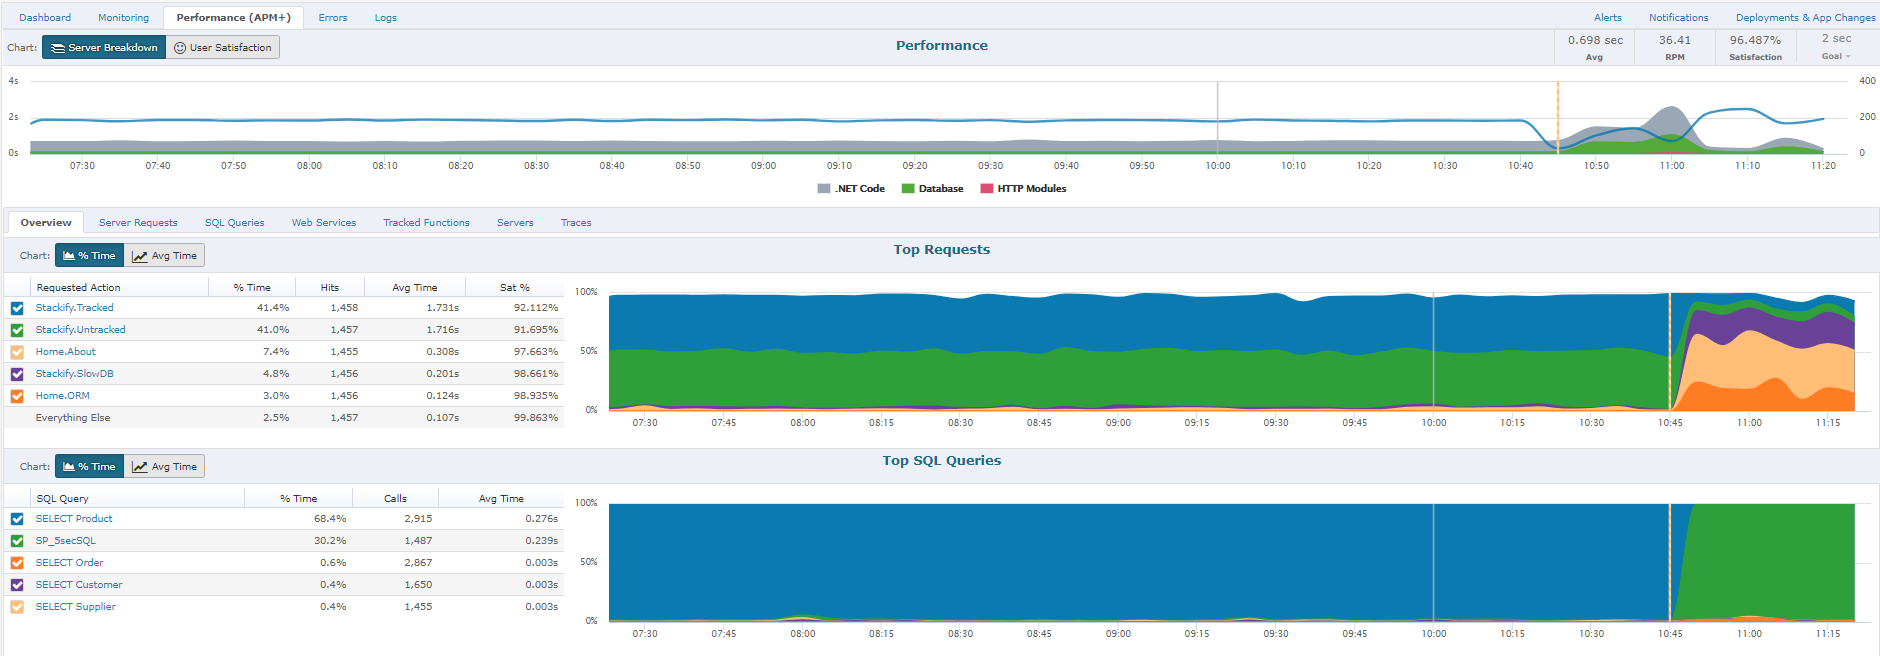
The Performance section will give you a report of how well the application is performing overall, as perceived by your users.  A graph will allow you to view all requests by Satisfaction by viewing "Fast", "Sluggish", "Too Slow", or "Failed" types of requests.  Another report includes graphs of HTTP Error%, Satisfaction Score%, and Page Load Time.  Lastly, you will have the ability to sort each page request of your App by different categories: Satisfaction, Slowest page, Failed pages, pages hit, and total load time.  By clicking on an individual page a Performance Details page with further information about that specific page's health, performance, and errors will be displayed.Screenshot of Performance Traces:
One of the ways we strive to deliver relevant insights is to only collect traces around interesting requests. Some examples of these request types that are interesting would be faster than normal, slower than normal, new web requests, requests introducing new SQL, requests introducing new exceptions, or abnormal satisfaction scores. Under performing requests will be profiled more often than fast requests. As long as the app is getting steady traffic Retrace should be saving a trace every 5 to 15 minutes.Screenshot of Errors Dashboard:
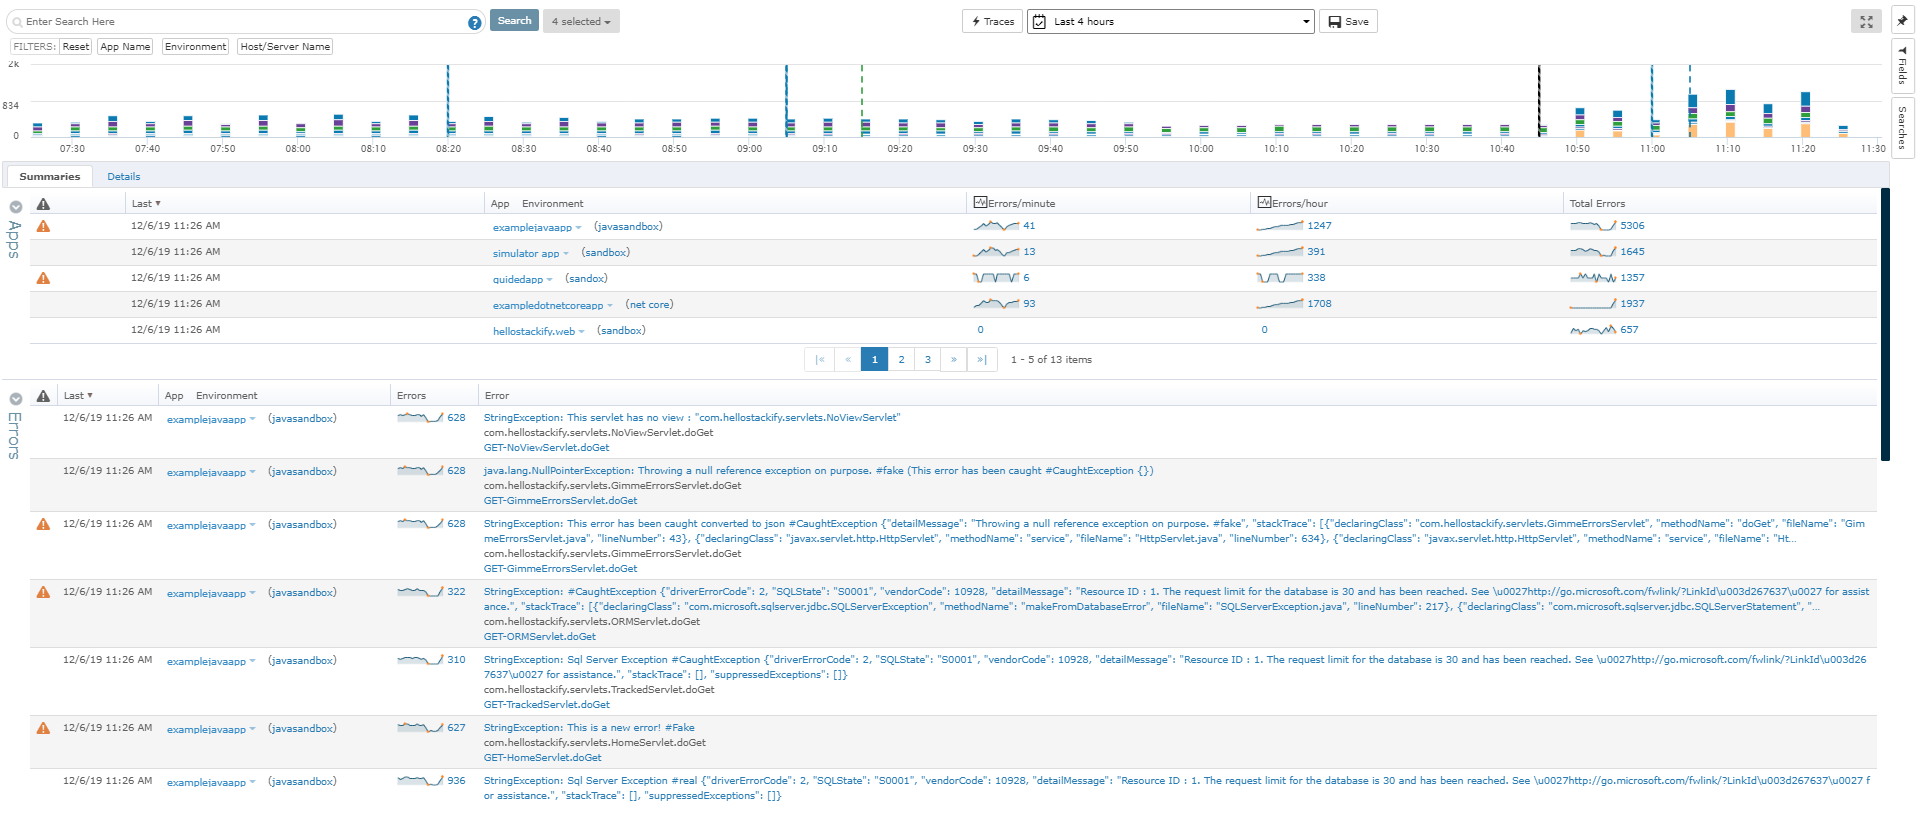
From the Errors Dashboard, you can get an overview of all the exceptions of all your applications across different environments. It gives you a central location to view details about your errors.