Dynatrace is an APM scaled for enterprises with cloud, on-premise, and hybrid application and SaaS monitoring. Dynatrace uses AI-supported algorithms to provide continual APM self-learning and predictive alerts for proactive issue resolution.
$0
per synthetic request
NetApp Cloud Insights
Score 9.2 out of 10
N/A
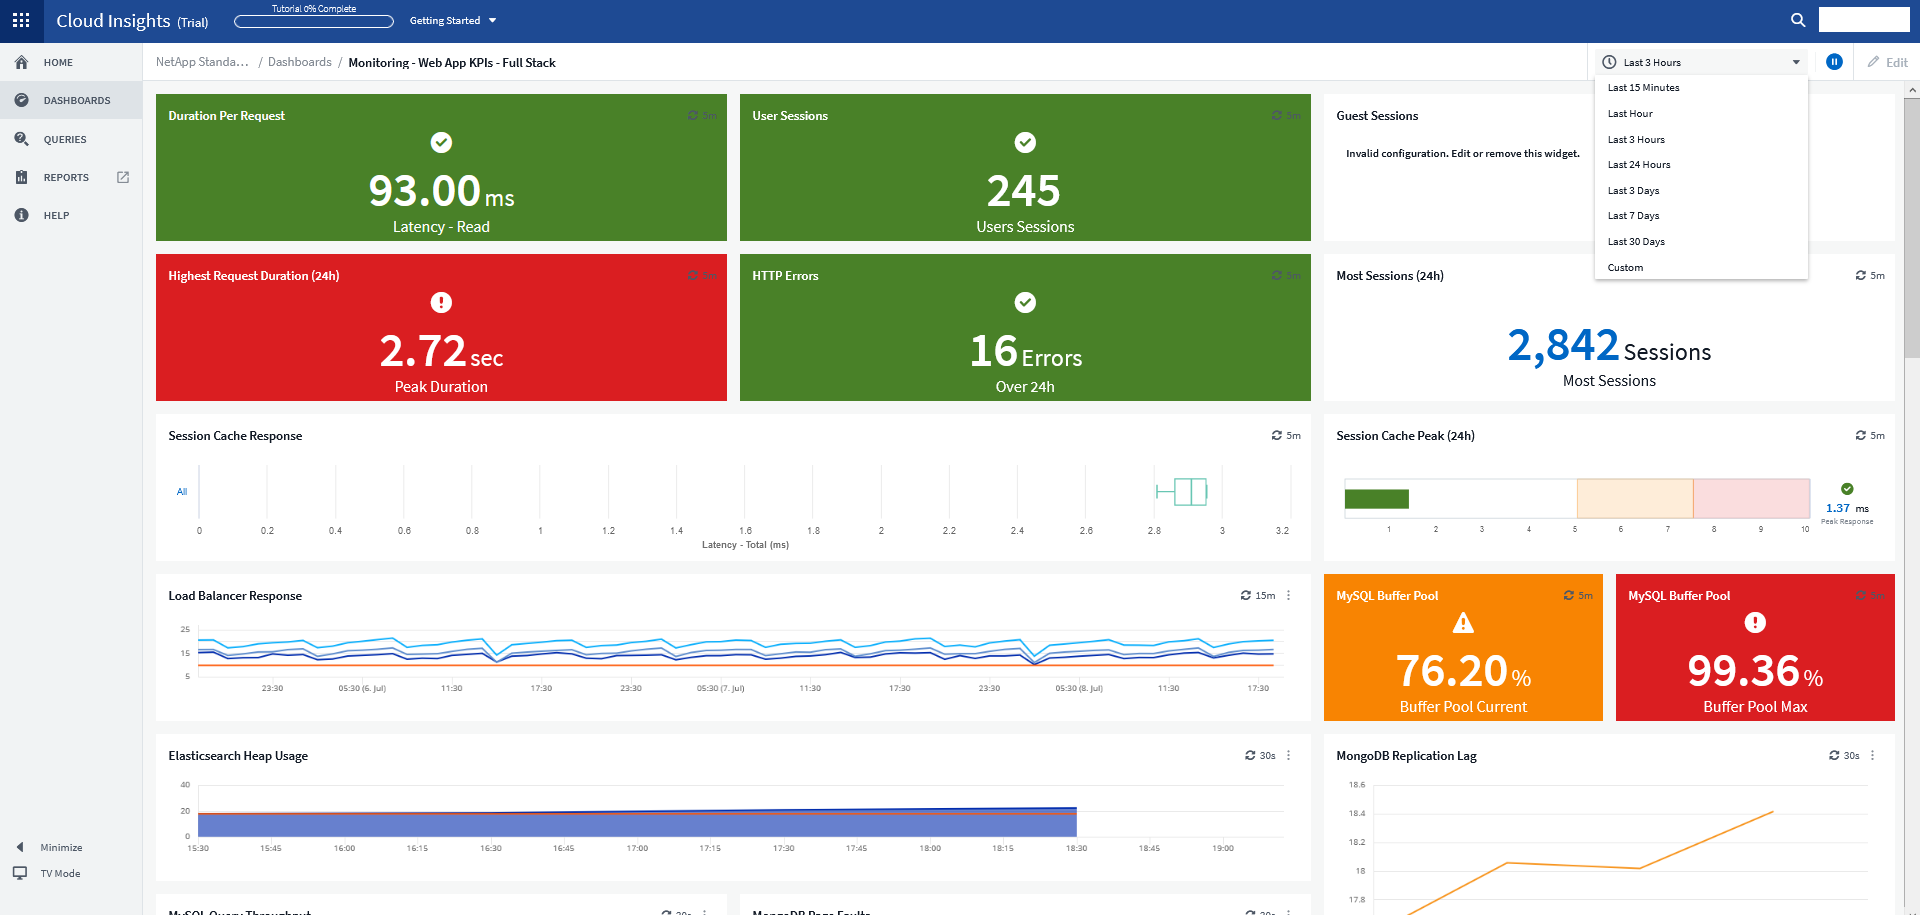
NetApp Cloud Insights is an infrastructure monitoring tool that gives
users visibility into their complete infrastructure. With Cloud Insights, users can monitor, troubleshoot and optimize all resources including
public clouds and private data centers.
Dynatrace is well suited to a number of tasks. It is important to determine who the end users are and gather good information to tailor their experience accordingly. For instance, business/marketing should not have access to some of the more technical data, and business metrics can be a distraction for IT operations personnel.
For example, we had an application slowdown. It looked like the slowdown was storage. However, it was a malformed SQL query that no one realized was pulling data from the storage location that also housed the application. Cloud Insights saved us hours of downtime and frustration. Cloud Insights pinpointed which system was hogging resources. What makes Cloud Insights special is the way it looks at the data collected from the data sources. The insights it provides into the flow of data; sheds new light on how things work in your environment.
We loved Dynatrace's ability to show the data flow - from the front end points through the back end points straight to the database and various API's. It was advanced in its data visualization. This is useful for debugging - showing when/where the errors are. It can even enable non-technical individuals in the corporation to help debug
Dynatrace has some great highly customizable integration options as well as monitoring. You can configure your layout & integration options to create custom monitoring alerts for your applications performance. Further you can increase the extensibility of using a REST API on your architecture.
Some advanced dev-ops systems are utilizing Kubernetes/docker aswell as Node.JS - Dynatrace was able to log and help understand all of our dev-ops needs. It gave us native alerts based off of deviations from the baseline that we set during initial configuration. These metrics are priceless.
Dynatrace does not monitor easily on a C-based application.
The way DPGR is addressed by Dynatrace is not very complete, and not clear. One thing is to mask the IP and request attributes but is not enough, the replay session feature is great but raises serious questions about user tracking.
We have got tremendous support and response from the dynatrace support team as well as the larger community. We still have issues like the lack of role based administration, but we are told that it may be coming in a future release. The team is very supportive and has assisted us in several tough situations.
Dynatrace is great to use once you understand how to use it correctly and get used to the layout of it. While I do not actively use it every day, whenever I do use it, I do have to get refamiliarized with it. However, once you have your dashboards setup correctly with the data that you want to see when you first login to Dynatrace, it's amazing.
I have been extremely happy with its usability. You can take thins as they are out of the box and it is useful. You can carry it as far as you want to go and every step you take improves your ROI.
I wish I could have given the ten points but based on my experience in past I am reducing by two points as the penalty. But I am sure that it will have improved in the past few months. They need some improvement on ticket handling. Overall I appreciate some of the support folks who responded quickly and also were ready to jump on the Webex and get the problem understood to fix it.
Before using Cloud Insights, we quickly resolved all the issues we had by talking with the support team. The support team is eager to assist and technically well equipped. They quickly understood what we needed and helped us during the setup and the first use period so that we could adapt easily.
Like I mentioned earlier, Dynatrace is a great tool but comes with a heavy price tag. On the other hand, Foglight offers a slightly lower level of expertise in application monitoring but fulfils almost all the requirements you would commonly have. The only major feature lacking in Foglight is the predictive monitoring feature. If you are an SME struggling with budgets, then predictive monitoring is something you can certainly live without.
Cloud Insights allows us to create custom dashboards to monitor and trend any aspect of their infrastructure including CPU, memory, storage network utilization, IOPS, capacity utilization and more. Cloud Insights also provides visibility into the inter-connectivity of the components in our infrastructure by providing topology views of any component.