Nagios provides monitoring of all mission-critical infrastructure components. Multiple APIs and community-build add-ons enable integration and monitoring with in-house and third-party applications for optimized scaling.
N/A
PingPlotter
Score9.3 out of 10
N/A
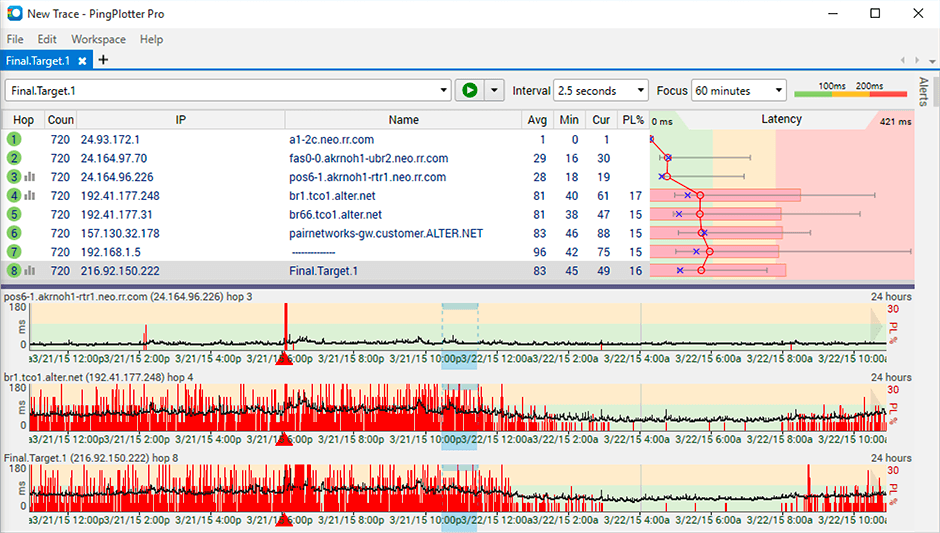
PingPlotter is a graphical traceroute and ping tool that visualizes network performance in a way that makes identifying the source of problems quicker and easier for everyone from online gamers and video streamers to VoIP admins and IT pros. Features for remote deployment, network monitoring, scripting, and a web interface are included along with several additional capabilities.
Nagios monitoring is well suited for any mission critical application that requires per/second (or minute) monitoring. This would probably include even a shuttle launch. As Nagios was built around Linux, most (85%) plugins are Linux based, therefore its more suitable for a Linux environment.
As Nagios (and dependent components) requires complex configurations & compilations, an experienced Linux engineer would be needed to install all relevant components.
Any company that has hundreds (or thousands) of servers & services to monitor would require a stable monitoring solution like Nagios. I have seen Nagios used in extremely mediocre ways, but the core power lies when its fully configured with all remaining open-source components (i.e. MySQL, Grafana, NRDP etc). Nagios in the hands of an experienced Linux engineer can transform the organizations monitoring by taking preventative measures before a disaster strikes.
A de minimis incentive was given to thank the reviewer for their time. The incentive was not used to bias or drive a particular response, nor was the incentive contingent on a positive endorsement. More Info
It is well suited for performing monitoring and testing from a single device. It is less appropriate if you have to monitor from multiple different endpoints. That type of deployment would be more of an enterprise application. If you are looking for an end user monitoring solution then PingPlotter is the one for you.
A de minimis incentive was given to thank the reviewer for their time. The incentive was not used to bias or drive a particular response, nor was the incentive contingent on a positive endorsement. More Info
A de minimis incentive was given to thank the reviewer for their time. The incentive was not used to bias or drive a particular response, nor was the incentive contingent on a positive endorsement. More Info
Nagios could use core improvements in HA, though, Nagios itself recommends monitoring itself with just another Nagios installation, which has worked fine for us. Given its stability, and this work-around, a minor need.
Nagios could also use improvements, feature wise, to the web gui. There is a lot in Nagios XI which I felt were almost excluded intentionally from the core project. Given the core functionality, a minor need. We have moved admin facing alerts to appear as though they originate from a different service to make interacting with alerts more practical.
A de minimis incentive was given to thank the reviewer for their time. The incentive was not used to bias or drive a particular response, nor was the incentive contingent on a positive endorsement. More Info
Its a little confusing to see which targets are currently running pings and which ones are displayed in the plots.
Starting and stopping pings requires a right click and that would be better with a play/pause button I think.
Ability to drag and drop the graphs to reorder them.
more columns to show which targets are running and which are displayed. Currently this is done with symbols so you cant sort by just the running targets for example I've found.
A de minimis incentive was given to thank the reviewer for their time. The incentive was not used to bias or drive a particular response, nor was the incentive contingent on a positive endorsement. More Info
We're currently looking to combine a bunch of our network montioring solutions into a single platform. Running multiple unique solutions for monitoring, data collection, compliance reporting etc has become a lot to manage.
A de minimis incentive was given to thank the reviewer for their time. The incentive was not used to bias or drive a particular response, nor was the incentive contingent on a positive endorsement. More Info
The Nagios UI is in need of a complete overhaul. Nice graphics and trendy fonts are easy on the eyes, but the menu system is dated, the lack of built in graphing support is confusing, and the learning curve for a new user is too steep.
A de minimis incentive was given to thank the reviewer for their time. The incentive was not used to bias or drive a particular response, nor was the incentive contingent on a positive endorsement. More Info
I installed it and it just started working. I realized I could then tweak it to show what I needed but didn't have to spend a long time configuring it before use, editing YAML files etc. Maybe that's fine for a network professional, but I only need this software if something goes wrong, and then need it to work quickly out of the box.
A de minimis incentive was given to thank the reviewer for their time. The incentive was not used to bias or drive a particular response, nor was the incentive contingent on a positive endorsement. More Info
I haven't had to use support very often, but when I have, it has been effective in helping to accomplish our goals. Since Nagios has been very popular for a long time, there is also a very large user base from which to learn from and help you get your questions answered.
A de minimis incentive was given to thank the reviewer for their time. The incentive was not used to bias or drive a particular response, nor was the incentive contingent on a positive endorsement. More Info
I have not had much contact with the PingPlotter support, only one time have I went to them and it was a positive experience. The questions I had were answered quickly and professionally. I have no issue with the experience I had with the Support team. This was from before and after the purchase of the product.
A de minimis incentive was given to thank the reviewer for their time. The incentive was not used to bias or drive a particular response, nor was the incentive contingent on a positive endorsement. More Info
Because we get all we required in Nagios [Core] and for npm, we have to do lots of configuration as it is not as easy as Comair to Nagios [Core]. On npm UI, there is lots of data, so we are not able to track exact data for analysis, which is why we use Nagios [Core].
A balance of a generic tool vs a network equipment product is necessary when investigating network incidents or disruptions. Need to train the engineer to use both tools to perform their analysis and to dive down to the issues as fast as they can. Experience with the tools will continue to play a part if we were to adopt PingPlotter
A de minimis incentive was given to thank the reviewer for their time. The incentive was not used to bias or drive a particular response, nor was the incentive contingent on a positive endorsement. More Info
With it being a free tool, there is no cost associated with it, so it's very valuable to an organization to get something that is so great and widely used for free.
You can set up as many alerts as you want without incurring any fees.
A de minimis incentive was given to thank the reviewer for their time. The incentive was not used to bias or drive a particular response, nor was the incentive contingent on a positive endorsement. More Info
A de minimis incentive was given to thank the reviewer for their time. The incentive was not used to bias or drive a particular response, nor was the incentive contingent on a positive endorsement. More Info