Microsoft Power BI is a visualization and data discovery tool from Microsoft. It allows users to convert data into visuals and graphics, visually explore and analyze data, collaborate on interactive dashboards and reports, and scale across their organization with built-in governance and security.
$10
per month per user
Treasure Data
Score9 out of 10
Mid-Size Companies (51-1,000 employees)
Treasure Data is an enterprise customer data platform (CDP) that reclaims customer-centricity in the age of the digital customer. It does this by connecting all data and uniting teams and systems into one customer data platform to power purposeful engagements.
Has significantly improved collation of data and visualisation especially with business across Europe. Has given me the ability to see the Site availability at the click of a button to see which Site is in the "money" and seize opportunities based on Market data
A de minimis incentive was given to thank the reviewer for their time. The incentive was not used to bias or drive a particular response, nor was the incentive contingent on a positive endorsement. More Info
Treasure Data is well suited to integrating multiple data sources, including online and digital sources. It is also well suited to trigger audience activations to known customers based on their online activity, integrating 3rd party data, and activating target audiences to ad platforms.
A de minimis incentive was given to thank the reviewer for their time. The incentive was not used to bias or drive a particular response, nor was the incentive contingent on a positive endorsement. More Info
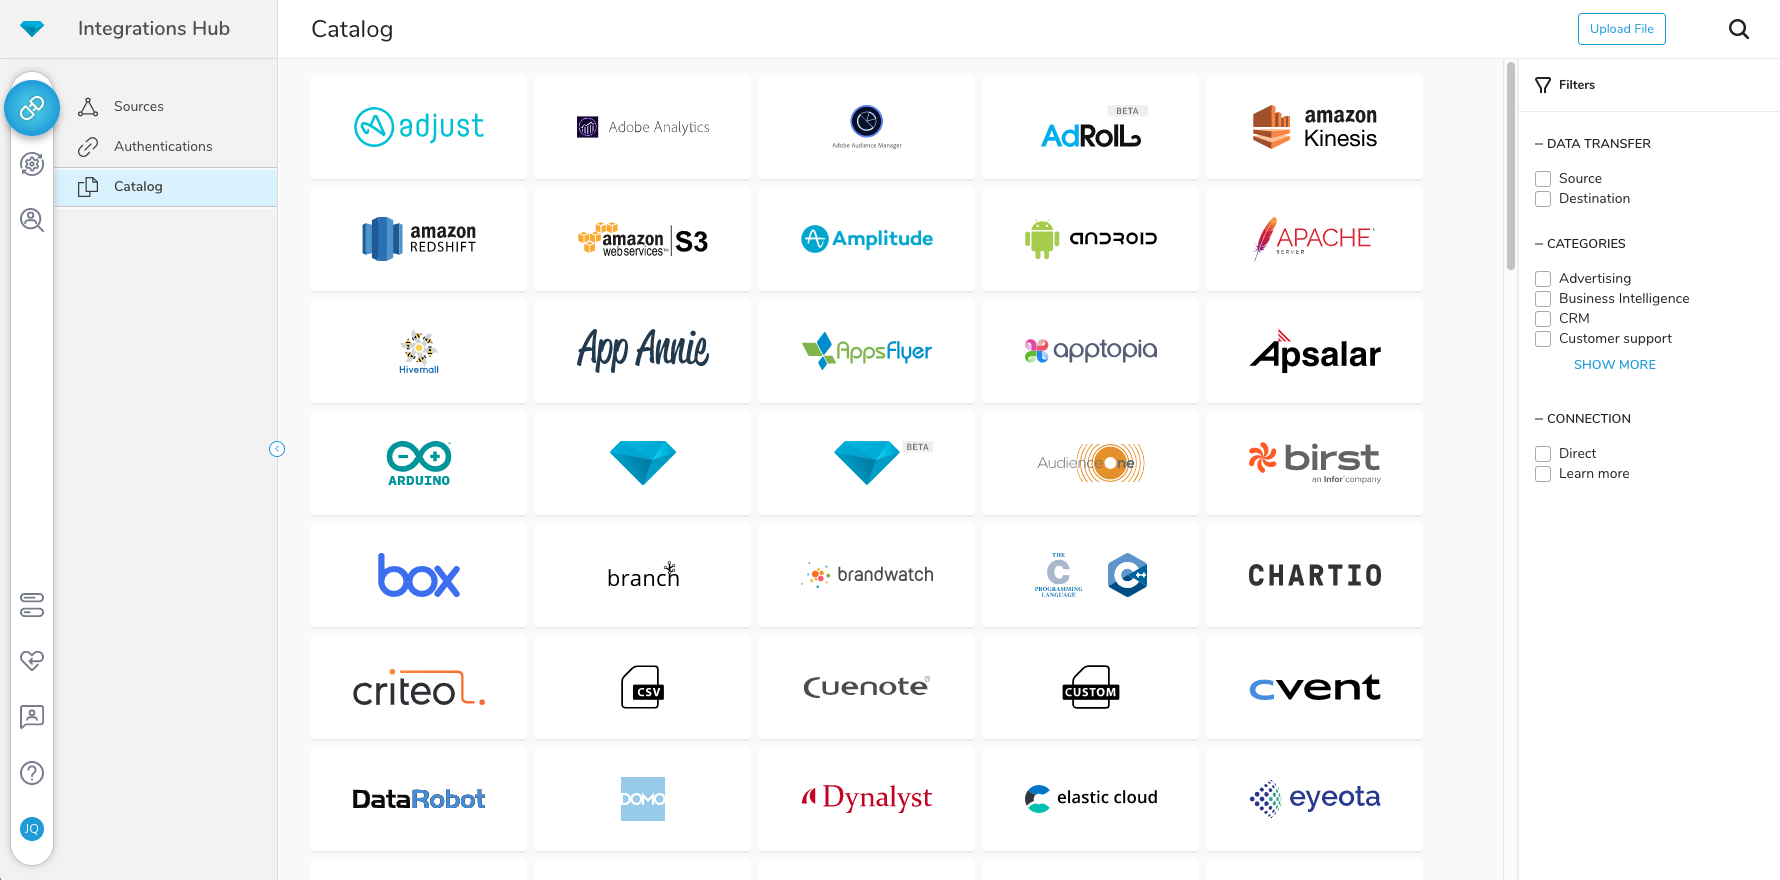
Options for data source connections are immense. Not just which sources, but your options for *how* the data is brought in.
Constant updates (this is both good and bad at times).
User friendliness. I can get the data connections set up and draft some quick visuals, then release to the target audience and let them expand on it how they want to.
A de minimis incentive was given to thank the reviewer for their time. The incentive was not used to bias or drive a particular response, nor was the incentive contingent on a positive endorsement. More Info
CDP provides a unified view of data from all touchpoints in the customer journey until a single customer uses the service. This feature is very helpful in making service decisions and direction.
It provides a variety of extensions to bring your data together in one place and helps you do this easily.
Kits provided by Treasure Box provide basic but helpful methods for further development of services.
A de minimis incentive was given to thank the reviewer for their time. The incentive was not used to bias or drive a particular response, nor was the incentive contingent on a positive endorsement. More Info
A de minimis incentive was given to thank the reviewer for their time. The incentive was not used to bias or drive a particular response, nor was the incentive contingent on a positive endorsement. More Info
A de minimis incentive was given to thank the reviewer for their time. The incentive was not used to bias or drive a particular response, nor was the incentive contingent on a positive endorsement. TR verified that a representative sample of customers was invited. More Info
Microsoft Power BI is an excellent and scalable tool. It has a learning curve, but once you get past that, the sky is the limit and you can build from the most simple to the most complex dashboards. I have built everything from simple reports with only a few data points to complex reports with many pages and advanced filtering.
I do think that we definitely will be renewing. We are putting major resources, time, and effort into Treasure Data becoming an extension of our organization, in many ways. We are working toward complete synergies with this product and leadership is very excited about the direction we are heading to be completely customer-centric.
A de minimis incentive was given to thank the reviewer for their time. The incentive was not used to bias or drive a particular response, nor was the incentive contingent on a positive endorsement. TR verified that a representative sample of customers was invited. More Info
Automating reporting has reduced manual data processing by 50-70%, freeing up analysts for higher-value tasks. A finance team that previously spent 20+ hours per week on Excel-based reports now does it in minutes with Microsoft Power BI's automated Real-time dashboards have shortened decision cycles by 30-40%, enabling leadership to react quickly to sales trends, operational bottlenecks, and customer behavior.
A de minimis incentive was given to thank the reviewer for their time. The incentive was not used to bias or drive a particular response, nor was the incentive contingent on a positive endorsement. More Info
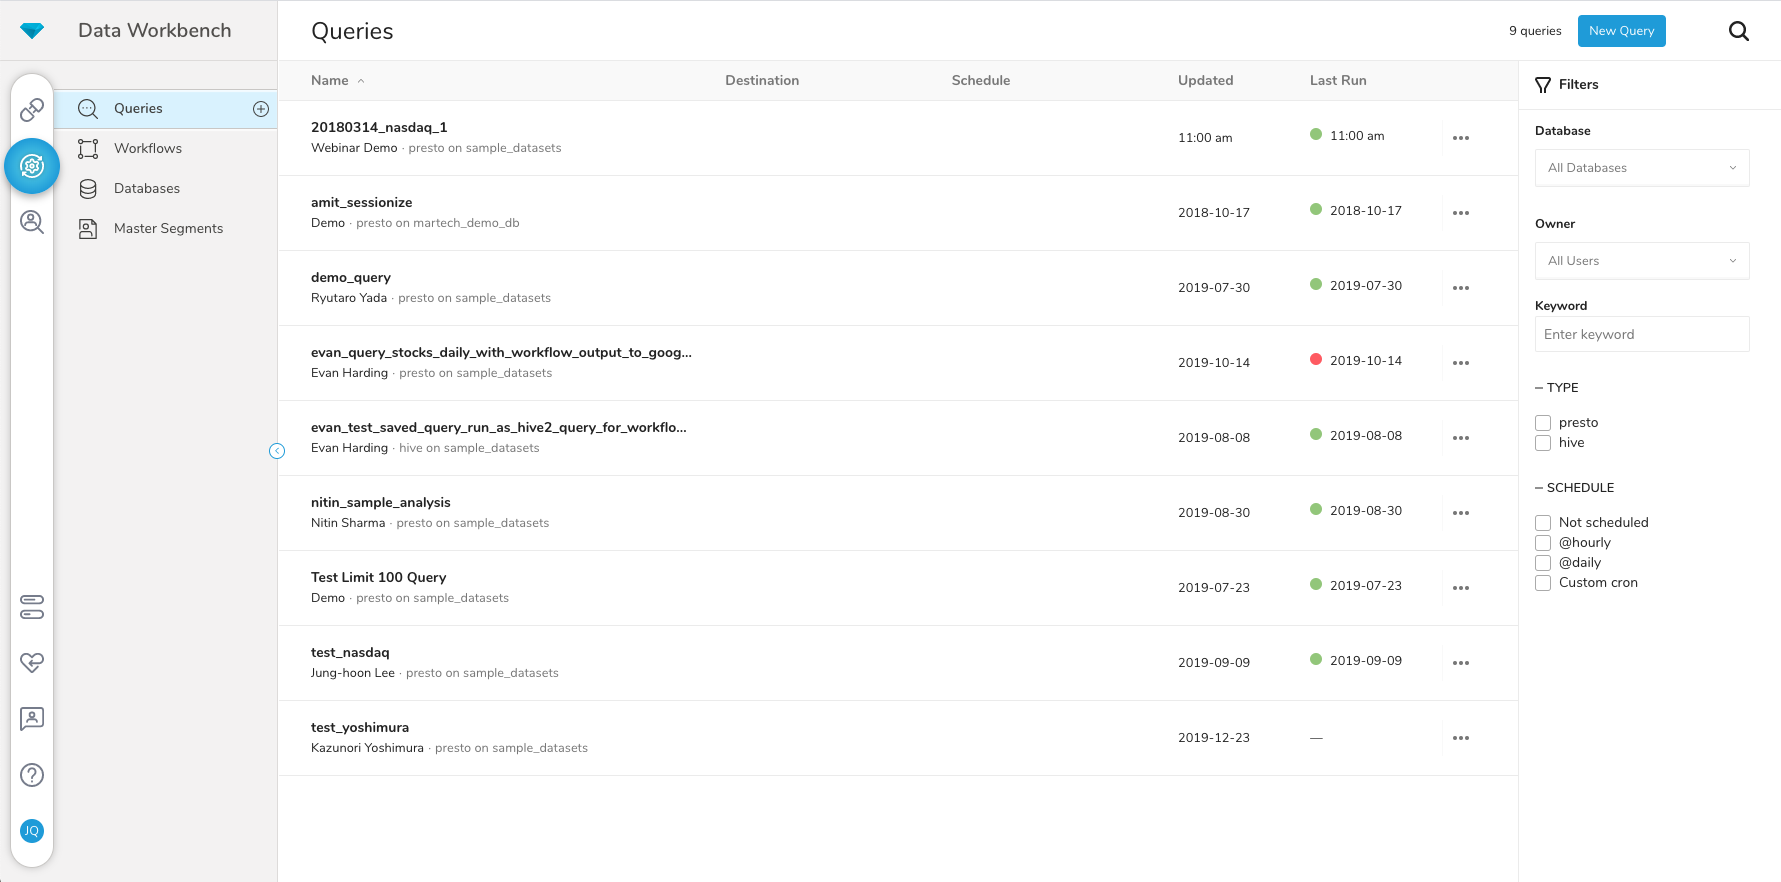
It's a easy platform to use and give the user detailed logs about what is going on in the workflows, so someone that do not have a lot of experience can start to work with it. And also the master segment usability is awesome, as we can filter a lot of data the way we want.
A de minimis incentive was given to thank the reviewer for their time. The incentive was not used to bias or drive a particular response, nor was the incentive contingent on a positive endorsement. More Info
As treasure data has a 24 hours support, every time we has big issues that impacts the zones, we do have immediatly support from the treasure data team, so I would say that we do not have any issues with availability
A de minimis incentive was given to thank the reviewer for their time. The incentive was not used to bias or drive a particular response, nor was the incentive contingent on a positive endorsement. More Info
Since treasure data has started having a huge amount of data, sometimes we do have problems with the workflows logs because we generate a lot of then. But with integrations I have not to complain, its really easy to integrate with other platforms.
A de minimis incentive was given to thank the reviewer for their time. The incentive was not used to bias or drive a particular response, nor was the incentive contingent on a positive endorsement. More Info
It is a fantastic tool, you can do almost everything related with data and reports, it is a perfect substitutive of Power Point and Excel with a high evolution and flexibility, and also it is very friendly and easy to share. I think all companies should have Power BI (or other BI tool) in their software package and if they are in the MS Suite, for sure Power BI should be the one due to all the benefits of the MS ecosystem.
A de minimis incentive was given to thank the reviewer for their time. The incentive was not used to bias or drive a particular response, nor was the incentive contingent on a positive endorsement. TR verified that a representative sample of customers was invited. More Info
The technical team has a good hold on the nuances of the data related to our organization. I have found the online technical support on their site quite responsive including the L1 support. In cases where the L1 team isn't able to resolve, I have found they are prompt in getting the product team's input to get a quick resolution.
A de minimis incentive was given to thank the reviewer for their time. The incentive was not used to bias or drive a particular response, nor was the incentive contingent on a positive endorsement. More Info
A de minimis incentive was given to thank the reviewer for their time. The incentive was not used to bias or drive a particular response, nor was the incentive contingent on a positive endorsement. More Info
I wasnt here at the training in the start, but I had a few training with treasure data for a few functionalities, and they provided me god explanations and great documentations, eve if the project were in beta.
A de minimis incentive was given to thank the reviewer for their time. The incentive was not used to bias or drive a particular response, nor was the incentive contingent on a positive endorsement. More Info
A de minimis incentive was given to thank the reviewer for their time. The incentive was not used to bias or drive a particular response, nor was the incentive contingent on a positive endorsement. More Info
A de minimis incentive was given to thank the reviewer for their time. The incentive was not used to bias or drive a particular response, nor was the incentive contingent on a positive endorsement. More Info
Microsoft Power BI is free. If I didn't want to create a custom platform (i.e. my organization insisted on an existing platform that I *had* to use), I'd use Microsoft Power BI. For any start-up or SMB, I'd just use Claude & Grok to build it quickly, also for free. Would not pay for Tableau or Sigma anymore. Not worth it at all.
A de minimis incentive was given to thank the reviewer for their time. The incentive was not used to bias or drive a particular response, nor was the incentive contingent on a positive endorsement. More Info
We chose Treasure Data for the supreme customer service and lack of hidden costs. We don't need to manage any infrastructure or scale anything to meet customer demand. Treasure Data handles everything and makes it easy for us to integrate and focus on the tasks at hand. There may be cheaper options but we do not regret our decision to go with Treasure Data one bit.
A de minimis incentive was given to thank the reviewer for their time. The incentive was not used to bias or drive a particular response, nor was the incentive contingent on a positive endorsement. More Info
A de minimis incentive was given to thank the reviewer for their time. The incentive was not used to bias or drive a particular response, nor was the incentive contingent on a positive endorsement. More Info
A de minimis incentive was given to thank the reviewer for their time. The incentive was not used to bias or drive a particular response, nor was the incentive contingent on a positive endorsement. More Info
We have built and supported our source of truth data tables using Treasure. This forms the foundation of our decision making.
Most of our Tableau data sources are created using a Treasure Data export which is executed by workflows on a daily basis which allows us to have visibility into day to day performance and communicate them to a wide variety of roles.
We load custom data into our Salesforce instance which allows us to trigger certain workflows and build accountability - i.e. a "Sale" will only count once a certain product driven event occurs which comes from data we pipe into Treasure and then into Salesforce.
A de minimis incentive was given to thank the reviewer for their time. The incentive was not used to bias or drive a particular response, nor was the incentive contingent on a positive endorsement. TR verified that a representative sample of customers was invited. More Info