
ManageEngine OpManager vs. Netmon 1U Server Appliance
| Product | Rating | Most Used By | Product Summary | Starting Price |
|---|---|---|---|---|
 ManageEngine OpManager | Score6.6 out of 10 | N/A | ManageEngine's OpManager is network performance monitoring software. | $95 per year |
 Netmon 1U Server Appliance | N/A | Mid-Size Companies (51-1,000 employees) | Netmon is an all-in-one network monitoring appliance solution featuring real-time packet sniffing technology, device performance monitoring, syslog & event log monitoring and custom alerting in a centralized platform. With this solution, users can monitor their entire network with no device limits or per device license fees. | $5,995 Installation |
| ManageEngine OpManager | Netmon 1U Server Appliance | |||||||||||||||
|---|---|---|---|---|---|---|---|---|---|---|---|---|---|---|---|---|
| Editions & Modules |
|
| ||||||||||||||
| Offerings |
| |||||||||||||||
| Entry-level Setup Fee | $245 per installation | Required | ||||||||||||||
| Additional Details | — | Netmon Maintenance Package - Appliance Edition - $1,595 /USD - Annual Subscription: Toll Free Technical Support, Software Upgrades, Software Updates and Patches, Limited Hardware Warranty Netmon Maintenance Package - Appliance Edition - $1,095 /USD - Annual Subscription: Toll Free Technical Support, Software Upgrades, Software Updates and Patches | ||||||||||||||
| More Pricing Information | ||||||||||||||||
| ManageEngine OpManager | Netmon 1U Server Appliance | |
|---|---|---|
| Considered Both Products | No answer on this topic | No answer on this topic |
| Key User Insights | ||
| Would buy again | ||
98% Would buy again 41 Answers | No answers on this topic | |
| Delivers good value for the price | ||
100% Delivers good value for the price 41 Answers | No answers on this topic | |
| Happy with the feature set | ||
100% Happy with the feature set 42 Answers | No answers on this topic | |
| Lived up to sales and marketing promises | ||
97% Lived up to sales and marketing promises 35 Answers | No answers on this topic | |
| Implementation went as expected | ||
98% Implementation went as expected 41 Answers | No answers on this topic | |
| ManageEngine OpManager | Netmon 1U Server Appliance | ||||||||||||||||||||||||||||||||||
|---|---|---|---|---|---|---|---|---|---|---|---|---|---|---|---|---|---|---|---|---|---|---|---|---|---|---|---|---|---|---|---|---|---|---|---|
| Network Performance Monitoring |
| ||||||||||||||||||||||||||||||||||
| ManageEngine OpManager | Netmon 1U Server Appliance | |
|---|---|---|
| Small Businesses |  Auvik Score9.9 out of 10 |  Pulseway Score9.9 out of 10 |
| Medium-sized Companies |  PingPlotter Score9.3 out of 10 |  Cisco Meraki Dashboard Score9.3 out of 10 |
| Enterprises |  Nmap Score10 out of 10 |  Cisco Prime LAN Management (discontinued) Score8.5 out of 10 |
| All Alternatives | View all alternatives | View all alternatives |
| ManageEngine OpManager | Netmon 1U Server Appliance | |
|---|---|---|
| Likelihood to Recommend | 7.3 | - |
| Likelihood to Renew | 8.0 | - |
| Usability | 8.0 | - |
| Support Rating | 8.1 | - |
| Implementation Rating | 9.0 | - |
| ManageEngine OpManager | Netmon 1U Server Appliance | |
|---|---|---|
| Likelihood to Recommend |
| No answers on this topic |
| Pros |
| No answers on this topic |
| Cons |
| No answers on this topic |
| Likelihood to Renew |
| No answers on this topic |
| Usability |
| No answers on this topic |
| Support Rating |
| No answers on this topic |
| Alternatives Considered |
| No answers on this topic |
| Return on Investment |
| No answers on this topic |
| ScreenShots | ManageEngine OpManager Screenshots    | Netmon 1U Server Appliance Screenshots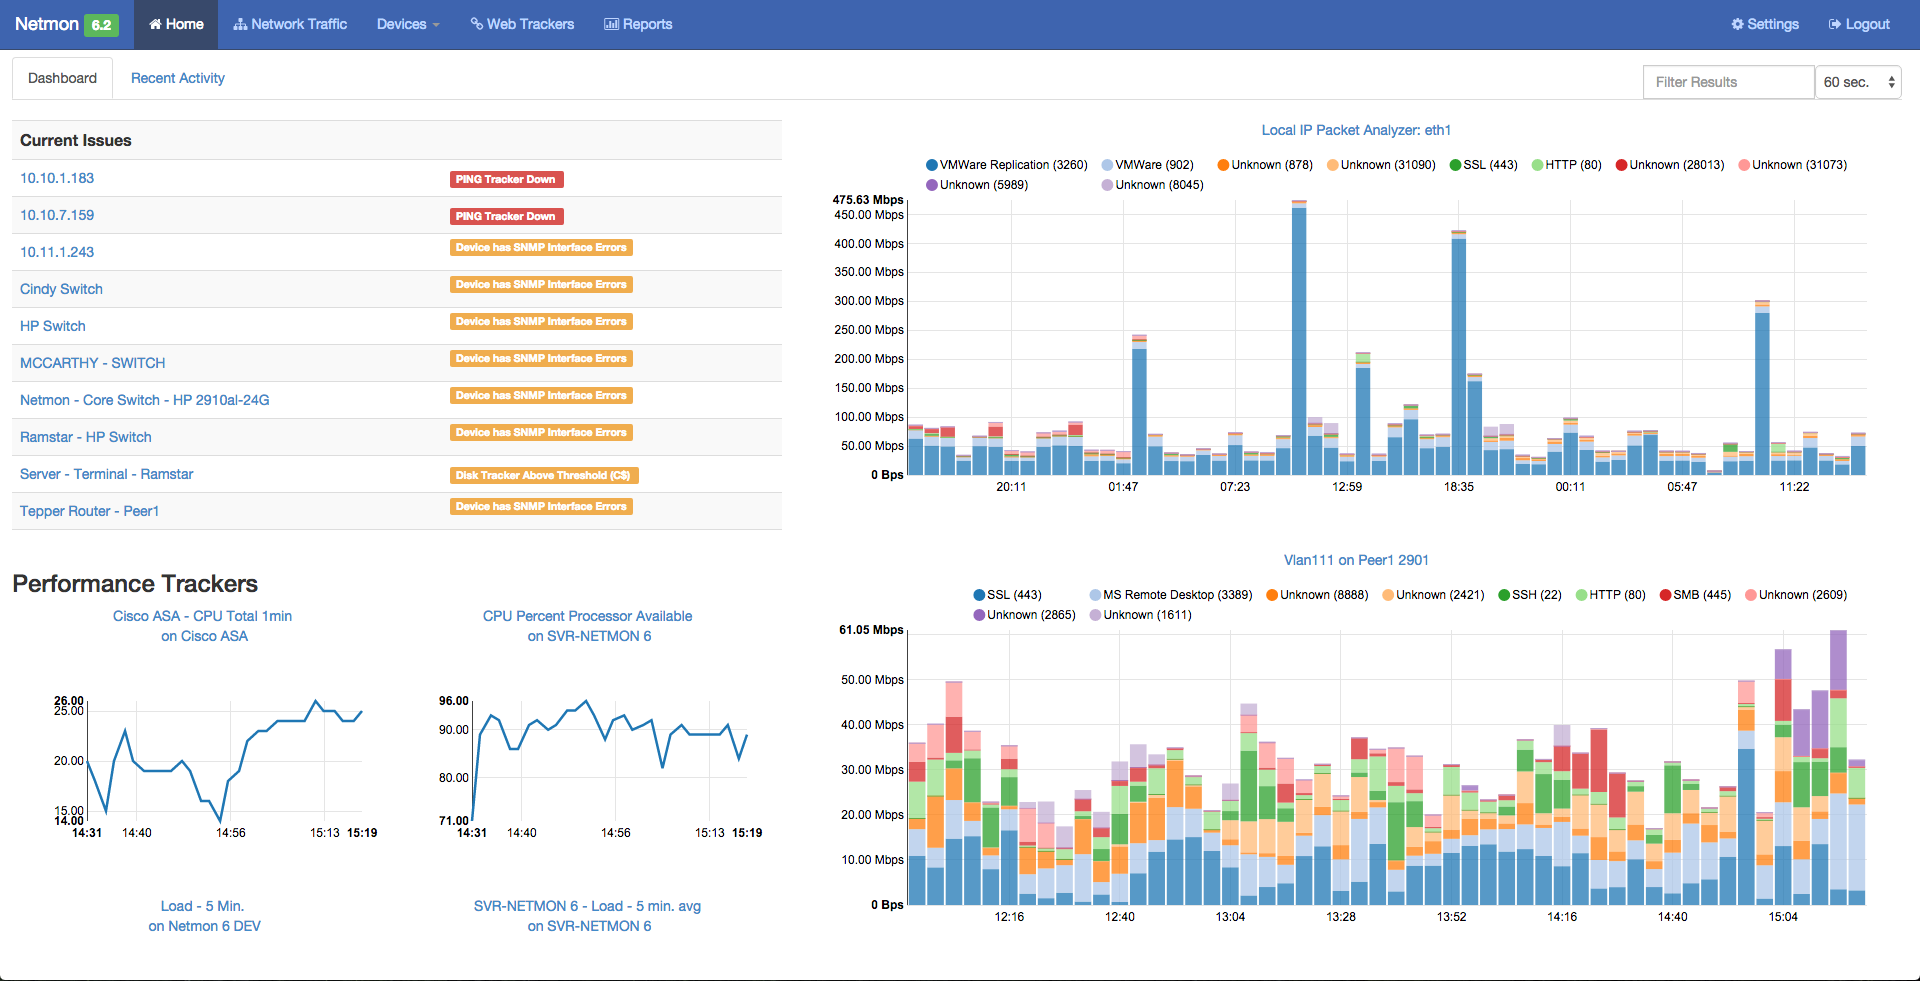 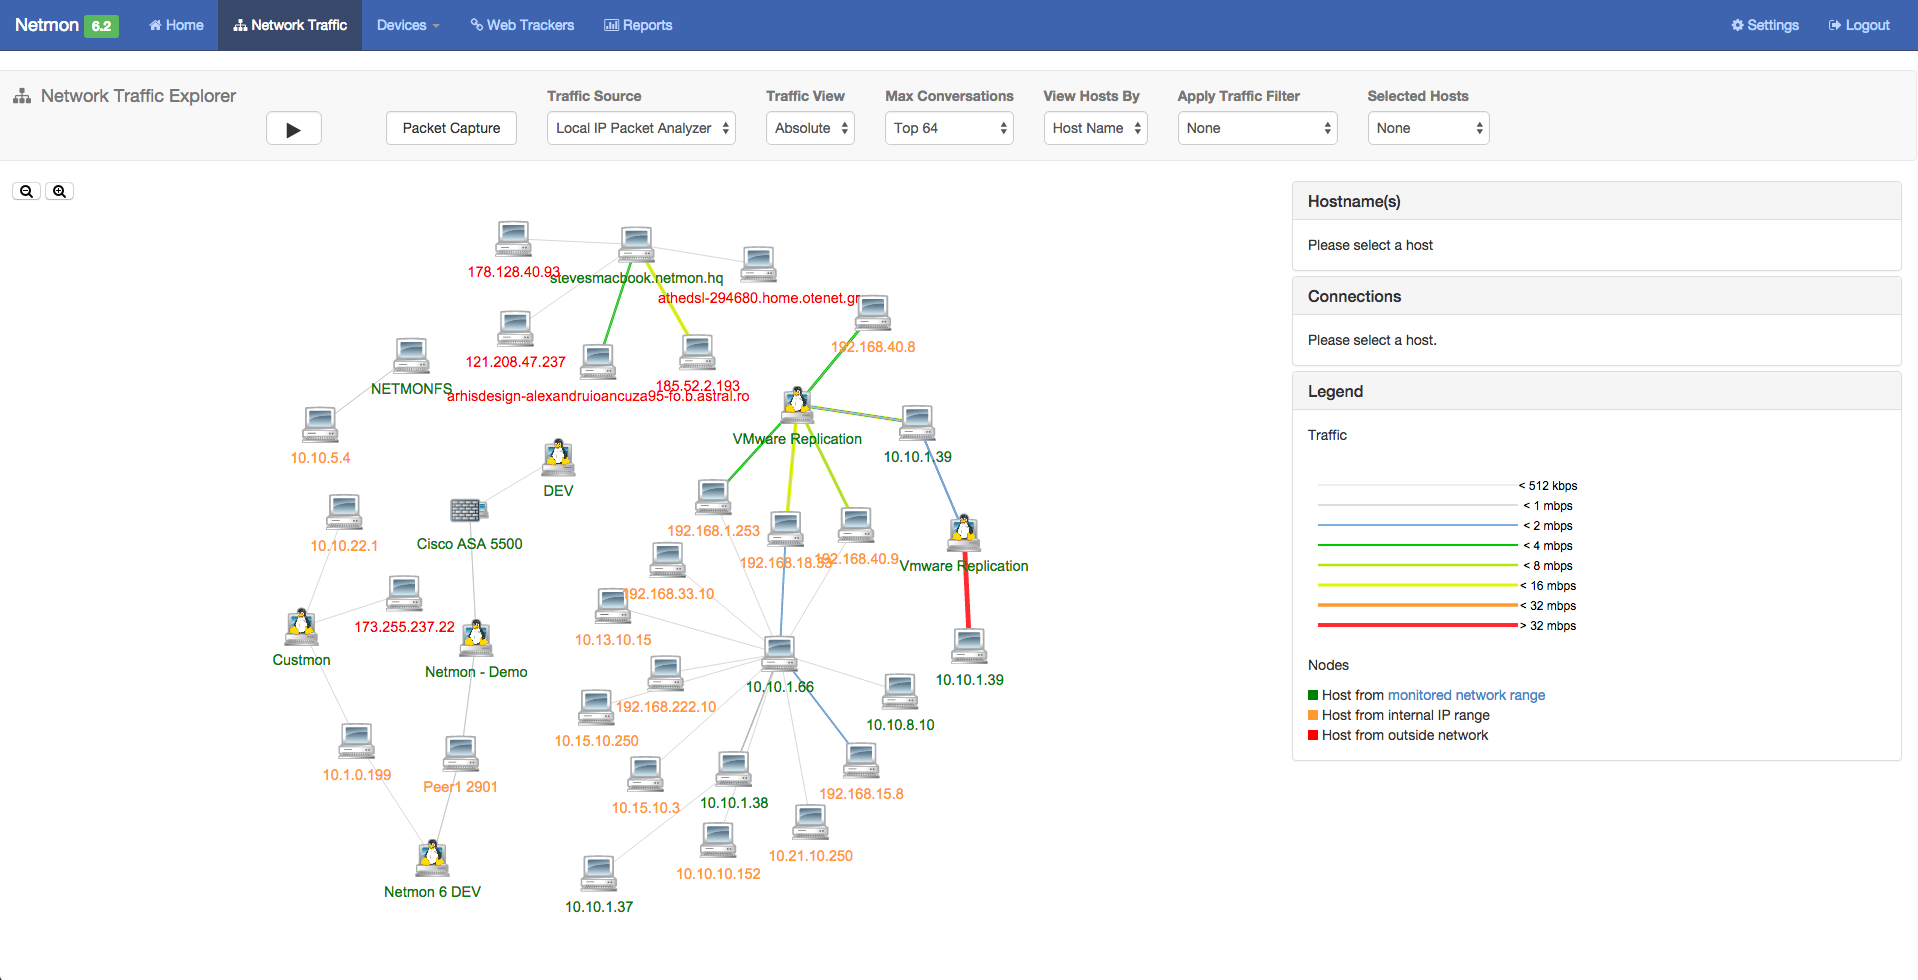  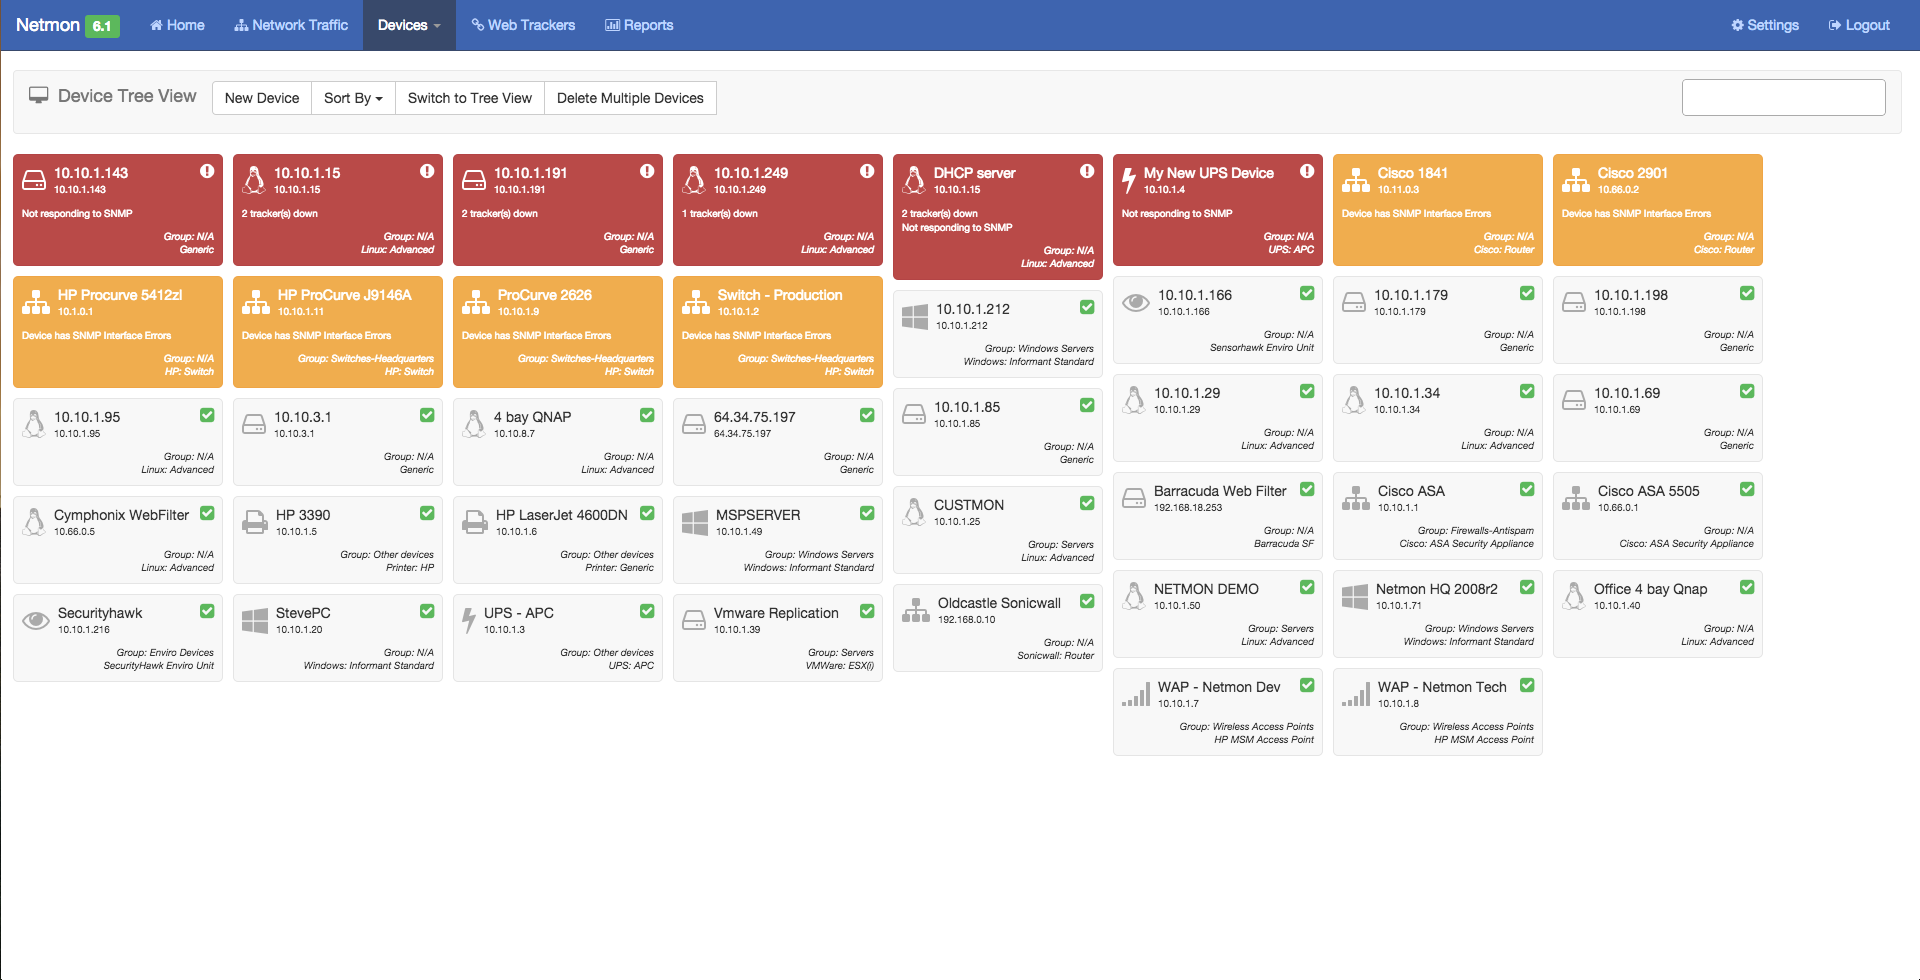 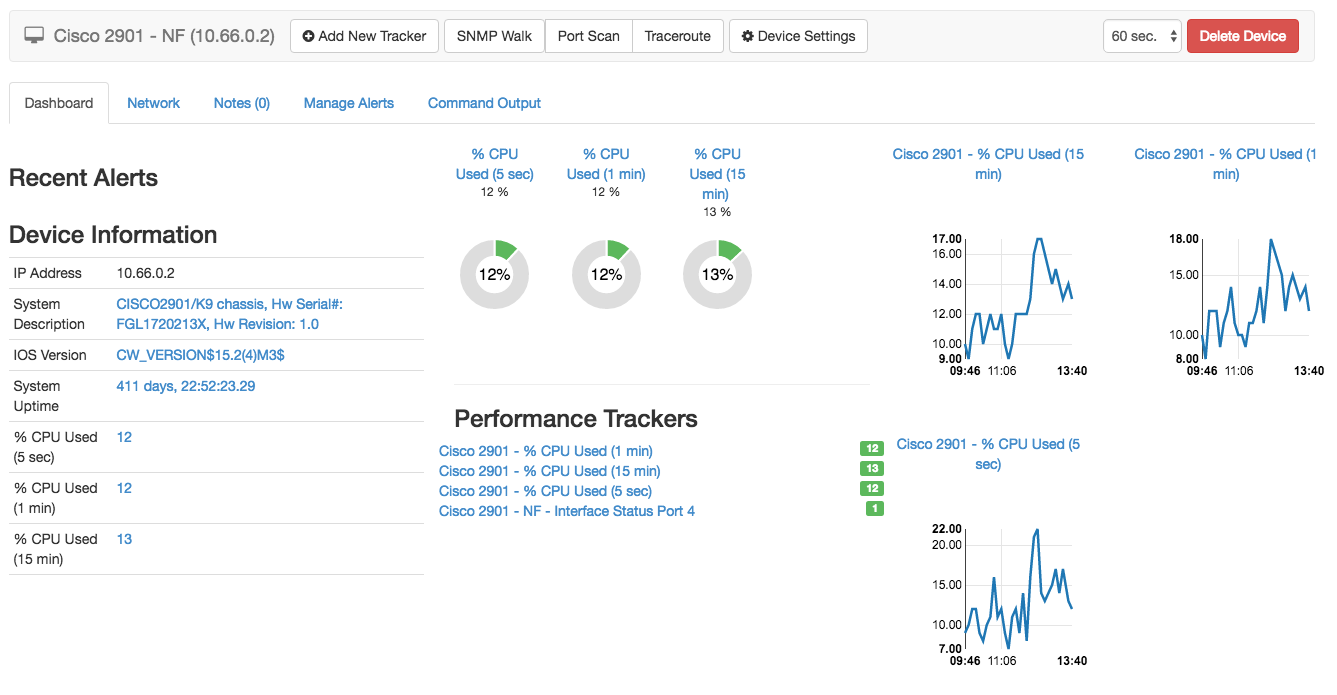 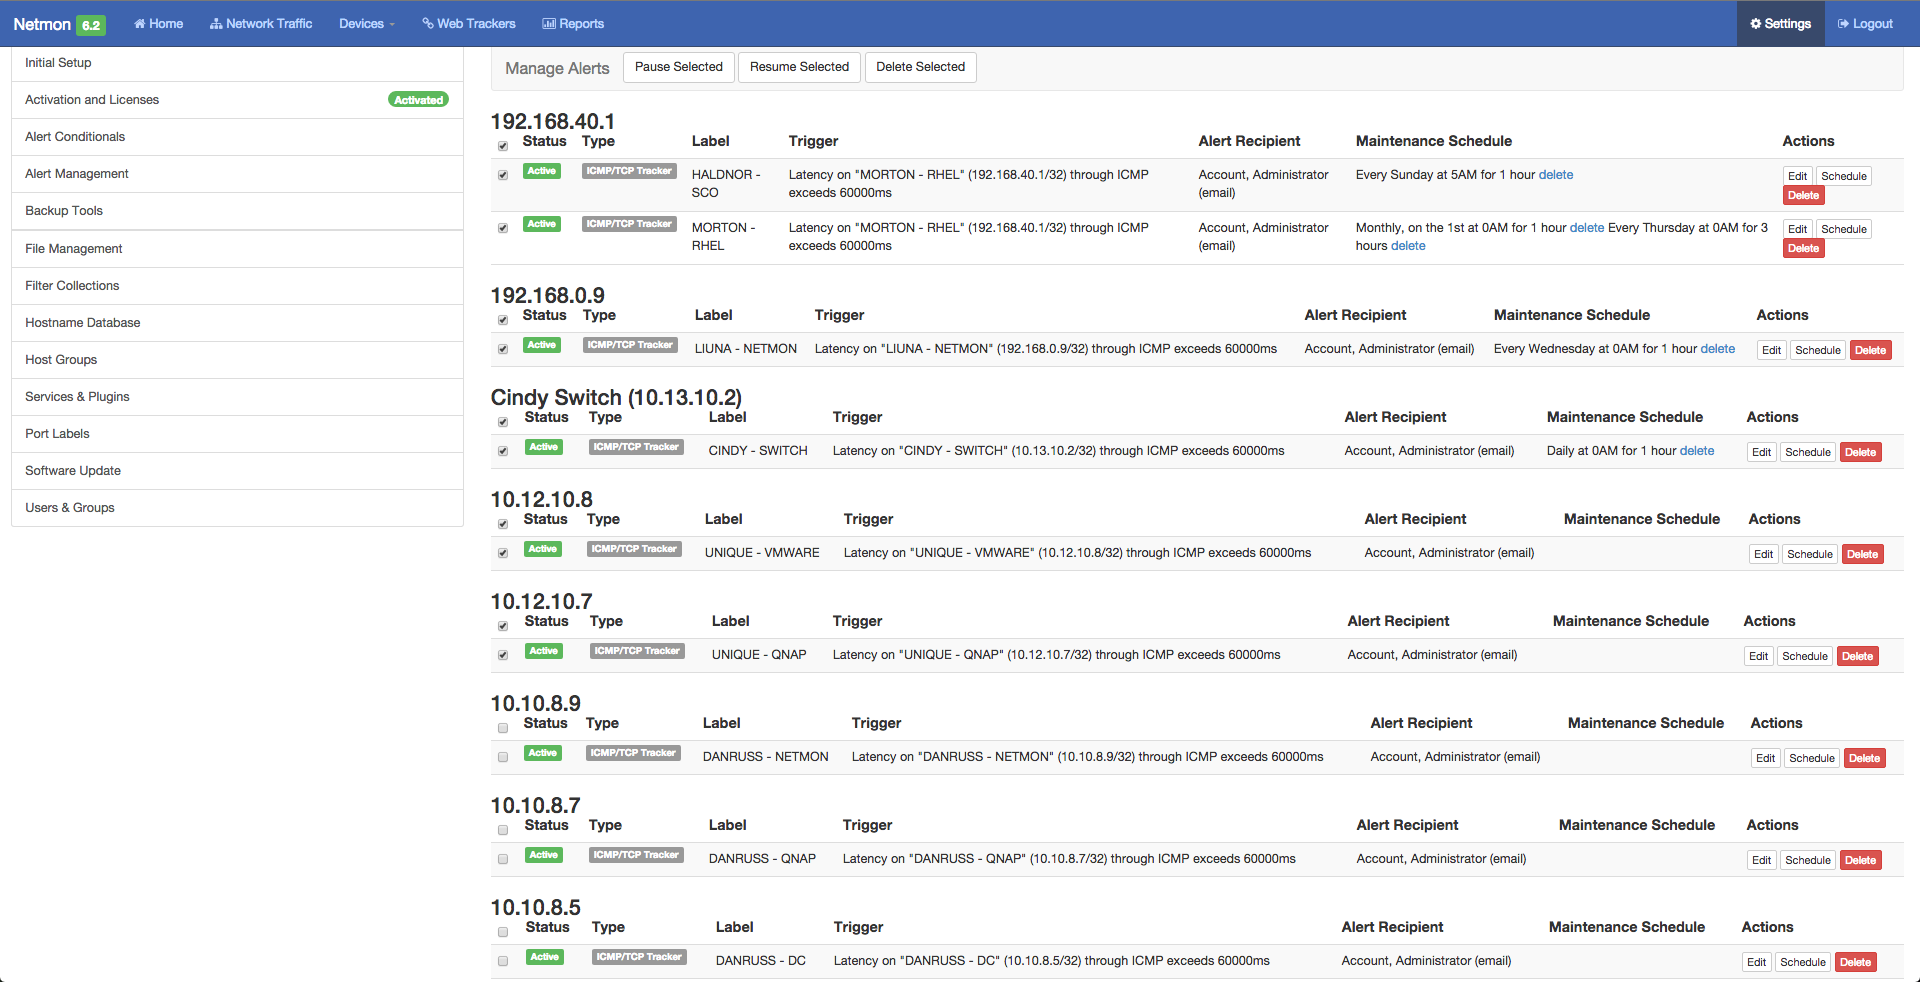 |

