Looker is a BI application with an analytics-oriented application server that sits on top of relational data stores. It includes an end-user interface for exploring data, a reusable development paradigm for data discovery, and an API for supporting data in other systems.
N/A
OpenText Magellan
Score 9.0 out of 10
N/A
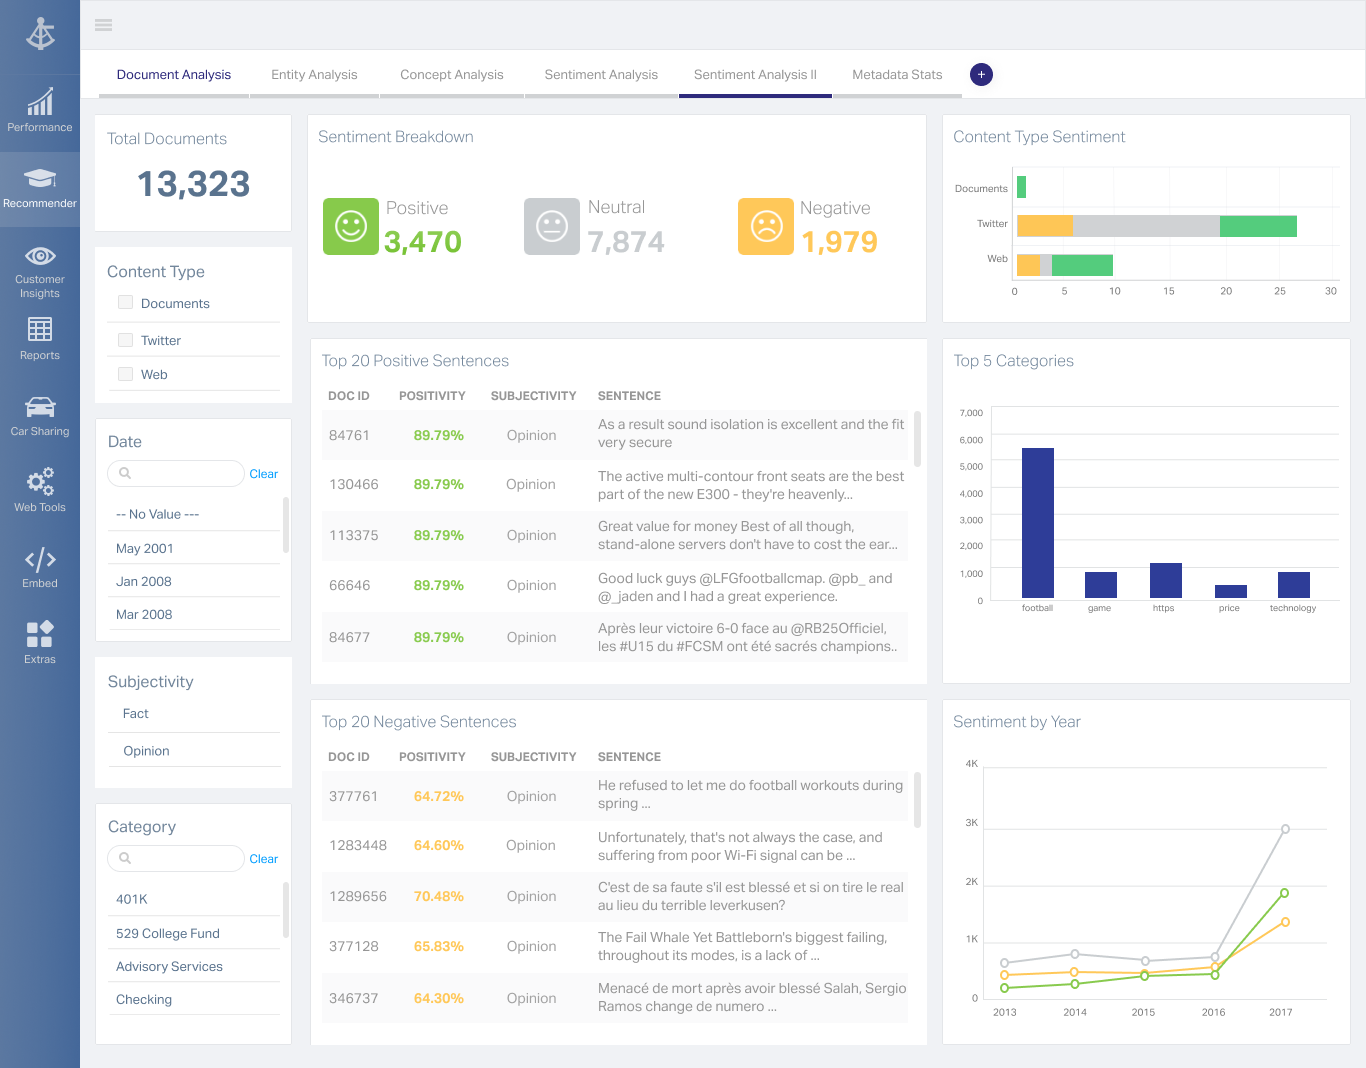
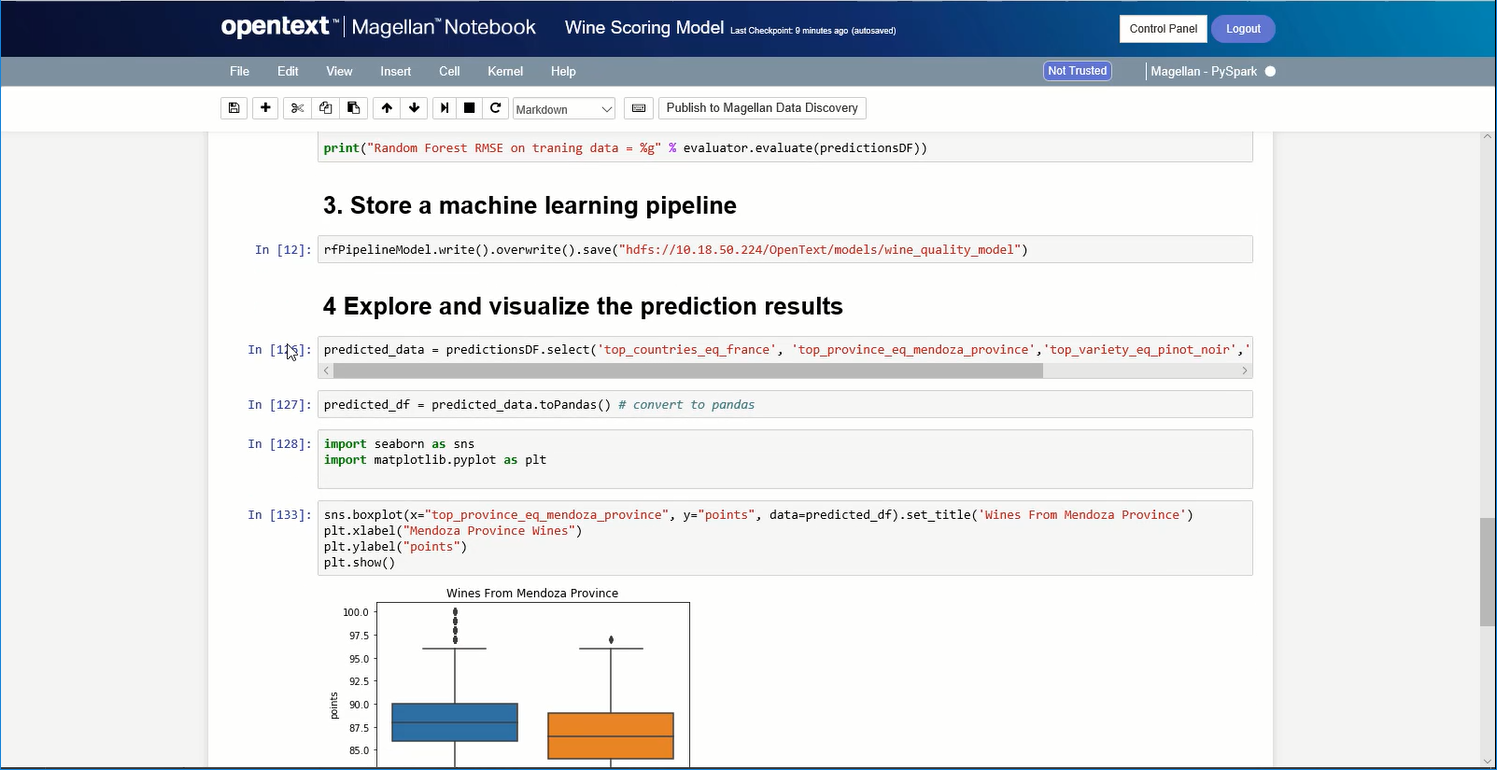
OpenText Magellan Analytics Suite leverages a comprehensive set of data analytics software to identify patterns, relationships and trends through data visualizations and interactive dashboards.
N/A
Pricing
Looker
OpenText Magellan
Editions & Modules
No answers on this topic
No answers on this topic
Offerings
Pricing Offerings
Looker
OpenText Magellan
Free Trial
Yes
No
Free/Freemium Version
No
No
Premium Consulting/Integration Services
No
No
Entry-level Setup Fee
Required
No setup fee
Additional Details
Must contact sales team for pricing.
—
More Pricing Information
Community Pulse
Looker
OpenText Magellan
Features
Looker
OpenText Magellan
BI Standard Reporting
Comparison of BI Standard Reporting features of Product A and Product B
Looker
8.4
Ratings
3% above category average
OpenText Magellan
7.0
Ratings
15% below category average
Pixel Perfect reports
8.00 Ratings
00 Ratings
Customizable dashboards
9.00 Ratings
7.00 Ratings
Report Formatting Templates
8.30 Ratings
7.00 Ratings
Ad-hoc Reporting
Comparison of Ad-hoc Reporting features of Product A and Product B
Looker
8.5
Ratings
5% above category average
OpenText Magellan
8.3
Ratings
3% above category average
Drill-down analysis
8.20 Ratings
8.00 Ratings
Formatting capabilities
7.80 Ratings
8.00 Ratings
Integration with R or other statistical packages
8.80 Ratings
9.00 Ratings
Report sharing and collaboration
9.20 Ratings
8.00 Ratings
Report Output and Scheduling
Comparison of Report Output and Scheduling features of Product A and Product B
Looker
8.8
Ratings
6% above category average
OpenText Magellan
8.3
Ratings
0% below category average
Publish to Web
8.40 Ratings
8.00 Ratings
Publish to PDF
9.10 Ratings
8.00 Ratings
Report Versioning
8.60 Ratings
9.00 Ratings
Report Delivery Scheduling
9.20 Ratings
8.00 Ratings
Data Discovery and Visualization
Comparison of Data Discovery and Visualization features of Product A and Product B
When you need to create a centralised dashboard for multiple stakeholders that blends cross-channel reporting. As an SEO agency reporting for clients - Looker is a great solution. It's less appropriate depending on the intended users. For instance, in my experience Looker reports have been under-utilised because they're not accessed regularly, provide too much noise or often simple PDF reports are preferred
It depends on extensibility, set-up, access & style. Actuate performs fairly well, but has performance issues because it sits on top of eclipse, which sits on top of Java. Extensibility usually comes at that price. Set-up is fairly straightforward and it can be secured.
We are very haooy with Looker, it provides us with all the funciomalities we need for both the day to day oerformance tracking and longer periods reporting. It is easy to use for account managers, configurable and customizable for soecialists and what is most imoortant, our clinets generally really love it
I am no longer working for the company that was using Actuate but I believe they would continue to use it because the stitching costs would be to high. It would require a complete rewrite of the reports and the never version of Actuate (BIRT) even required an almost complete report rewrite
Looker is relatively easy to use, even as it is set up. The customers for the front-end only have issues with the initial setup for looker ml creations. Other "looks" are relatively easy to set up, depending on the ETL and the data which is coming into Looker on a regular basis.
It is quite intuitive to use. It is fit specifically for doing sentiment, emotion, and intention analysis as well as text classification and text summarization. I would have given 10 if it is fit for the purpose of doing image processing and analysis as well. There is a huge market to analyze video and image data.
Somehow resources heavy, both on server and client. I recommned at least 50Mbs data rate and high performance desktop comouter to be abke to run comolex tasks and configure larger amount of data. On the other hand, the client does not need to worry when viewing, the performance is usually ok
Never had to work with support for issues. Any questions we had, they would respond promptly and clearly. The one-time setup was easy, by reading documentation. If the feature is not supported, they will add a feature request. In this case, LDAP support was requested over OKTA. They are looking into it.
In my opinion, Looker is no Power BI. It is good, but I think Power BI is amazing. That said, in my experience, Power BI is nowhere near as easy to setup and report on Google services as Looker is. We plan to continue using Power BI for c-suite and corporate reporting, especially for internal databases, but will gladly use Looker for our marketing information for AdWords, Analytics, Search Console, and YouTube.
It is vastly superior to these in many ways, for complex reporting it is a much more sophisticated solution. Visualizations are very good. Javascript extensibility is very powerful, others don't support this or as well. Pentaho and MS are both OLAP oriented. Pentaho is moving more toward big data, which was not our primary focus. Others are stuck in the Crystal Reports Band metaphor.
Other than some people not liking the numbers, I don't see any negative impacts; we haven't experienced that.
The reports help us unravel the story of our users and how they are sifting through our pages.
Our clients enjoy seeing the numbers to understand better what stands out on their sites.
The reports have helped us see what campaigns are working and where we need to tweak things.
The reports have enabled us to have better conversations with stakeholders about how their web pages should be modified, edited, etc., to reflect the data.
Actuate can handle 50 to 60 sub reports inside a report very well.
Dynamically creating the datasource, chart, graph, reports are the main advantages. We can do any level of drilling, and can create a performance matrix dashboard efficiently.