Looker Studio is a data visualization platform that transforms data into meaningful presentations and dashboards with customized reporting tools.
$9
per month per user per project
Rational BI
Score7.7 out of 10
Enterprise companies (1,001+ employees)
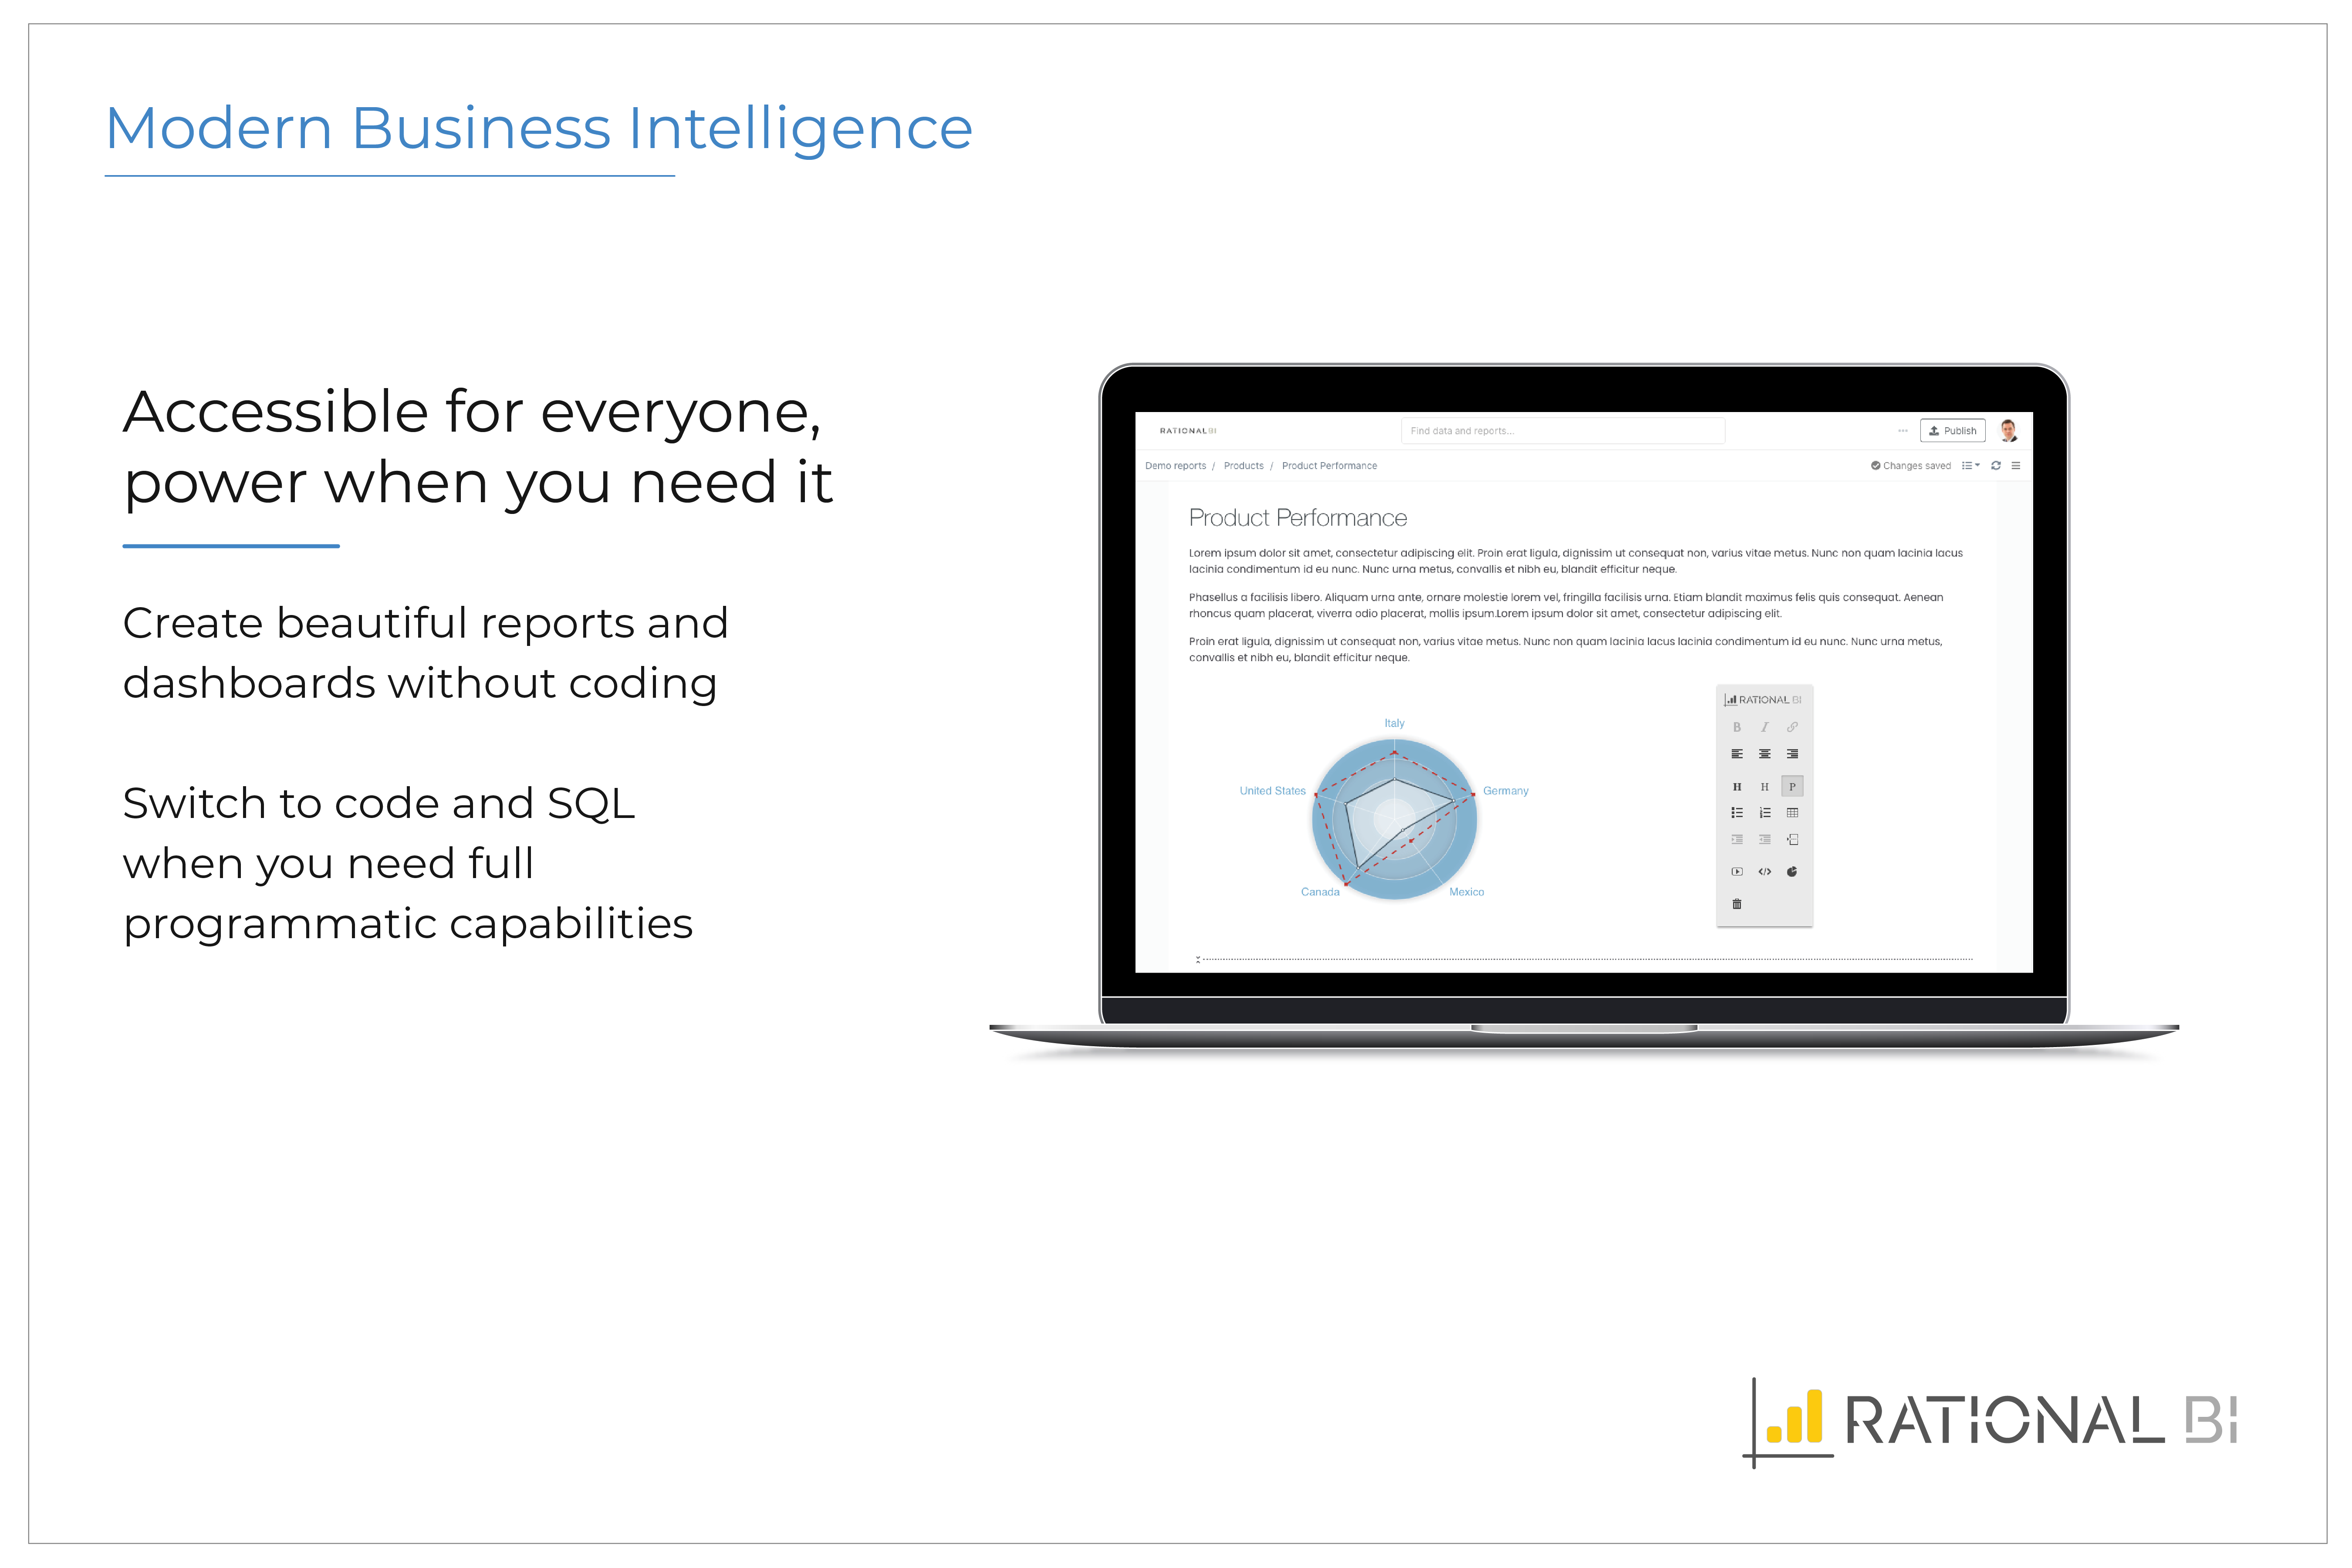
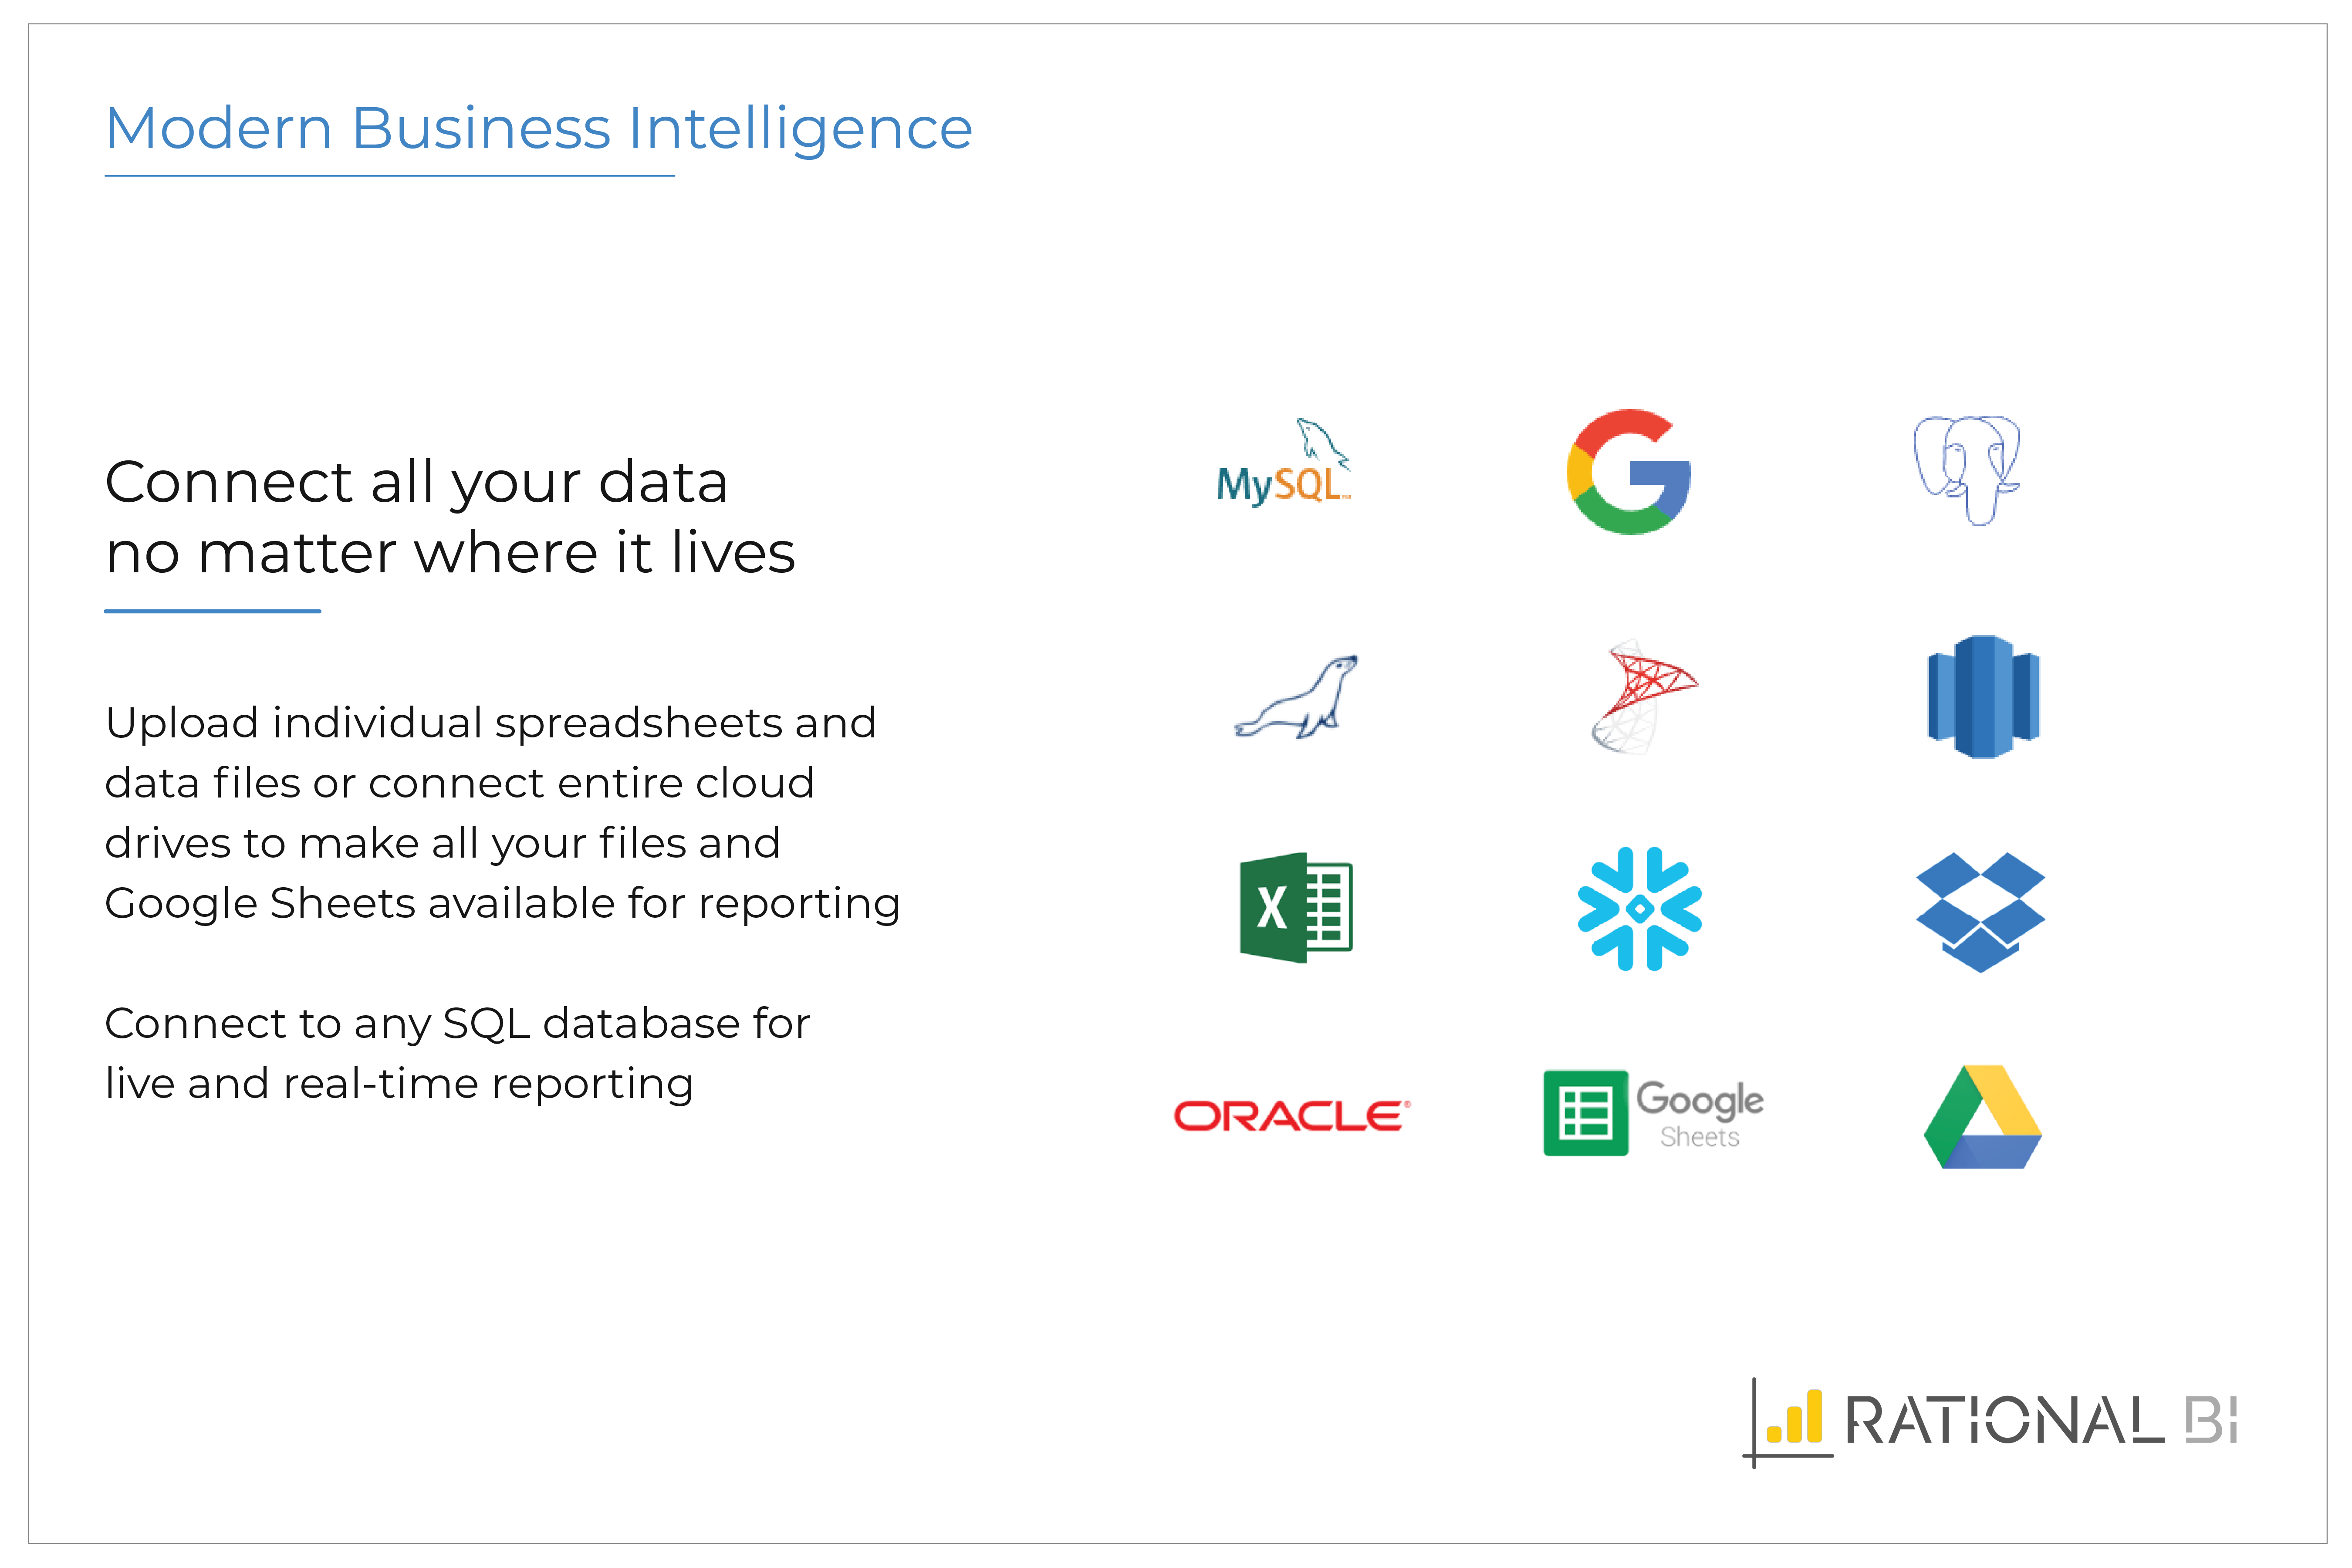
Rational BI provides analytics, data science and business intelligence in an analytical platform that connects to databases, data files and cloud drives including AWS and Azure data sources, enabling users to explore and visualize data. Users can build real-time notebook-style reports directly in a web browser with JavaScript and SQL with direct and live connections to data. Filter and query data with an SQL database embedded in the client, without network…
$0
single user
Pricing
Looker Studio
Rational BI
Editions & Modules
Looker Studio Pro
$9
per month per user per project
Looker Studio
No charge
Free
$0
single user
Professional
$129
single user
Enterprise
Varies
single user
Offerings
Pricing Offerings
Looker Studio
Rational BI
Free Trial
No
Yes
Free/Freemium Version
Yes
Yes
Premium Consulting/Integration Services
No
Yes
Entry-level Setup Fee
No setup fee
Optional
Additional Details
—
Additional cost per extra user (varies by edition)
Looker Studio is well-suited for those wanting to analyze web/site data and performance quickly. It is simple enough to learn/use for quick report-building or drilling into data. Looker Studio is easier to use/understand than the GA4 console and thus has a better UI/UX. It is an efficient tool for fast, simple data needs—especially for team members with limited analytical capabilities and knowledge.
A de minimis incentive was given to thank the reviewer for their time. The incentive was not used to bias or drive a particular response, nor was the incentive contingent on a positive endorsement. More Info
Definitely well suited for small companies, but again many of their competitors are also well suited in this segment. We were in general happy with the solution provided, but I'm not blown away by their solution or support. If you want to get more data-driven visual boards with data displayed in nice graphics is in my opinion a good start, and here Rational BI delivers what it should.
A de minimis incentive was given to thank the reviewer for their time. The incentive was not used to bias or drive a particular response, nor was the incentive contingent on a positive endorsement. More Info
A de minimis incentive was given to thank the reviewer for their time. The incentive was not used to bias or drive a particular response, nor was the incentive contingent on a positive endorsement. More Info
A de minimis incentive was given to thank the reviewer for their time. The incentive was not used to bias or drive a particular response, nor was the incentive contingent on a positive endorsement. More Info
A de minimis incentive was given to thank the reviewer for their time. The incentive was not used to bias or drive a particular response, nor was the incentive contingent on a positive endorsement. More Info
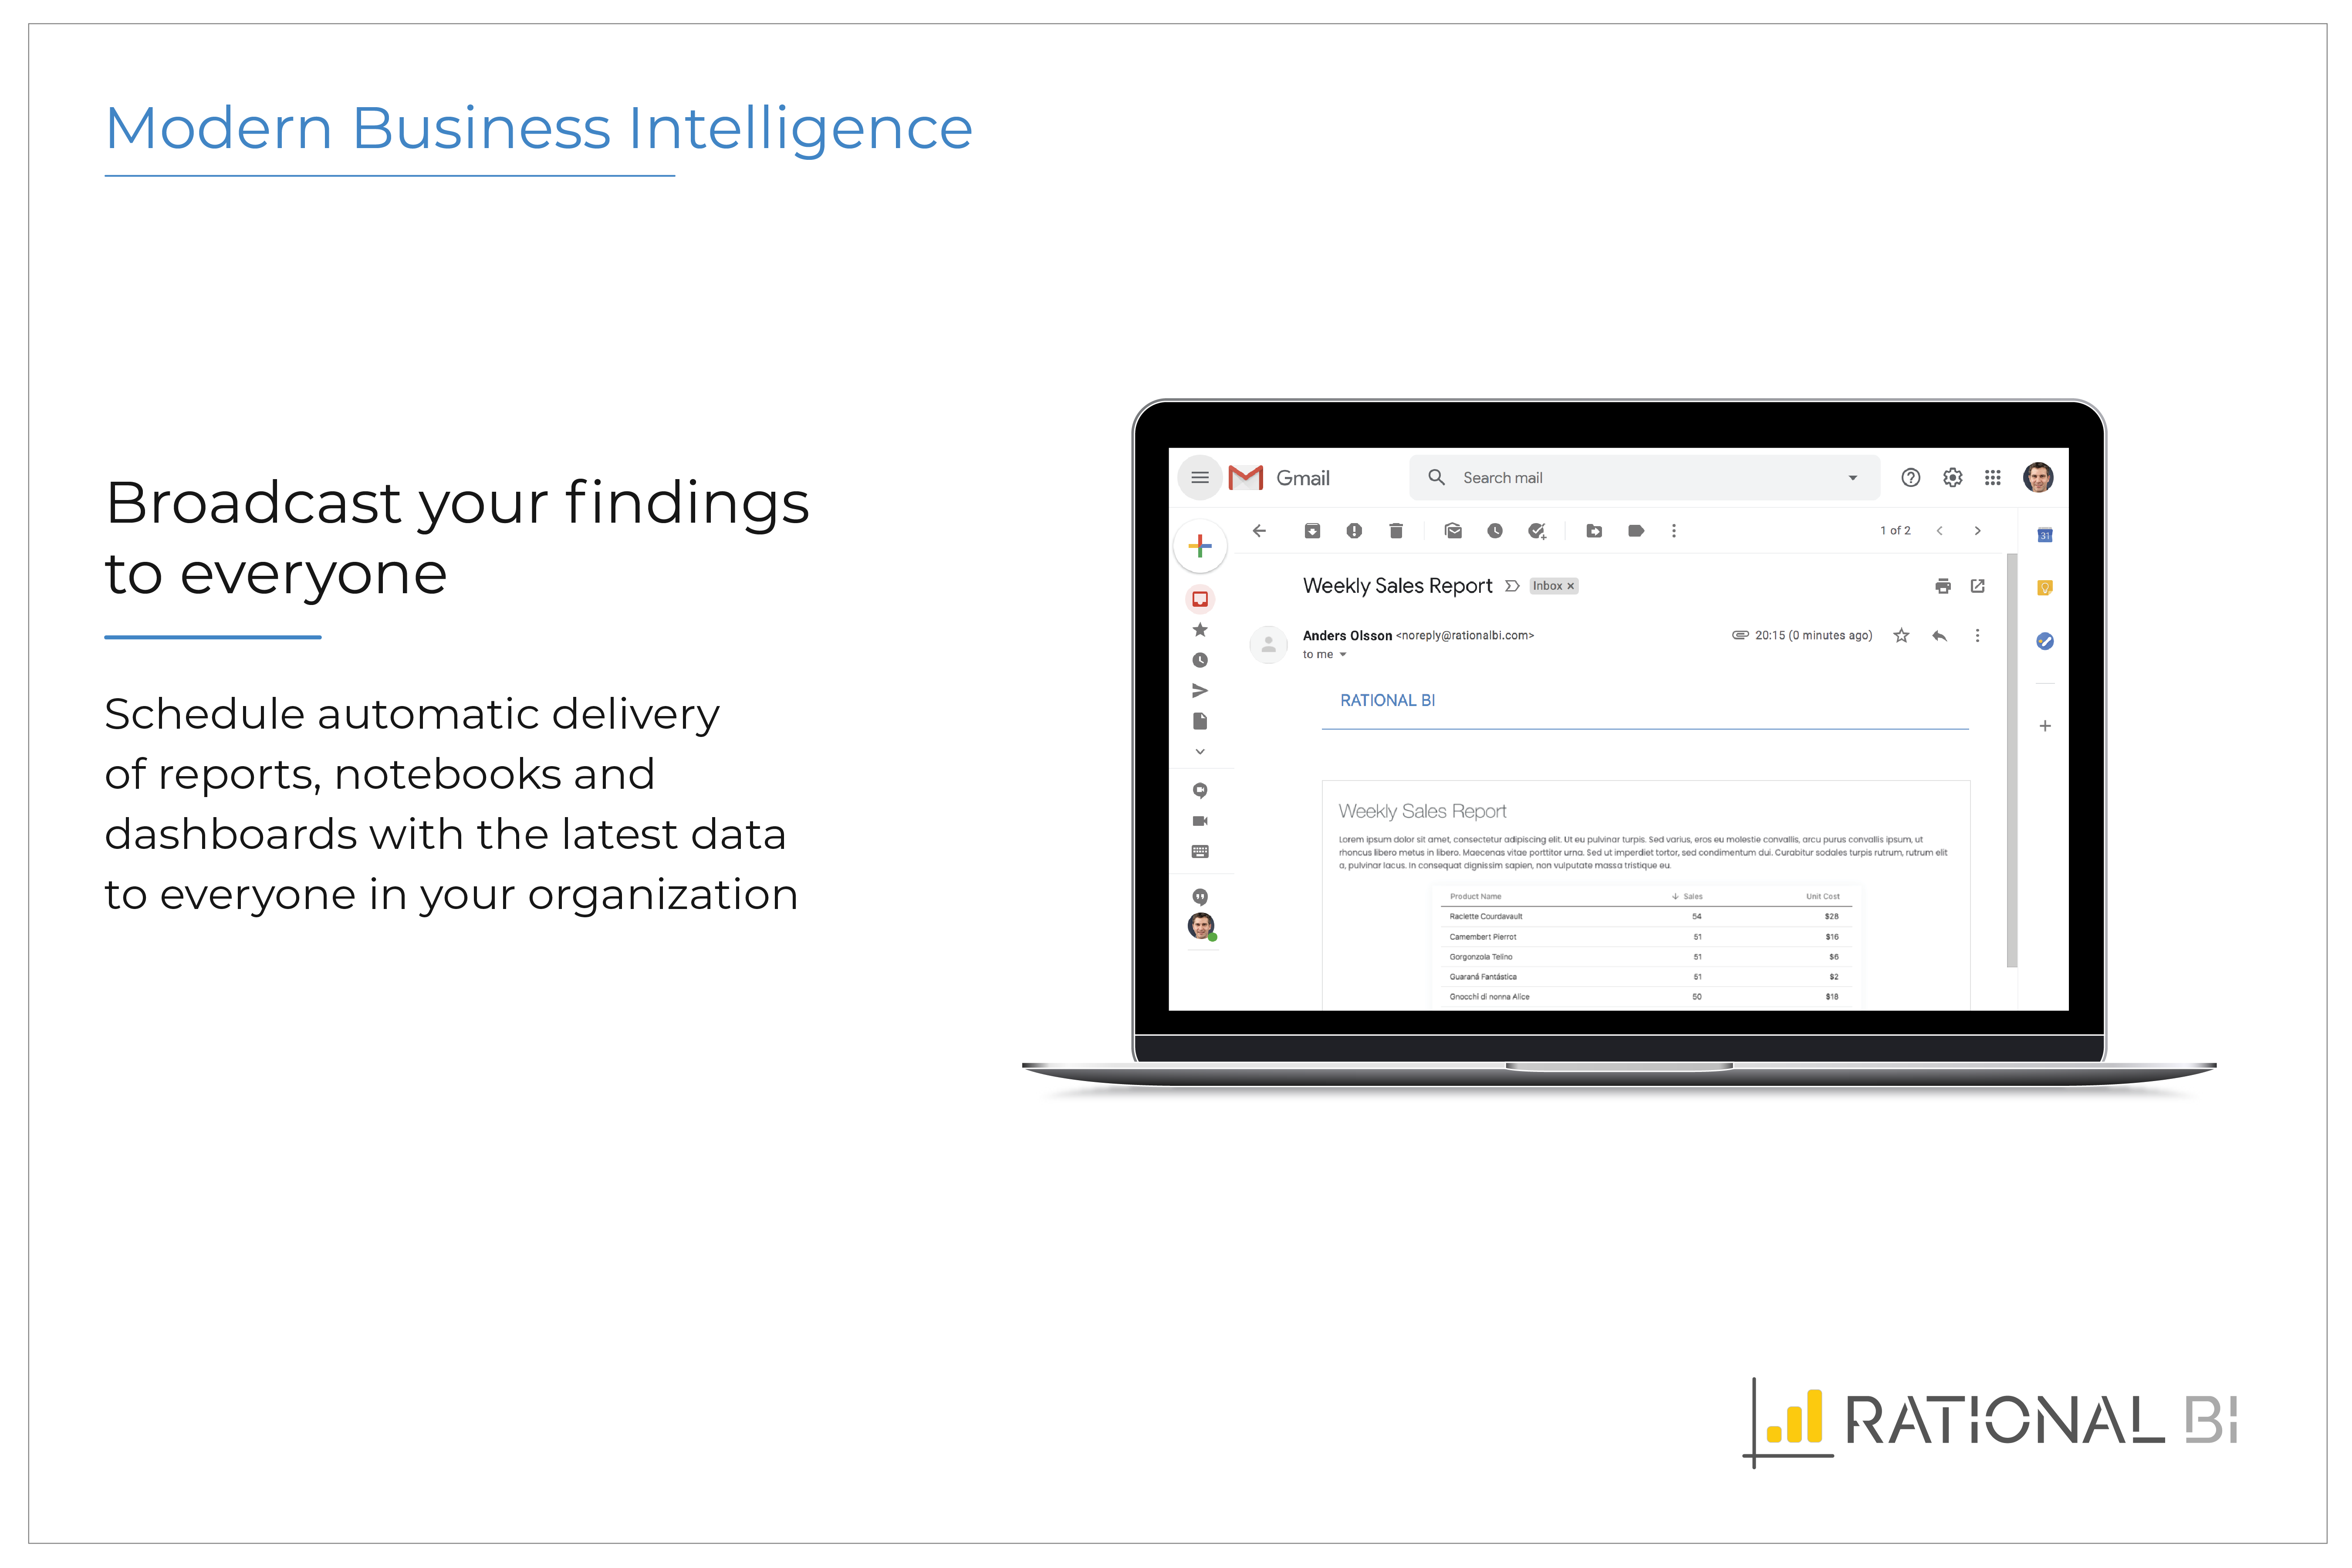
It is the simplest and least expensive way for us to automate our reporting at this time. I like the ability to customize literally everything about each report, and the ability to send out reports automatically in emails. The only issue we have been having recently is a technical glitch in the automatic email report. Sadly, there is almost no support for this tool from Google, but is also free, so that is important to take into consideration
A de minimis incentive was given to thank the reviewer for their time. The incentive was not used to bias or drive a particular response, nor was the incentive contingent on a positive endorsement. More Info
It is not ideal and requires time and dedication to understand how to work with it. Also, it has a lot of limitations around data it can accept. But in most cases, this tool is sufficient for everyday tasks of product and marketing departments. I wouldn't say that the interface is very user-friendly, but for people who regularly work with analytical tools, it must be ok.
A de minimis incentive was given to thank the reviewer for their time. The incentive was not used to bias or drive a particular response, nor was the incentive contingent on a positive endorsement. More Info
Overall Rational BI is a valuable enterprise reporting tool for any data driven organization. It offers great depth and breadth of features for reporting and analytics that can lead to better business outcomes. Its easy to use and highly configurable to evolve to changing reporting needs of organizations of any scale.
A de minimis incentive was given to thank the reviewer for their time. The incentive was not used to bias or drive a particular response, nor was the incentive contingent on a positive endorsement. More Info
I give it a lower support rating because it seems like our Dev team hasn't gotten the support they need to set up our database to connect. Seems like we hit a roadblock and the project got put on pause for dev. That sucks for me because it is harder to get the dev team to focus on it if they don't get the help they need to set it up.
A de minimis incentive was given to thank the reviewer for their time. The incentive was not used to bias or drive a particular response, nor was the incentive contingent on a positive endorsement. More Info
I haven't used the support myself, but my colleagues have been satisfied with the support. As I have understood from my colleagues the support is as you could expect. Still, the documentation could be better and that could avoid the need to contact their support, but overall we're still happy with the support as well.
A de minimis incentive was given to thank the reviewer for their time. The incentive was not used to bias or drive a particular response, nor was the incentive contingent on a positive endorsement. More Info
The free version of Looker Studio is still better than the leading enterprise-embedded BI tools, despite its weaknesses. The leading embedded BI platforms have terrible visualizations that can be spotted a mile away. They are also primarily locked to a grid, making it very hard to fully customize. The price point is also a major deterrent, since users end up paying for lots of features they might never use. Looker Studio has weaknesses on the blending and modeling side, but we've been able to get by via connection to GBQ and transformation done in dbt.
A de minimis incentive was given to thank the reviewer for their time. The incentive was not used to bias or drive a particular response, nor was the incentive contingent on a positive endorsement. More Info
Rational BI allows a deeper data analysis with respect to the other software I experimented with. The velocity to perform the analysis is similar to the other one. The predictive analysis could be very useful, but at the moment I do not use it in my activities. Dashboards are nice and easy to understand.
A de minimis incentive was given to thank the reviewer for their time. The incentive was not used to bias or drive a particular response, nor was the incentive contingent on a positive endorsement. More Info
A de minimis incentive was given to thank the reviewer for their time. The incentive was not used to bias or drive a particular response, nor was the incentive contingent on a positive endorsement. More Info
A de minimis incentive was given to thank the reviewer for their time. The incentive was not used to bias or drive a particular response, nor was the incentive contingent on a positive endorsement. More Info