Logz.io in Boston offers their enterprise-grade log analytics application, oriented towards providing data security and eliminating the need for capacity management.
$0
1 day of log retention.
Splunk Observability Cloud
Score 9.0 out of 10
N/A
Splunk Observability Cloud aims to enable operational agility and better customer experience through real-time AI-driven streaming analytics allowing accurate alerts in seconds. It is designed to shorten MTTD and MTTR by providing real-time visibility into cloud infrastructure and services.
$15
per month (billed annually) per host
Pricing
Logz.io
Splunk Observability Cloud
Editions & Modules
Log Management - Community
$0
1 day of log retention.
Log Management - Pro
$.92
per ingested GB. 7 days retention.
Distributed Tracing - Pro
$5
Per million spans.
Infrastructure Monitoring - Pro
$12
per month per 1000 time-series metrics.
Log Management - Enterprise
Custom
Cloud SIEM - Enterprise
from $1.49
per ingested GB. Price includes Logz.io Log Management
It is appropriate for companies that focus on developing extremely simple applications. The great visibility it provides makes it ideal to avoid problems that may affect the entire business or company thanks to the fact that it is capable of emitting dozens of alerts in a short time. Sometimes the search behavior becomes slow and inefficient, which can be uncomfortable.
The query language is relatively easy and flexible when looking into an application's problems. These queries can then be used for alerts, reports, and dashboards. I believe Splunk is a platform that can help a system grow into its proactive application management, using incidents to add insights as needed without trying to work out every scenario in advance.
Alerting - Logz.io allows you to set up numerous alerts and define the specific conditions to trigger these alerts, such as the number of occurrences over a specific period of time and severity.
Notifications - The supported integrations with Slack and OpsGenie make it easy to set up alerts to specific groups or users, like those in a particular Slack room or OpsGenie group. This is good to reduce noise and limit initial notifications to those who really need to get it.
The first one is its Kubernetes container monitoring.
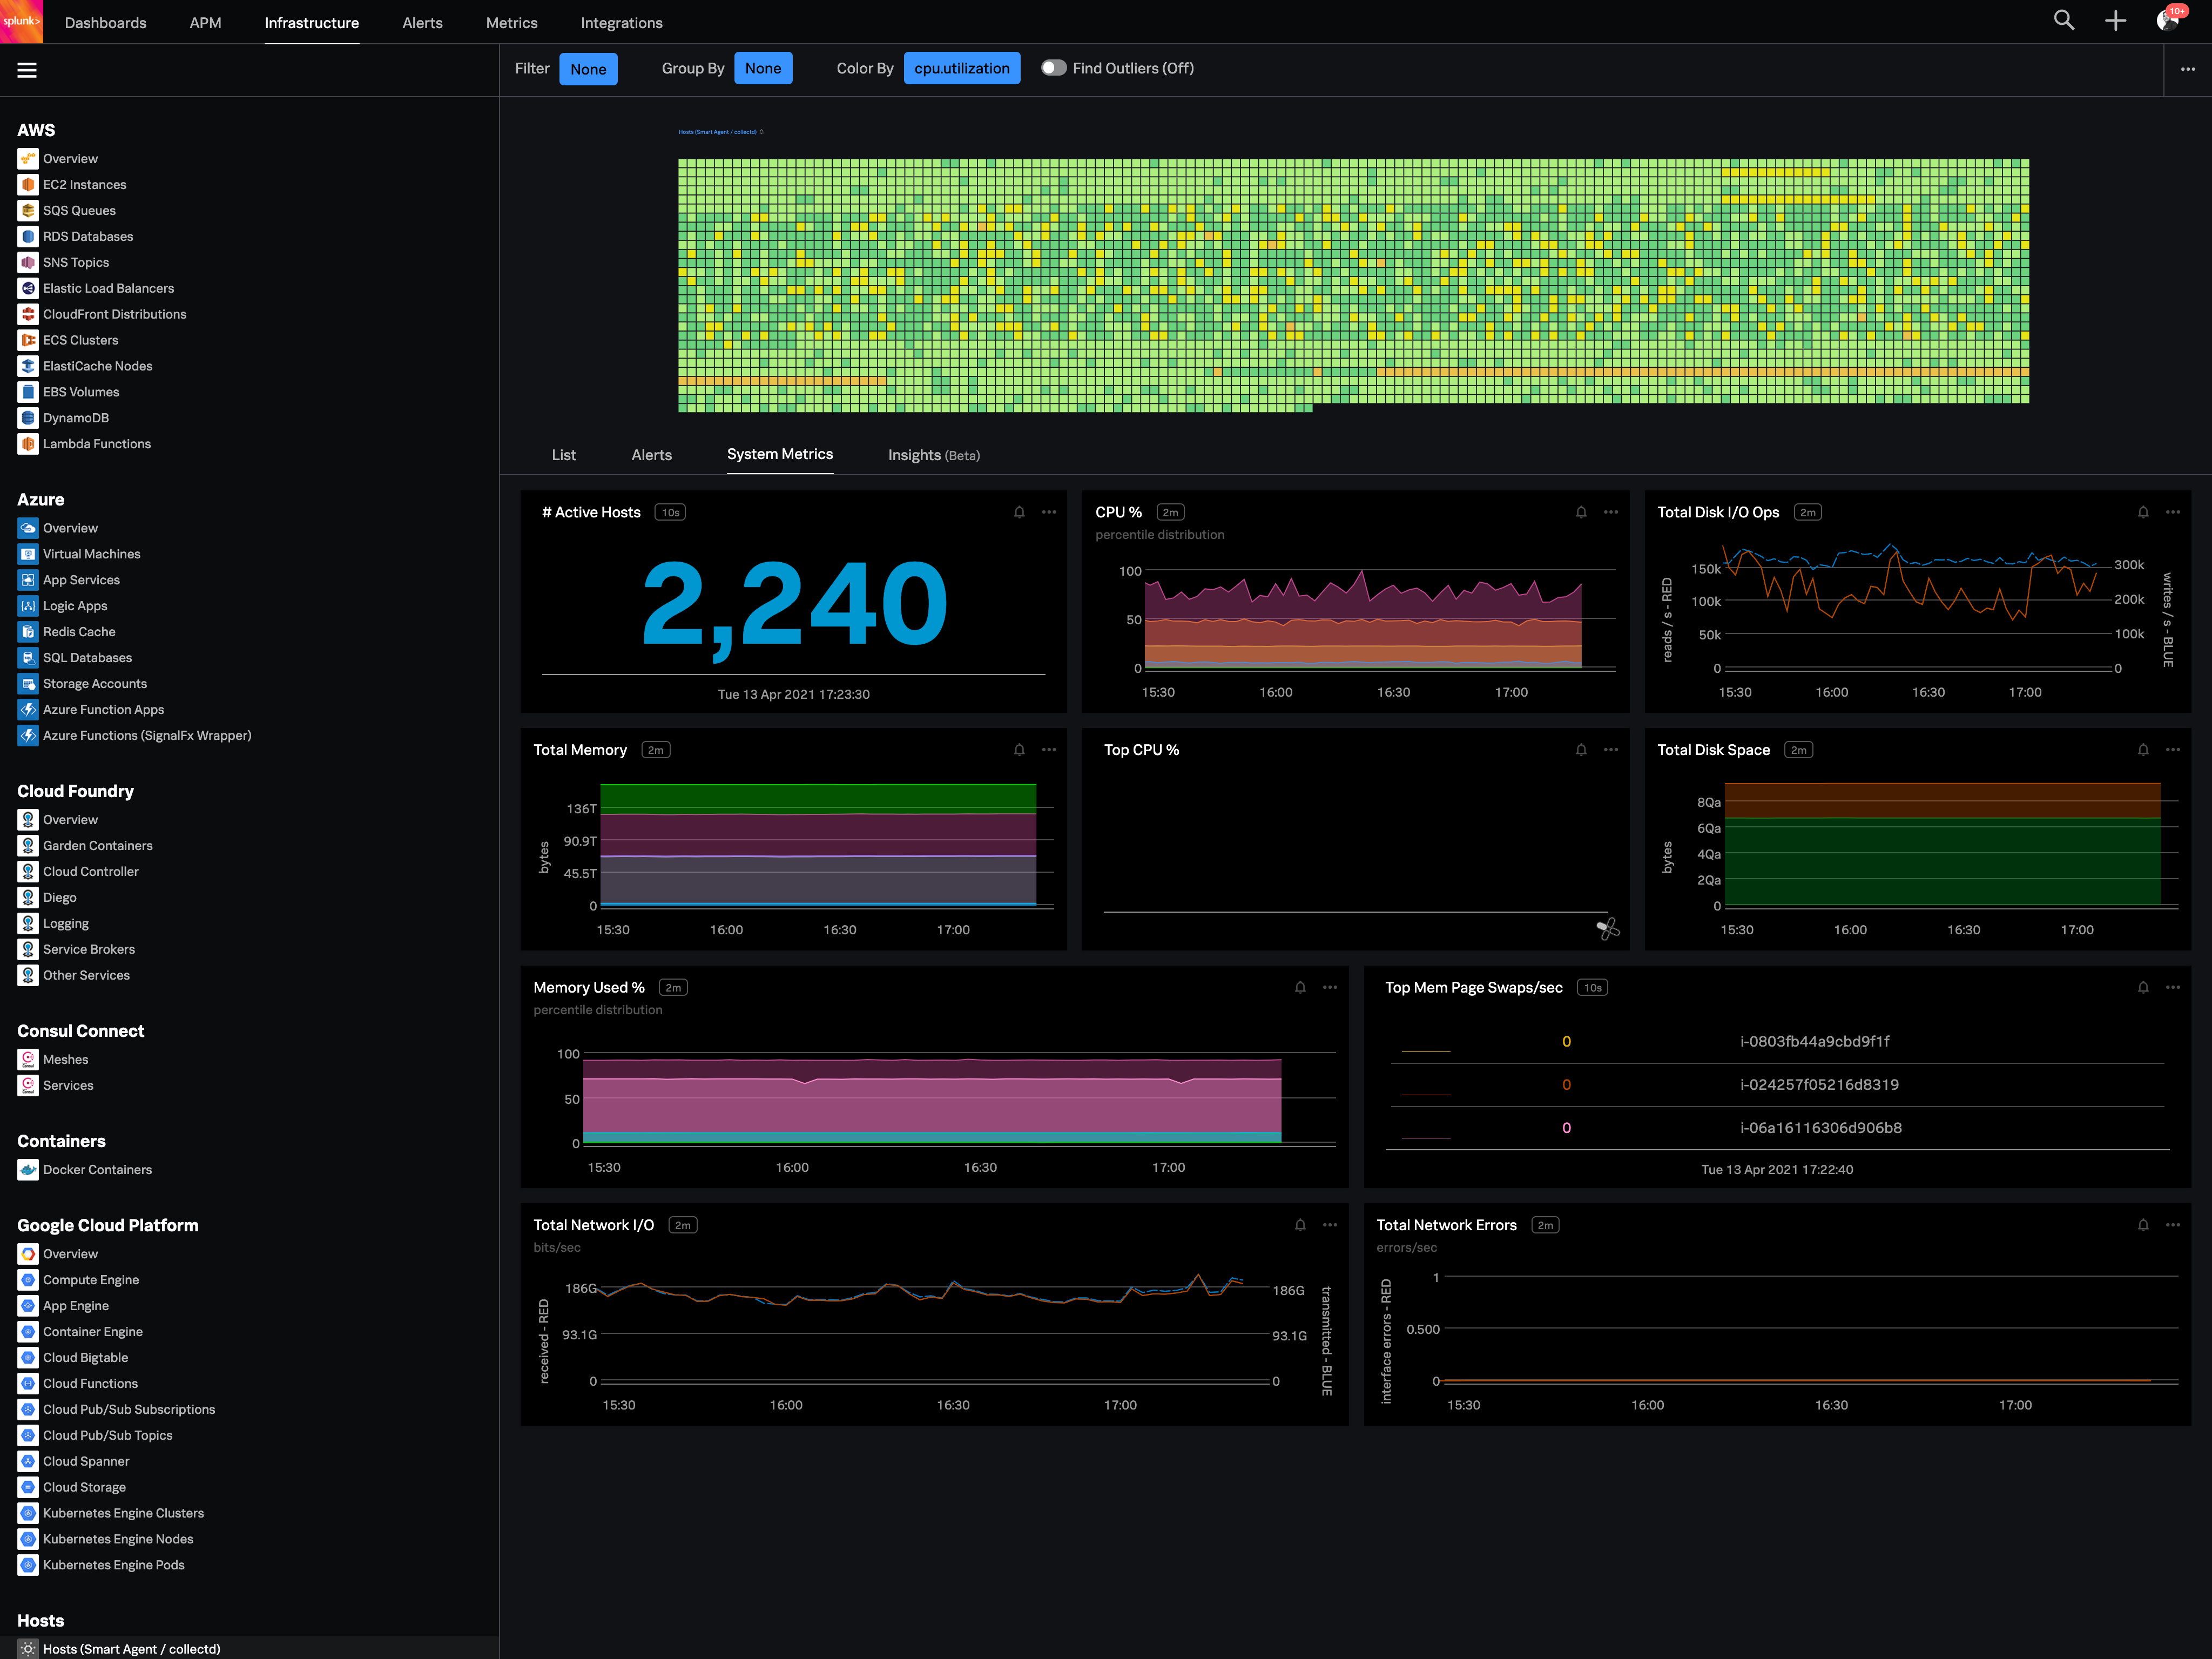
I really like this features because as we know how much K8s is vast and to manually monitor each part of the Kubernetes it takes so much time but Splunk Observability Cloud makes it easier. And even once we integrate K8s with Splunk Observability Cloud it gives us some prebuilt dashboards which gives holistic view of our Cluster and its nodes, pods, etc.
The dashbaord feature of Splunk Observability Cloud, it gives us full flexibility to customize our dashboard with a wide range of predefined chart types.
Now it also supports OTEL, which is a plus point for observability. As now everyone is moving towards Otel and in current market there are only few tools who supports OTEL based integrations, Splunk Observability Cloud is one out of them.
An indicator for errors on the navigations pane so that we don't have to go through each tab.
As we go more and more cloud maybe you guys can implement a pay-as-you-use strategy so that small companies using it not frequently can also afford it.
That's it can't think of any and it wont let me skip to next question. Thanks
Good: Stable system with low error rate Easy to use for simple use cases Bad: UI is not very clear for complex usage Mobile view (when logged in from phone) is bad No library for .net
Am really exited to use the reports generated especially AWS Cost and Usage Reports function tracks your AWS usage and provides estimated charges associated with your account so that we can reduce the data costs to a greater extend. This integration allows you to ship logs from your AWS Cost and Usage Reports to your Logz.io account.More amazing features awaits you in Logz.io account.
When there is an issue, it’s a win if one can easily identify the root cause. To do the same, it should allow the user to dig deep with multiple data points and compare the data and identify the anomaly. In this use case, it’s good to drive from Splunk 011y.
In the past, my team has been able to get in contact with Logz.io quickly and easily to address our questions about the product to see if it could fully meet all our needs. Some of the features we needed at the time were not available, but were on the Logz.io team's roadmap to implement in the future. I found their team to be friendly, professional, and helpful
Graylog and Microsoft System Center lacks infrastructure management and logging, proper analytics is done only on Logz.io. The customer support is also really great for Logz.io, we are really pleased with their support and timely action. The migration was also easy and took us hardly a day to set up and run the solutions.
We initially chose Splunk Observability Cloud because it promised full-stack visibility and tighter integration. The other tools didn't offer this as part of the core package. Their analytics and real-time dashboards looked strong during the demo but it turned out to a lot heavier and more complex than expected. If I had to decide again, I’d probably go with something more streamlined and easier to manage.