
Logi Symphony vs. Stytch
Logi Symphony vs. Stytch
| Product | Rating | Most Used By | Product Summary | Starting Price |
|---|---|---|---|---|
 Logi Symphony | N/A | Logi Symphony is a business intelligence and data visualization software that includes customizable dashboards, reporting, and visual data analytics. It can be integrated into users’ existing business applications and its visualization and reporting tools can be customized. | N/A | |
 Stytch | Mid-Size Companies (51-1,000 employees) | Backed by Dun & Bradstreet, Stytch is an analytics platform that offers a connection to Dun & Bradstreet’s data services to deliver better data matching, blending, and cleansing via the D-U-N-S number. This solution includes a dashboard and self-service data preparation tools. The vendor’s value proposition is that their solution empowers business analysts to blend and model their data, providing the foundation for better quality data discovery and reporting across the… | N/A |
| Logi Symphony | Stytch | |||||||||||||||
|---|---|---|---|---|---|---|---|---|---|---|---|---|---|---|---|---|
| Editions & Modules | No answers on this topic | No answers on this topic | ||||||||||||||
| Offerings |
| |||||||||||||||
| Entry-level Setup Fee | No setup fee | No setup fee | ||||||||||||||
| Additional Details | — | — | ||||||||||||||
| More Pricing Information | ||||||||||||||||
| Logi Symphony | Stytch |
|---|
| Logi Symphony | Stytch | ||||||||||||||||||
|---|---|---|---|---|---|---|---|---|---|---|---|---|---|---|---|---|---|---|---|
| BI Standard Reporting |
| ||||||||||||||||||
| Ad-hoc Reporting |
| ||||||||||||||||||
| Report Output and Scheduling |
| ||||||||||||||||||
| Data Discovery and Visualization |
| ||||||||||||||||||
| Access Control and Security |
| ||||||||||||||||||
| Mobile Capabilities |
| ||||||||||||||||||
| Application Program Interfaces (APIs) / Embedding |
|
| Logi Symphony | Stytch | |
|---|---|---|
| Small Businesses |  BrightGauge Score 9.1 out of 10 | BrightGauge Score 9.1 out of 10 |
| Medium-sized Companies |  Reveal Score 10.0 out of 10 | Reveal Score 10.0 out of 10 |
| Enterprises |  Kyvos Semantic Intelligence Layer Score 9.9 out of 10 | Kyvos Semantic Intelligence Layer Score 9.9 out of 10 |
| All Alternatives | View all alternatives | View all alternatives |
| Logi Symphony | Stytch | |
|---|---|---|
| Likelihood to Recommend | 8.3 (0 ratings) | 10.0 (0 ratings) |
| Likelihood to Renew | 7.0 (0 ratings) | - (0 ratings) |
| Usability | 8.0 (0 ratings) | - (0 ratings) |
| Support Rating | 8.8 (0 ratings) | - (0 ratings) |
| Implementation Rating | 7.3 (0 ratings) | - (0 ratings) |
| Logi Symphony | Stytch | |
|---|---|---|
| Likelihood to Recommend |
 George Robbins Integration/Analytics Consultant | 
 Alex Avery Co-Founder |
| Pros |
 James Davis System Architect |
Alex Avery Co-Founder |
| Cons |
 Ric Ravier Cloud Advisor |
Alex Avery Co-Founder |
| Usability |
| No answers on this topic |
| Support Rating |
| No answers on this topic |
| Implementation Rating |
 Luis Silva BI developer and consultant | No answers on this topic |
| Alternatives Considered |
| No answers on this topic |
| Return on Investment |
|
Alex Avery Co-Founder |
| ScreenShots | Logi Symphony Screenshots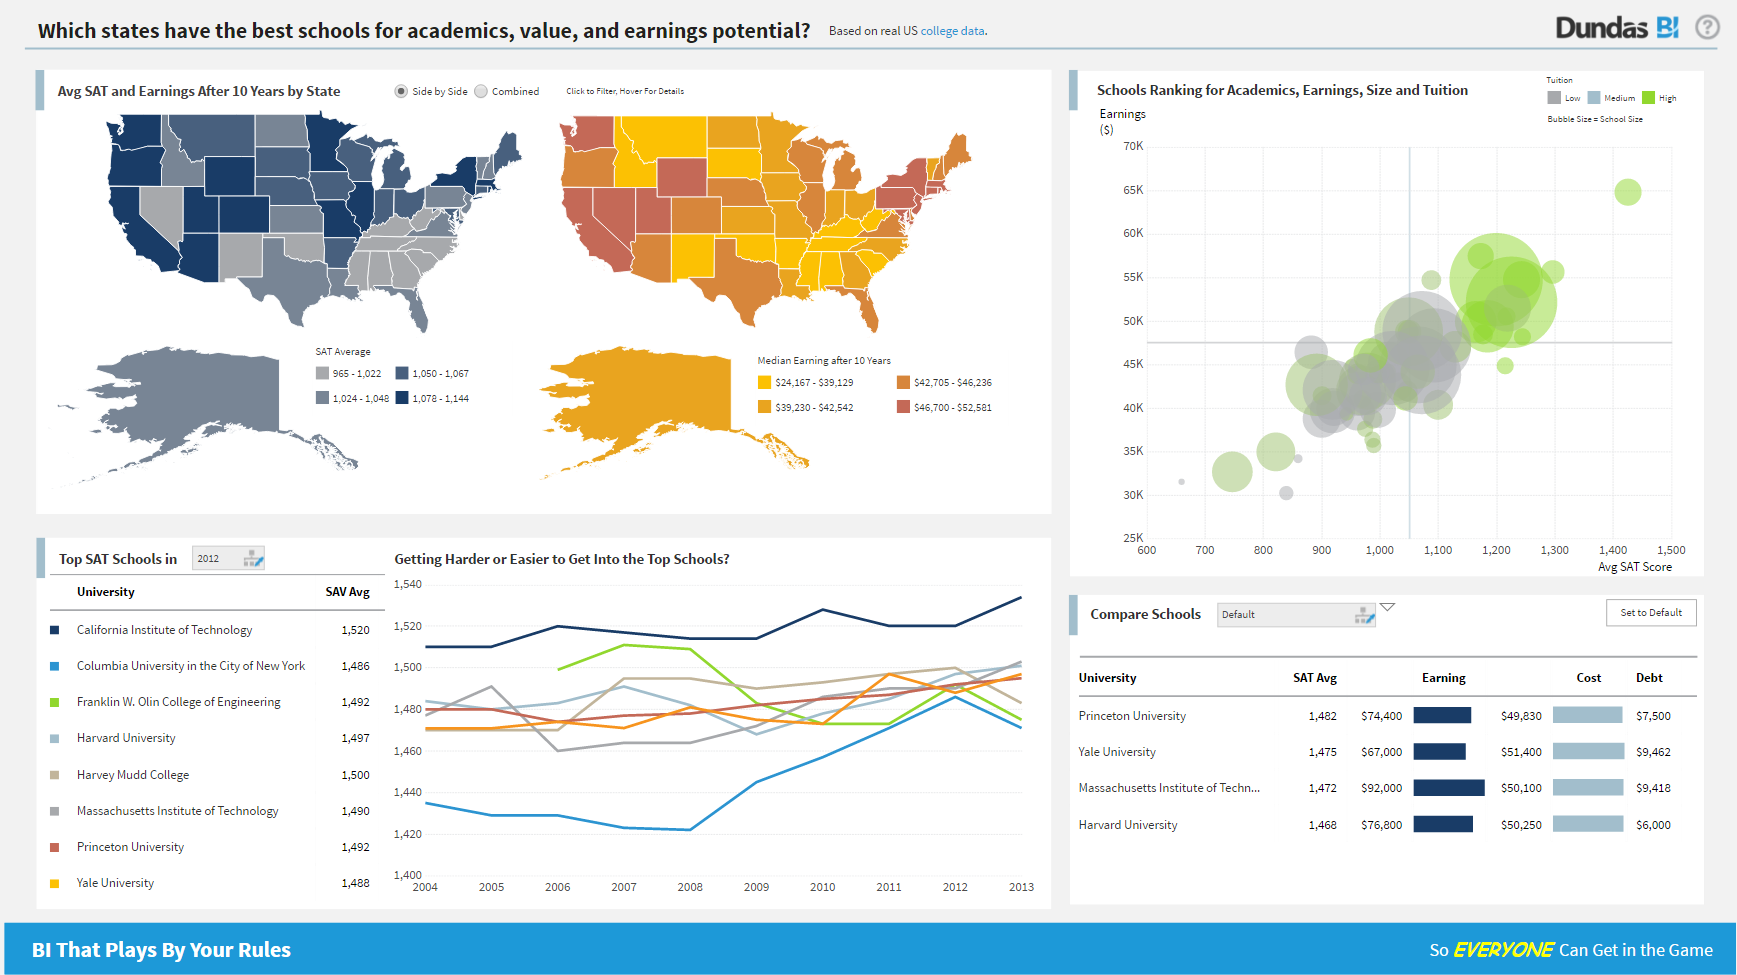 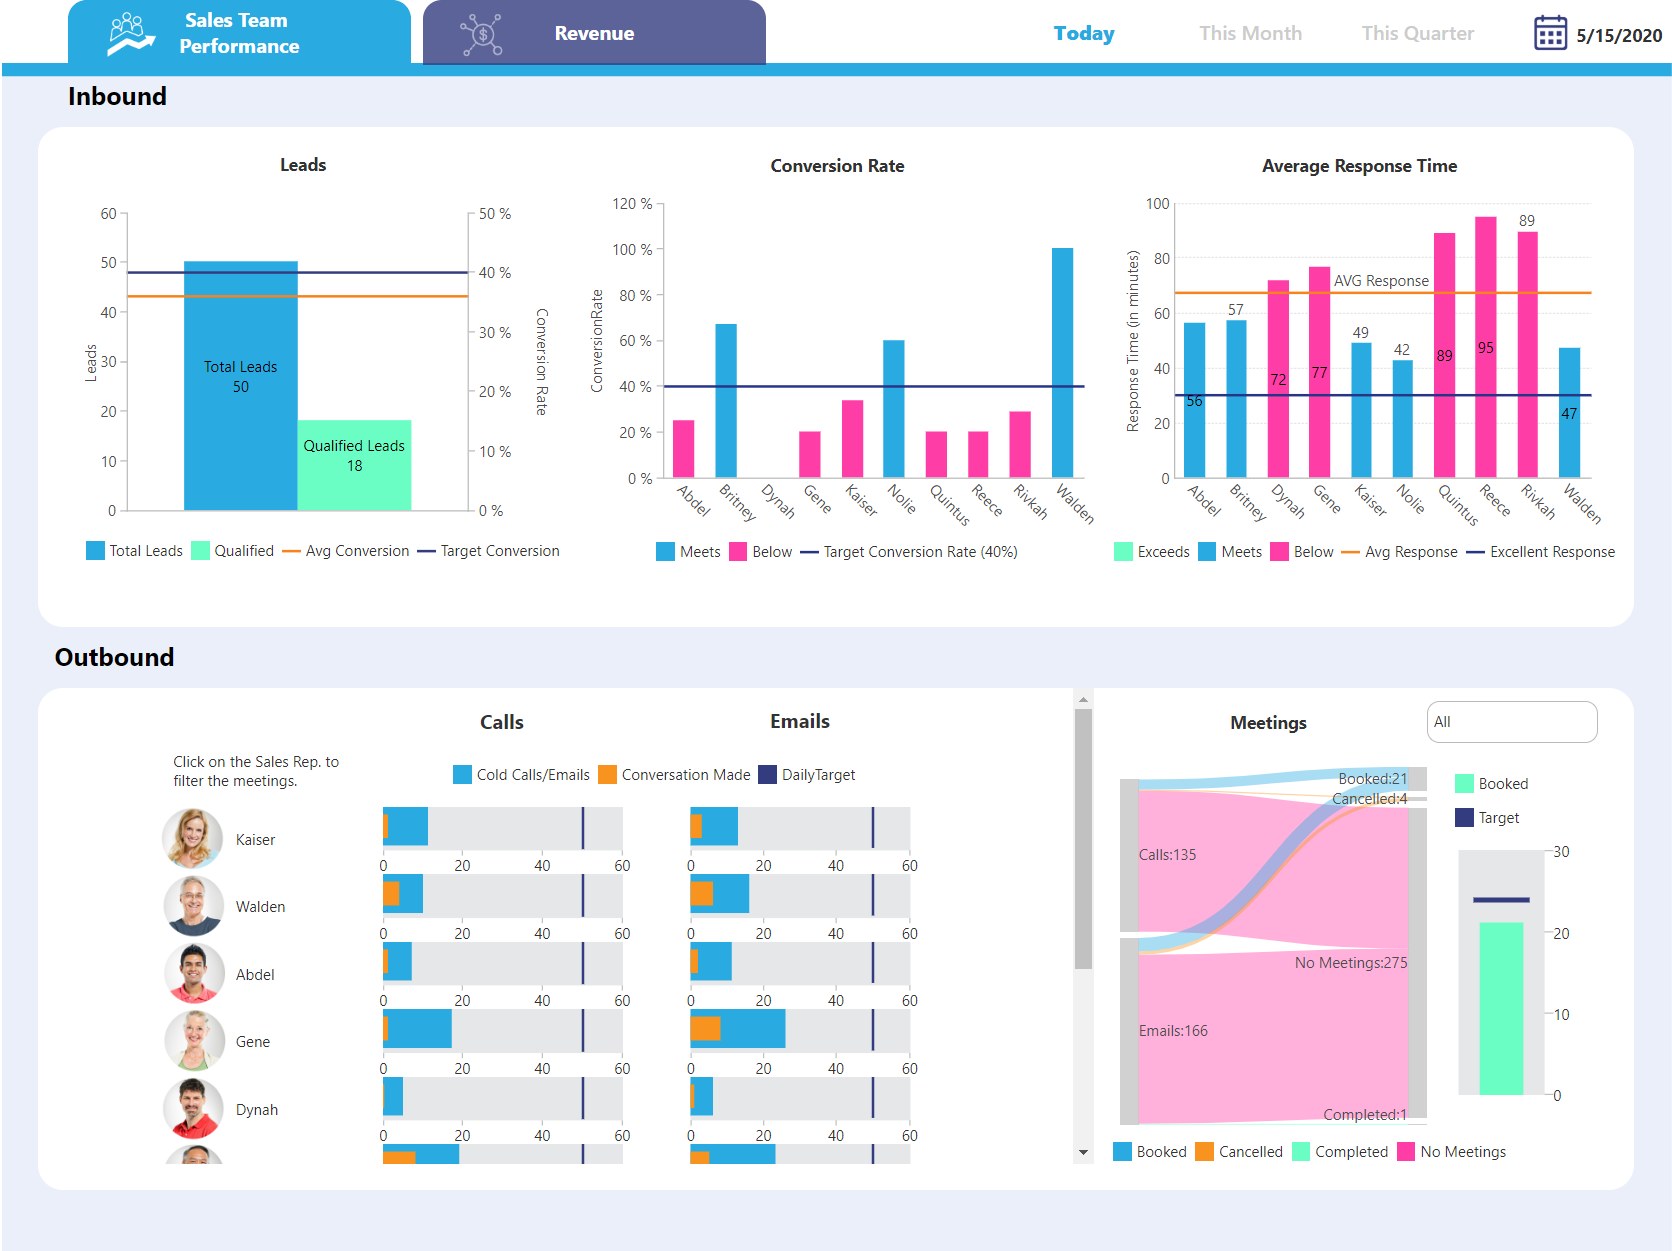  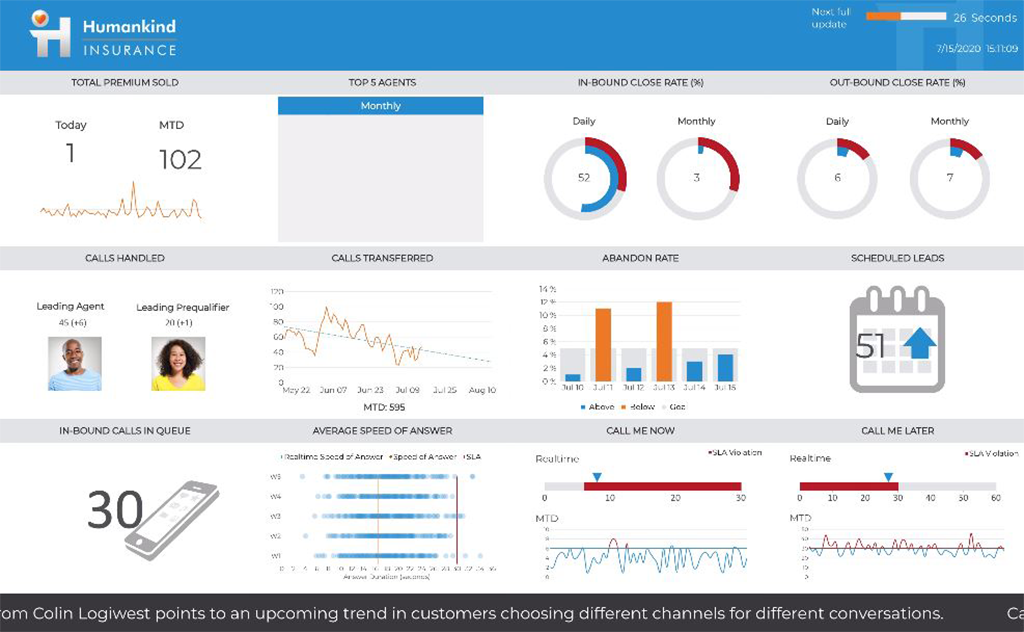   | Stytch Screenshots     |