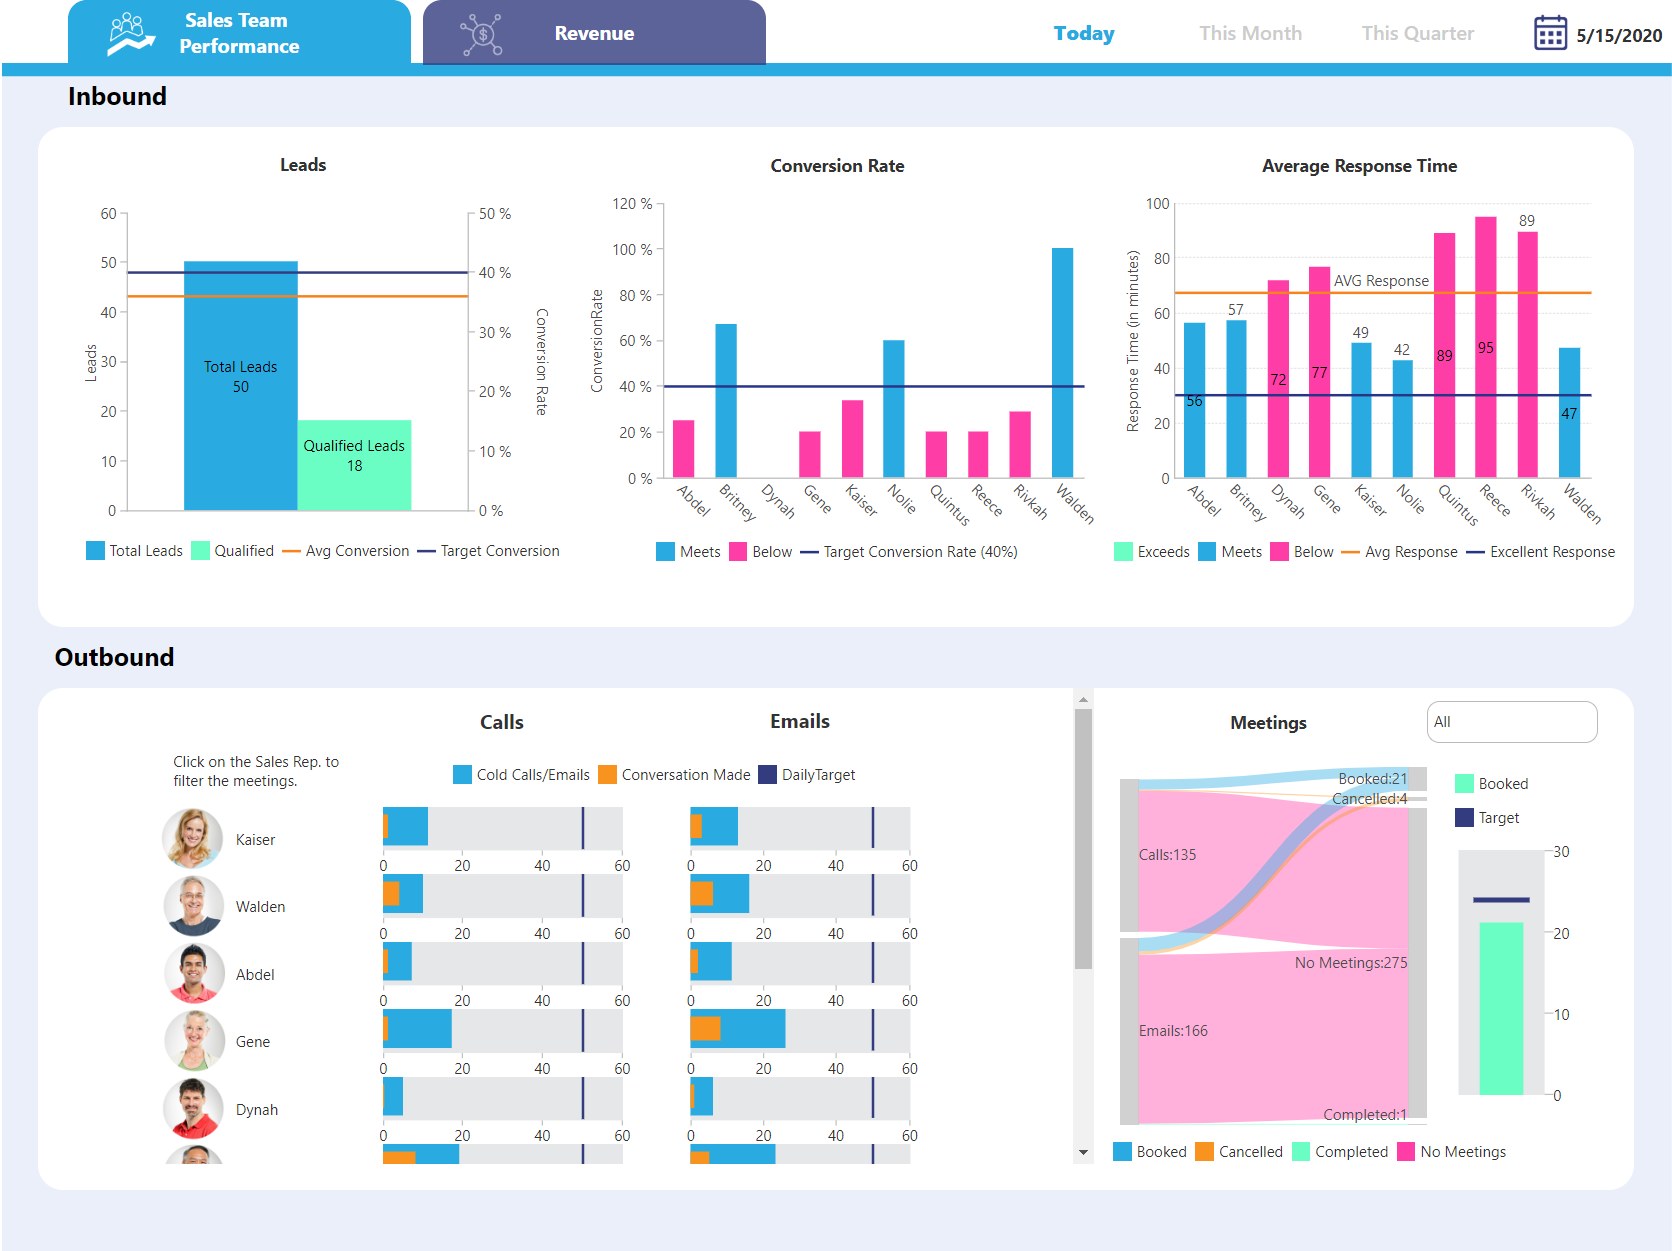
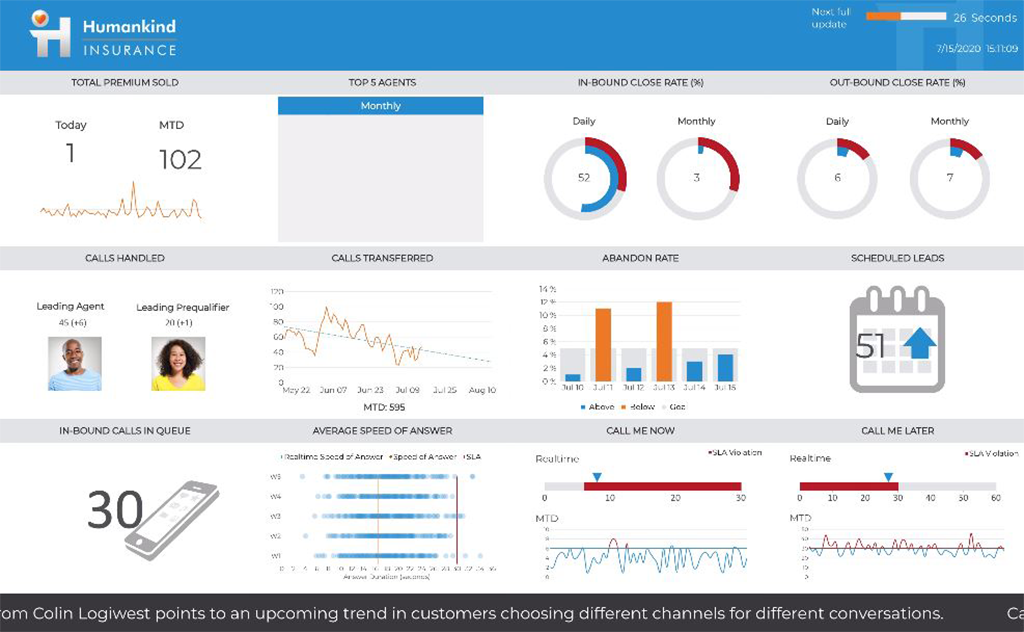
Logi Symphony is a business intelligence and data visualization software that includes customizable dashboards, reporting, and visual data analytics. It can be integrated into users’ existing business applications and its visualization and reporting tools can be customized.
N/A
SAP Lumira Discovery
Score 4.4 out of 10
N/A
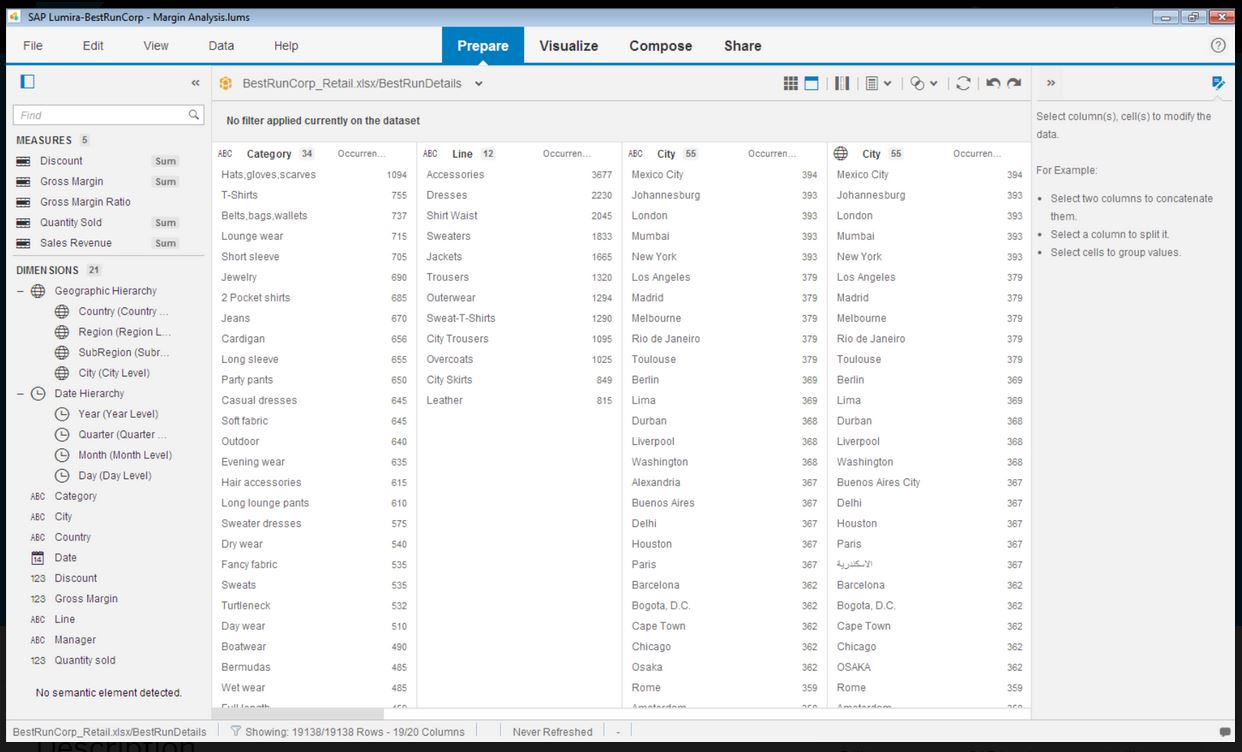
SAP Lumira Discovery is SAP’s data visualization and discovery application. It facilitates data discovery, visualization, and analysis by assisting users with creation of dashboards, infographics, presentations, data facets, tag clouds, and more.
$185
per user
Pricing
Logi Symphony
SAP Lumira Discovery
Editions & Modules
No answers on this topic
SAP Lumira, standard edition
$185
per user
Offerings
Pricing Offerings
Logi Symphony
SAP Lumira Discovery
Free Trial
Yes
Yes
Free/Freemium Version
No
No
Premium Consulting/Integration Services
No
No
Entry-level Setup Fee
No setup fee
No setup fee
Additional Details
—
—
More Pricing Information
Community Pulse
Logi Symphony
SAP Lumira Discovery
Features
Logi Symphony
SAP Lumira Discovery
BI Standard Reporting
Comparison of BI Standard Reporting features of Product A and Product B
Logi Symphony
8.4
Ratings
3% above category average
SAP Lumira Discovery
8.0
Ratings
2% below category average
Pixel Perfect reports
8.40 Ratings
00 Ratings
Customizable dashboards
8.60 Ratings
8.00 Ratings
Report Formatting Templates
8.10 Ratings
00 Ratings
Ad-hoc Reporting
Comparison of Ad-hoc Reporting features of Product A and Product B
Logi Symphony
8.1
Ratings
1% above category average
SAP Lumira Discovery
7.3
Ratings
10% below category average
Drill-down analysis
7.90 Ratings
10.00 Ratings
Formatting capabilities
8.20 Ratings
7.00 Ratings
Integration with R or other statistical packages
7.60 Ratings
00 Ratings
Report sharing and collaboration
8.60 Ratings
5.00 Ratings
Report Output and Scheduling
Comparison of Report Output and Scheduling features of Product A and Product B
Logi Symphony
7.9
Ratings
5% below category average
SAP Lumira Discovery
6.1
Ratings
31% below category average
Publish to Web
8.40 Ratings
7.00 Ratings
Publish to PDF
7.80 Ratings
5.00 Ratings
Report Versioning
7.80 Ratings
00 Ratings
Report Delivery Scheduling
8.30 Ratings
6.30 Ratings
Delivery to Remote Servers
7.20 Ratings
00 Ratings
Data Discovery and Visualization
Comparison of Data Discovery and Visualization features of Product A and Product B
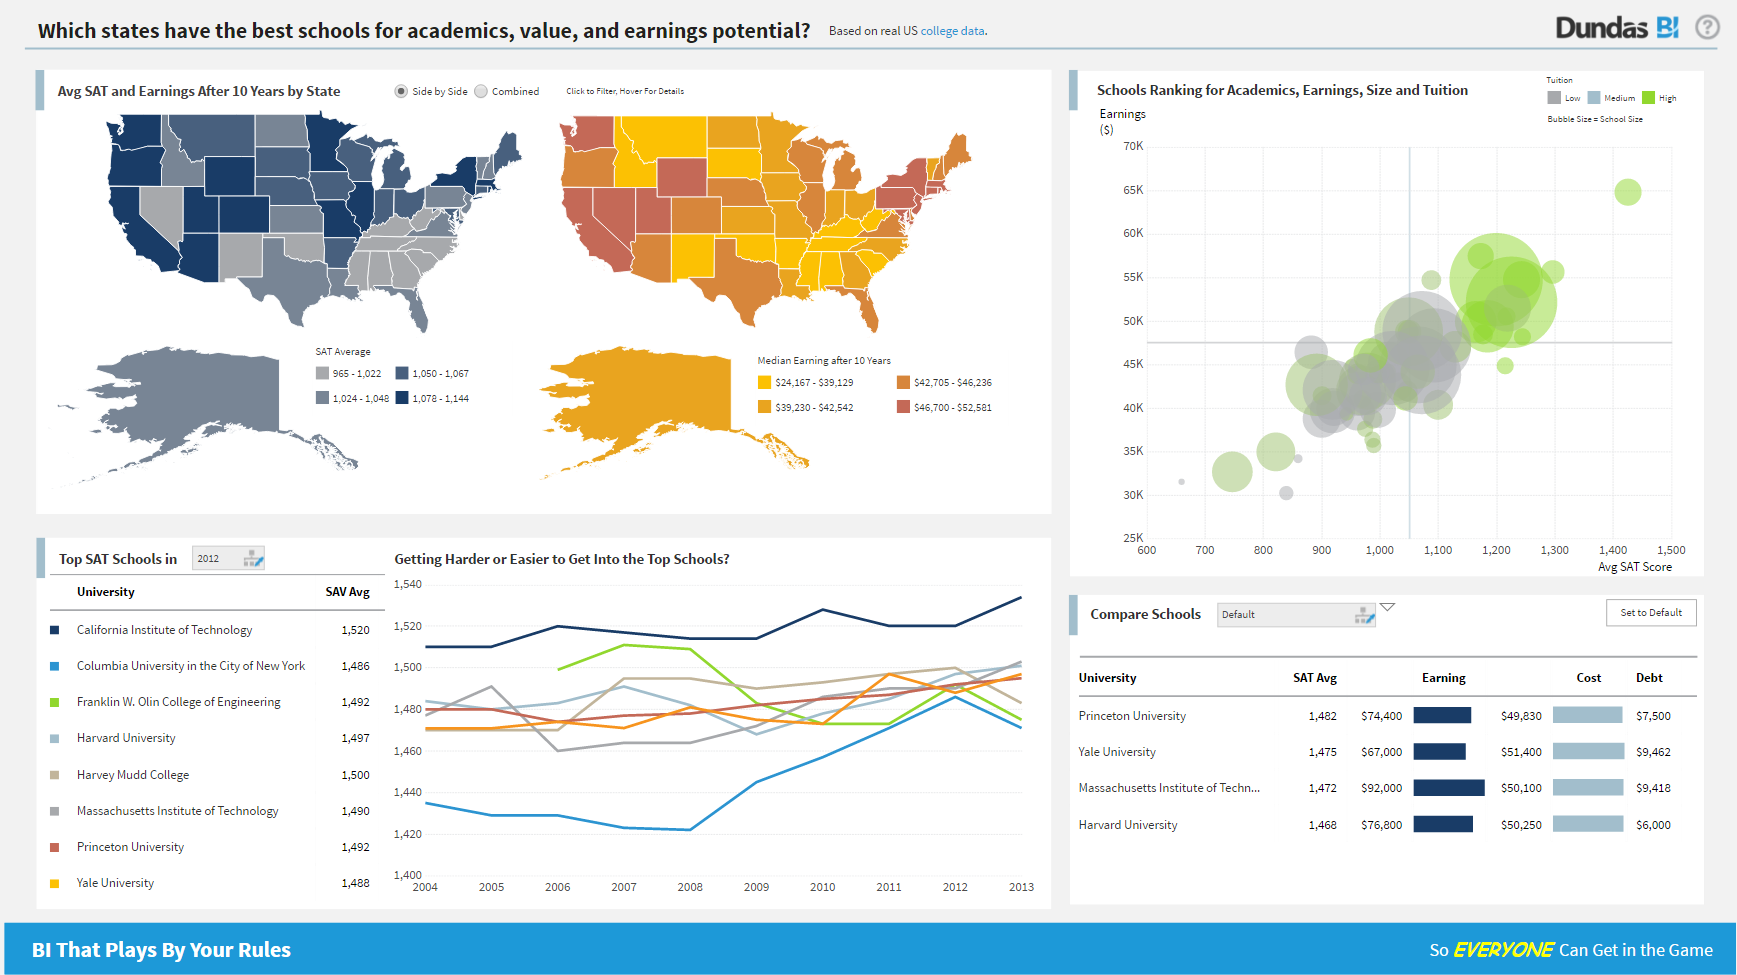
Considering it's price point in the market, Dundas BI offers a lot of functionality. They are constantly adding features and bug fixes which is great, but also means there are always updates to take if you want everything to work as expected. The standard user interface is pretty easy to understand, but it takes a while for developers and power users to become independent of documentation.
SAP Lumira helped to create intuitive and real-time dashboards in a story format to the organization. However with new capabilities of SAP, like SAP Analytics Cloud (SAC) providing more planning and analytical capabilities. Thus the identification of the use cases with the available products should be done. SAC is more integrated and the go to product in SAP roadmap.
Project organization from Development to Production, you get a production and development license but I think the best way to do it is with DEV and Prod project in the Production box. Use the development box for testing updates and really crazy things. With the Dev and Prod projects on the same box, you just publish from Dev to Prod and you are done. Users only have access to the Prod projects so no one can mess up what you are working on.
Security - If you have a hierarchy (subsidiaries, divisions, department, teams) and you want each group to see only their data, then Security hierarchies are for you!
Dependent filters! What's this you ask? Here is an example of how it can be used, in your company you have departments and who works for what department is in your database. You make a dashboard that has a department filter (only show these departments), a managers filter, and employee filter. Not every manager or employee is in multiple departments usually only one. With dependent filters you can say that the manager and employee filter are dependent on what is selected in the departments filter so when you go to filter them they only show the managers or employees that are part of that department, and you can even it do so employees are not only dependent on department but on manager as well. Then it gets even better as it can be done in reverse as well so when you select a manager then go to the department it only shows the departments he works for (there are better situations where this is more useful).
It is scriptable! From calculate columns, null replacements, button actions, load actions, hover over events there a way to do what you want.
They are constantly improving and listens to your suggestions.
Not too many cons for how we use the application. It really is easy and powerful. Very powerful.
Licensing is one thing that could be looked into. It is simple, but a little confusing. For example, if I get a license today, but a new release comes out tomorrow, it seems that the license doesn't work with the new release. Maybe that is by design, but it would be nice to clearly understand.
Control over data import formatting - for example where amount and currency values are imported there is not enough control over the transformation and formatting and this has caused us data import difficulties where values read have been truncated due to punctuation in the amount fields.
The user interface is simplified, but the terminology and screen layout do not always make it obvious how to start the process for a new user - for example to add a new data source or create a new report.
We are still in the implementation phase, but so far we are finding it to be easy to use and learn. The eLearning courses that they have made available for free, as well as User Forums and other training videos have made even difficult concepts easier to understand.
It has good features, the data connectivity and merging is really good, and it has helped our IT team. Nevertheless, it can sometimes be hard to use and some of the features can be found outdated. As we don't have a lot of data, it is a decent tool for our data analytics, but I wouldn't recommend for bigger or more complex businesses with large amounts of data.
Lumira is a desktop application runs in its own JVM. It installs its own java runtime libraries to avoid any core java version conflicts. The availability of the application is completely relies on individual machine hardware configuration. On a decent desktop, it performs well and always launches in either 32 or 64 bit environment based on the hosts system's OS
The performance is linear with amount of data that is being explored. We have done some benchmarks acquiring 10million data cells without having any performance problems. We need to make proper adjustments to jvm run time properties to start with higher heap size and other parameters that optimizes the run time performance
We have bi-weekly calls with our Success Manager, as well as access to support as needed. Any question that I have had, multiple people have been willing and able to jump on a call to talk me through it, or send an email with the solution
It does not have many bugs or issues since not a lot of new features are being added. The customer support for SAP Lumira Discovery is good and anyone considering this as a self-service tool would be happy. It integrates well in the SAP BI suite of products and the overall experience is positive.
Most of the user guides are pretty comprehensive and very easy to understand. The product itself is designed to be self-serve tool, did not need much of the end-user training. Most of the training we had is to how to read the data, how to explore the data, how to acquire the data etc.
Installing the desktop software on end-user machines is always challenging. The machine specifications are the biggest factor when running Lumira and be able to handle large datasets during data exploration. This often demands beefy machines at least for power-users. Although Lumira software licensing is not a big problem but managing partner's extensions and keeping track of their individual licenses may be an issue. If there is a way to bundle the more popular extensions such as vSQL or vOLAP should be bundled in core product and offer them as part of Lumira license instead of a separate license which causer operational burden.
We have tested Tableau prior to Dundas BI and though Tableau is a great package in itself, Dundas BI is much more cost-effective for our needs and requirements and hence zeroed in on Dundas BI. We have also tried microstrategy but it has a very dated UI and doesn't suit our needs in today's more modern world
I have evaluated products such a Tableau Desktop and Splunk and the biggest difference I realized was the ability to include interactive controls in the output. For instance if I wanted to include the ability to filter by a category or filter by a date range, the controls can easily be embedded in other products.
Enterprise wide implementation is a challenge with data security and trustedness. No easy installation can be done across the enterprise. no upgrade paths also available from SAP. They have so much of experience with desktop implementation, there it could be a controlled environment with a capital budget. These may be resolved in the upcoming releases