Logi Symphony vs. SAP Crystal

Overview
ProductRatingMost Used ByProduct SummaryStarting Price
Logi Symphony
Score 8.9 out of 10
N/A
Logi Symphony is a business intelligence and data visualization software that includes customizable dashboards, reporting, and visual data analytics. It can be integrated into users’ existing business applications and its visualization and reporting tools can be customized.N/A
SAP Crystal
Score 7.5 out of 10
N/A
SAP Crystal is an analytics and reporting software solution for SMBs. SAP Crystal comprises Crystal Reports for pixel-perfect reporting, and SAP Crystal Server for automated distribution and self-service access to reports, dashboards and data exploration.
$295
per single user license
Pricing
Logi SymphonySAP Crystal
Editions & Modules
No answers on this topic
Upgrade Version to SAP Crystal Reports 2020
$295
per single user license
SAP Crystal Reports 2020 64-Bit
$495
per single user license
SAP Crystal Reports 2016 32-Bit
$495
per single user license
SAP Crystal Server 2020 1 NUL
$869
per user license + first year maintenance to be added
SAP Crystal Server 2020 5 CAL
$8,744
5 concurrent users + first year maintenance to be added
Offerings
Pricing Offerings
Logi SymphonySAP Crystal
Free Trial
YesYes
Free/Freemium Version
NoYes
Premium Consulting/Integration Services
NoNo
Entry-level Setup FeeNo setup feeOptional
Additional Details* SAP Crystal Reports 2020 Viewer allows you to view static data within a SAP Crystal Reports file. * SAP Crystal Reports 2020 - Full version allows you to create powerful, richly formatted, and dynamic reports from virtually any data source, delivered in dozens of formats, in up to 28 languages. If you already have an older version of Crystal Reports, buy a license for SAP Crystal Reports 2020 - Upgrade at a discounted, upgrade price. * SAP Crystal Server 2020, 1 NUL includes 1 license of: SAP Crystal Reports 2020 - SAP Crystal Server 2020. * As an add-on to SAP Crystal Server 2020 1 NUL, SAP Crystal Server 2020 5 CAL allows you to support a wider, intermittent audience of end users, up to five logged on at the same time.
More Pricing Information
Community Pulse
Logi SymphonySAP Crystal
Considered Both Products
Logi Symphony
Chose Logi Symphony
The feature set is richer, and price is reasonable. We felt we were paying more for Tableau's name than their features, as updates are slow.

Chose Logi Symphony
Dundas ticks all the relevant boxes:
- set up actually easy and works (was not the case for Pentaho)
- you do not need one license per email address you want to send reports to (as for Tableau)
Chose Logi Symphony
Dundas is an easier GUI overall to navigate and is a lot more visually configurable. The number of data connectors available also allows us to use it as a solution for many projects. The support provided is quick and prompt, with great technical depth when required.
Chose Logi Symphony
We have tested Tableau prior to Dundas BI and though Tableau is a great package in itself, Dundas BI is much more cost-effective for our needs and requirements and hence zeroed in on Dundas BI.

We have also tried Microstrategy but it has a very dated UI and doesn't suit our …
Chose Logi Symphony
Per dollar spent, it offers the widest range of features of the tools that we evaluated. It offers lots of options for how to configure your environment, though they are not always intuitive to figure out. Having an ETL layer was a must have for us, as well as the ability to …
Chose Logi Symphony
Much better for multi-tenancy. Power bi just doesn't have many features and is just lackluster. telerik doesn't look as good although slightly more powerful with data manipulation. Too many BI reporting tools out there don't offer multi-tenancy and I have no idea why. It is …
Chose Logi Symphony
We were comparing Dundas BI against several other programs and eventually decided to go with Oracle as we were already using a host of their other products. Dundas was just as robust, we were just using more Oracle products and they all fit together very smoothly.
Chose Logi Symphony
Personally as a dashboard software I use Qlik Sense more because I consider it a very simple product to use, but this is a personal choice. However, for some things, it does not satisfy me fully. In my opinion, they are software that are alternated depending on the customer in …
Chose Logi Symphony
It is the Powerful bi tool with many features to quickly build up reports, dashboard etc. You can customize everything and it is easy to use.
Chose Logi Symphony
It is easy to develop and re-visualize the reports and the license is too less expensive compared to other tools which are overpriced.
Chose Logi Symphony

I have used dozens of BI tools, a ew for many years like IBM Cognos and other for several months POCs like microstrategy, Panorama, Tableau etc...

For our industry and our daily use Dundas BI wins since it is very flexible and can bring us the greater value we can achieve from a …

Chose Logi Symphony
It is a very good tool for dashboard and scorecard design. It looks great. However, it requires a lot of work regarding renaming components, deploying between different environments, and scripting customized functionalities.
Chose Logi Symphony
Dundas has a newer feel to the software and gives us more flexibility than the other products.
Chose Logi Symphony
These other products tend to do quite a poor job of allowing you to embed them into other products. Either the architecture is not suited to embedding or they make it too expensive to do this. Dundas is designed and priced to do this (embedding) well. We found Dundas …
Chose Logi Symphony
Found Tableau was powerful, but did not have some of the more beneficial feature sets (like sharing links, and notes) that Dundas BI offers.
Chose Logi Symphony
Dundas and Sisense are very similar. Both are very powerful and flexible with an eye toward further innovation. I expect both will do well as we enter a major transition period for BI.

Periscope Data and Dundas differ substantially and seem to have different paths forward. …
Chose Logi Symphony
Dundas BI offers a high level of visual customization in the dashboards if required (through CSS, JavaScript, HTML) as well data customization (C#) in the data cubes. We are an organization that believes in doing as much as possible for ourselves and not replying on …
Chose Logi Symphony
Dundas is the only tool I've had to use for report viewing. Before I used libraries to develop my own report.

Chose Logi Symphony
We were a user of Dundas Dashboard previously. We had explored other tools, but we ended up upgrading to Dundas BI because of the HTML 5 compliance (no more Silverlight requirement), ease of use and time to market. The other tools could do the job, but they were not as flexible …
Chose Logi Symphony
I selected Dundas BI to be our preferred partner since we saw that it the most flexible tool that allows our customers to design their dashboards in they way that they are not restricted in their development process.
Chose Logi Symphony
We found that Dundas BI struck the perfect balance between ease of use and flexibility, while still remaining within a reasonable budget. Other products were either to technical, lacked functionality, or "broke the bank".
Chose Logi Symphony
It is much more powerful to build more interactive and feature rich dashboards. Most of the above are great at ad hoc analysis but not for providing a full feature and rich guided dashboard experience. Dundas BI is great to build a suite of dashboards and easy to deploy …
Chose Logi Symphony
We looked into Tableau, Qlikview also. These tools are doing all the same basically. There are some items which DundasBi does do really well. Next to the product the organzation behind is really dedicated and commited with their customers. They treat you as a customer and just …
SAP Crystal
Chose SAP Crystal
SAP Crystal reports are generally in more formatted way where you can design header according to your requirements and data will be fetched from the data source accordingly. According to my analysis this is the only thing when required i'll be happy to use SAP Crystal report …
Chose SAP Crystal
SAP Crystal Reports contains all the reporting capabilities of the above peer technologies. There is not a single capability of the above tools which is not available in Crystal report. But Crystal being an offering SAP fares and performs best for SAP integrated source systems. …
Chose SAP Crystal
Good user interface. Friendly with financial reporting. Reliable with intergration and ease of use.
Chose SAP Crystal
Qlik Sense and Qlik View are all good tools and provide similar views and analyses like SAP Crystal. However, SAP Crystal is quite easy to use and more intuitive for people who have no background with coding and cloud-based tools. The ability to automate generating and sending …
Chose SAP Crystal
We found that Crystal was a little more intuitive to our team members than the other products. All of the products were excellent choices but we liked the ability to code stored procedures to gather our data. While each product has very similar features, we went with …
Chose SAP Crystal
Qlik is better in terms of reading data from different sources but it doesn’t have the auto doc ability like SAP Crystal Tableau. It is a decent visualization tool but doesn’t have the same ability in terms of rendering output reports into a suitable format. Plus the cost of …
Chose SAP Crystal
We've had SAP Crystal for about ten years at this point. We've never really evaluated any alternatives since, as of today, well over 400 reports are being generated in the system, and we've yet to consider switching to a competing product.
Chose SAP Crystal
For automating documents and reports, I personally believe there is no better solution. However, for the sheer fact, it can't compare/combine two sources, I'd recommend pairing it with another BI tool. For example, Qlik, whereby you can create dashboards and compare multiple …
Chose SAP Crystal
We originally purchased Crystal as it aligned with our vendors' recommendations for reporting. We have since started to focus our development on more self-service and dashboard-type tools (like QlikView, Qlik Sense, and similar). These tools are more mature and capable than …
Chose SAP Crystal
We develop our desktop applications in Visual studio IDE, we use SQL Server as a database engine, and the reports are managed by SAP Crystal since it does not limit us when it comes to displaying data. It supports all kinds of information from images and graphics.
Chose SAP Crystal
For standard pixel perfect reporting, our company still uses Crystal Reports. It allows us to continually provide standard reporting to our clients. For dashboards, we are moving towards Microsoft Power BI. Power BI allows similar collaboration, but generally has better …
Chose SAP Crystal
Fully integrates into SAP B1 menus, it is the only reporting tool that fully integrates with B1 client, otherwise if you dont run SAP you can have all the reporting power and run reports from the crystal report viewer tool but you will not have menu like reports and you …
Chose SAP Crystal
As I stated in the previous question, the SQL Server reporting engine provides necessary scheduling services to allow for employee self-service. It also supports granular security, based upon active directory, to control who can see which report. SAP Crystal is still superior …
Chose SAP Crystal
Crystal offered a more straightforward implementation for our situation. While Tableau offers well-designed reports, the overall functionality regarding data manipulation and analysis is behind Crystal.

Chose SAP Crystal
Our requirements were static in nature and we had a bias for SAP due to the availability of skilled in-house resources.
Chose SAP Crystal
I tried using Cognos, but I found trhat I prefered Crystal Reports because it does not require you to set up a meta data layer before setting up your reports. That is a real time saver for me.
Chose SAP Crystal
Crystal reports is useful in case we want to import data from data base . We can write queries in it but google charts require to be implemented in our application using code so crystal reports is better than google charts.
Chose SAP Crystal
For now, our team is not using any tool but we are looking for other easily learned tools to minimize our tasks more.
Chose SAP Crystal
I didn't make the decision in terms of selecting the software for the department. However, SAP Crystal is a great tool for a medium size department to increase their efficiency. There might be a different software on the market but I haven't used any similar software except …
Chose SAP Crystal
We actually have all 3 in place and all 3 are used in different situations. Some are bundled with certain products so we continue to use them. Others such as BI from Microsoft are stand alone and allow for easier data visualizations than SAP Crystal does. We chose SAP Crystal …
Chose SAP Crystal
We didn't so much evaluate them as use them side by side. Crystal was already here so we didn't replace it or think to replace it. We just added other programs that do things better. Both Power B and Dynamics are good at visualizing data in charts. Crystal is the workhorse
Chose SAP Crystal
I have done a little bit in Microsoft SSRS and a bunch in SAP Web Intelligence (Webi). Both of those are good at what they do. Like Crystal, SSRS is more technical. Webi is great for quick ad-hoc reports or data analyses. But with Crystal I can easily do things like …
Chose SAP Crystal
PowerBI is starting to replace Crystal Reports. PowerBI is a Microsoft tool. It also brings different types of data in to the same report. PowerBi allows for more data types than Crystal does. Crystal Reports allows you to create formulas easier than PowerBI does. I am very …
Chose SAP Crystal
SAP Crystal offers more flexibility and has more tools and functions than every program I've ever tried!
Features
Logi SymphonySAP Crystal
BI Standard Reporting
Comparison of BI Standard Reporting features of Product A and Product B
Logi Symphony
8.4
Ratings
3% above category average
SAP Crystal
9.3
Ratings
13% above category average
Pixel Perfect reports8.40 Ratings8.00 Ratings
Customizable dashboards8.60 Ratings10.00 Ratings
Report Formatting Templates8.10 Ratings10.00 Ratings
Ad-hoc Reporting
Comparison of Ad-hoc Reporting features of Product A and Product B
Logi Symphony
8.1
Ratings
1% above category average
SAP Crystal
9.6
Ratings
17% above category average
Drill-down analysis7.90 Ratings10.00 Ratings
Formatting capabilities8.20 Ratings10.00 Ratings
Integration with R or other statistical packages7.60 Ratings8.60 Ratings
Report sharing and collaboration8.60 Ratings10.00 Ratings
Report Output and Scheduling
Comparison of Report Output and Scheduling features of Product A and Product B
Logi Symphony
7.9
Ratings
5% below category average
SAP Crystal
9.4
Ratings
12% above category average
Publish to Web8.40 Ratings9.20 Ratings
Publish to PDF7.80 Ratings10.00 Ratings
Report Versioning7.80 Ratings9.00 Ratings
Report Delivery Scheduling8.30 Ratings9.00 Ratings
Delivery to Remote Servers7.20 Ratings10.00 Ratings
Data Discovery and Visualization
Comparison of Data Discovery and Visualization features of Product A and Product B
Logi Symphony
7.8
Ratings
2% below category average
SAP Crystal
8.0
Ratings
0% above category average
Pre-built visualization formats (heatmaps, scatter plots etc.)8.10 Ratings7.60 Ratings
Location Analytics / Geographic Visualization7.90 Ratings8.50 Ratings
Predictive Analytics7.40 Ratings7.80 Ratings
Access Control and Security
Comparison of Access Control and Security features of Product A and Product B
Logi Symphony
8.2
Ratings
3% below category average
SAP Crystal
8.6
Ratings
1% above category average
Multi-User Support (named login)8.60 Ratings7.80 Ratings
Role-Based Security Model8.00 Ratings7.70 Ratings
Multiple Access Permission Levels (Create, Read, Delete)8.20 Ratings8.40 Ratings
Single Sign-On (SSO)8.20 Ratings9.00 Ratings
Report-Level Access Control00 Ratings10.00 Ratings
Mobile Capabilities
Comparison of Mobile Capabilities features of Product A and Product B
Logi Symphony
8.2
Ratings
5% above category average
SAP Crystal
8.4
Ratings
7% above category average
Responsive Design for Web Access8.30 Ratings8.70 Ratings
Dashboard / Report / Visualization Interactivity on Mobile8.10 Ratings9.00 Ratings
Mobile Application00 Ratings7.60 Ratings
Application Program Interfaces (APIs) / Embedding
Comparison of Application Program Interfaces (APIs) / Embedding features of Product A and Product B
Logi Symphony
7.8
Ratings
0% above category average
SAP Crystal
6.9
Ratings
12% below category average
REST API8.20 Ratings7.40 Ratings
Javascript API8.60 Ratings6.00 Ratings
iFrames7.00 Ratings7.10 Ratings
Themeable User Interface (UI)7.70 Ratings8.30 Ratings
Customizable Platform (Open Source)7.50 Ratings7.00 Ratings
Java API00 Ratings6.00 Ratings
Best Alternatives
Logi SymphonySAP Crystal
Small Businesses
BrightGauge
BrightGauge
Score 9.1 out of 10
BrightGauge
BrightGauge
Score 9.1 out of 10
Medium-sized Companies
Reveal
Reveal
Score 10.0 out of 10
Reveal
Reveal
Score 10.0 out of 10
Enterprises
Kyvos Semantic Intelligence Layer
Score 9.9 out of 10
Kyvos Semantic Intelligence Layer
Score 9.9 out of 10
All AlternativesView all alternativesView all alternatives
User Ratings
Logi SymphonySAP Crystal
Likelihood to Recommend
8.3
(0 ratings)
10.0
(0 ratings)
Likelihood to Renew
7.0
(0 ratings)
10.0
(0 ratings)
Usability
8.0
(0 ratings)
9.5
(0 ratings)
Availability
-
(0 ratings)
8.0
(0 ratings)
Performance
-
(0 ratings)
8.0
(0 ratings)
Support Rating
8.8
(0 ratings)
8.6
(0 ratings)
In-Person Training
-
(0 ratings)
10.0
(0 ratings)
Implementation Rating
7.3
(0 ratings)
8.8
(0 ratings)
Configurability
-
(0 ratings)
8.0
(0 ratings)
Ease of integration
-
(0 ratings)
7.0
(0 ratings)
Product Scalability
-
(0 ratings)
7.0
(0 ratings)
Vendor post-sale
-
(0 ratings)
8.0
(0 ratings)
Vendor pre-sale
-
(0 ratings)
7.0
(0 ratings)
User Testimonials
Logi SymphonySAP Crystal
Likelihood to Recommend
Considering it's price point in the market, Dundas BI offers a lot of functionality. They are constantly adding features and bug fixes which is great, but also means there are always updates to take if you want everything to work as expected. The standard user interface is pretty easy to understand, but it takes a while for developers and power users to become independent of documentation.
Read full review
Generation of templated reports is the strong suit of SAP Crystal. Allows users to change formats in templates bases on requirement with minimal effort. Automated report delivery requires the user to be aware of sql which cannot be expected from all users. Should support more document export formats and improve the UI for SAP B1 Users
Read full review
Pros
  • Project organization from Development to Production, you get a production and development license but I think the best way to do it is with DEV and Prod project in the Production box. Use the development box for testing updates and really crazy things. With the Dev and Prod projects on the same box, you just publish from Dev to Prod and you are done. Users only have access to the Prod projects so no one can mess up what you are working on.
  • Security - If you have a hierarchy (subsidiaries, divisions, department, teams) and you want each group to see only their data, then Security hierarchies are for you!
  • Dependent filters! What's this you ask? Here is an example of how it can be used, in your company you have departments and who works for what department is in your database. You make a dashboard that has a department filter (only show these departments), a managers filter, and employee filter. Not every manager or employee is in multiple departments usually only one. With dependent filters you can say that the manager and employee filter are dependent on what is selected in the departments filter so when you go to filter them they only show the managers or employees that are part of that department, and you can even it do so employees are not only dependent on department but on manager as well. Then it gets even better as it can be done in reverse as well so when you select a manager then go to the department it only shows the departments he works for (there are better situations where this is more useful).
  • It is scriptable! From calculate columns, null replacements, button actions, load actions, hover over events there a way to do what you want.
  • They are constantly improving and listens to your suggestions.
Read full review
  • Great visualization for static format & precise tasks: For presentation to senior management /ex-co/vendors where concise decisions need to be made, Crystal is a nice choice to slide data into presentable views.
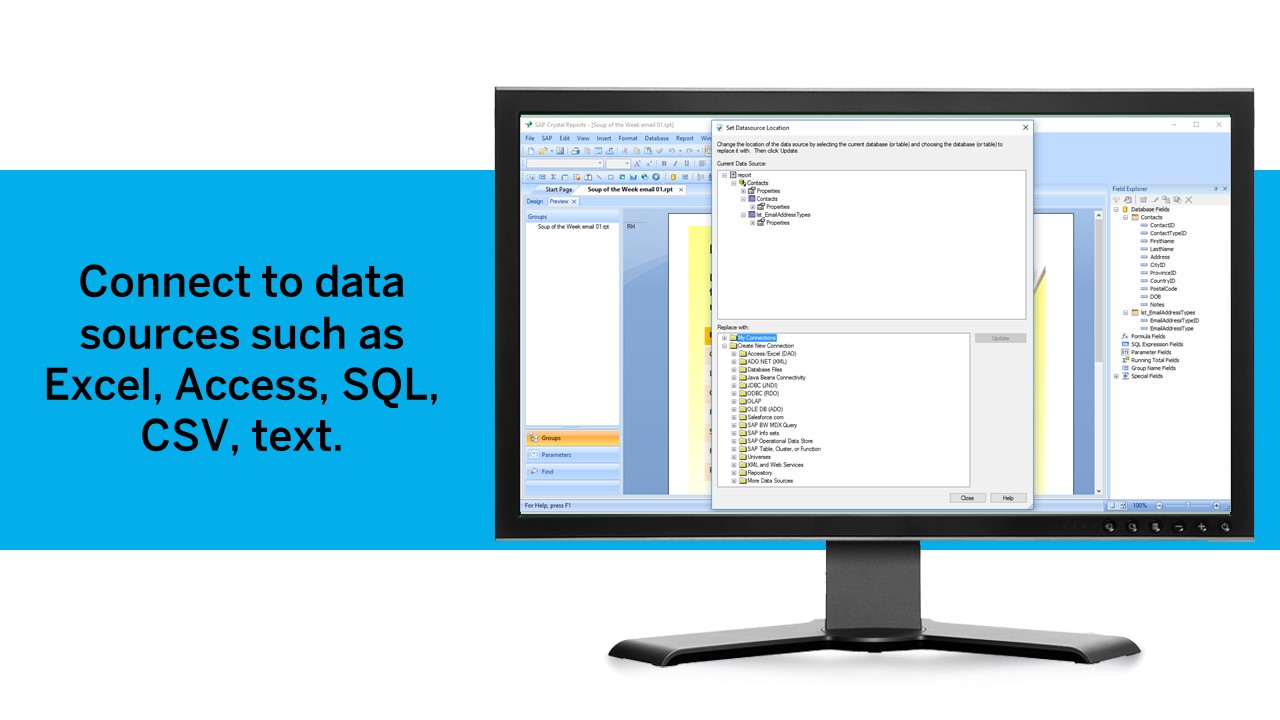
  • Diverse data source connect: We have used it to write reports using data from DB2, SQL, Progress, Excel spreadsheets, XML data, Access, and Lotus Notes databases. It can also be used to join different database types together in one report.
  • It uses the "recurring bands" structure for page layout which is efficient and fungible for generating different types of reports. Crystal doesn't require that we set up a metadata layer before creating reports and provides direct access to tables and dimensions.
Read full review
Cons
  • Not too many cons for how we use the application. It really is easy and powerful. Very powerful.
  • Licensing is one thing that could be looked into. It is simple, but a little confusing. For example, if I get a license today, but a new release comes out tomorrow, it seems that the license doesn't work with the new release. Maybe that is by design, but it would be nice to clearly understand.
Read full review
  • Crystal Reports charting engine is ok but compared to some other visualization products available it is behind the times.
  • Crystal Reports uses a proprietary format for its data storage, using an open format (like XML) would be much better
  • You cannot add add a structured table object to the page layout, you can only use lines and boxes
Read full review
Likelihood to Renew
No answers on this topic
We have been using this product for so many years and it has truly become a cornerstone to our business processes when it comes to developing and distributing information via reports. We currently have over 500 reports developed to date over about 30 systems and that will continue to grow as user needs change.
Read full review
Usability
We are still in the implementation phase, but so far we are finding it to be easy to use and learn. The eLearning courses that they have made available for free, as well as User Forums and other training videos have made even difficult concepts easier to understand.
Read full review
Being able to get up and running quickly is a key asset. There's plenty of advanced features to master that are surprisingly difficult in others tools (or just missing from other tools altogether). The UI can feel a bit dated at times but its usability isn't affected. Any issue you have can usually be resolved by searching in the user community
Read full review
Support Rating
We have bi-weekly calls with our Success Manager, as well as access to support as needed. Any question that I have had, multiple people have been willing and able to jump on a call to talk me through it, or send an email with the solution
Read full review
SAP Crystal report is very supportive in daily need of reports or any organization. Basic functionality of operational reports detailing the Sales Order details or PO in a manner which can be used very easily. A readily available solution for delivering any customized need in terms of pixelated reporting can be met easily with the tool
Read full review
In-Person Training
No answers on this topic
Trainer was patient and thorough in going through the basics and willing to answer questions by email after the initial training
Read full review
Implementation Rating
Providing that you have the client's needs well known, creating BI content using Dundas BI is a walk in the park!
Read full review
Just like any other implementation: When designing the differing reports, get end users' input, make sure to design the reports so that they display the information that the company requires, in the best and clearest way possible.
Test, test, test, revise when needed, and, particularly, do sufficient training so users are comfortable using Crystal Reports!
Read full review
Alternatives Considered
We have tested Tableau prior to Dundas BI and though Tableau is a great package in itself, Dundas BI is much more cost-effective for our needs and requirements and hence zeroed in on Dundas BI. We have also tried microstrategy but it has a very dated UI and doesn't suit our needs in today's more modern world
Read full review
For standard pixel perfect reporting, our company still uses Crystal Reports. It allows us to continually provide standard reporting to our clients. For dashboards, we are moving towards Microsoft Power BI. Power BI allows similar collaboration, but generally has better features for dashboards. Power BI also allows us to publish multiple reports and dashboards into a single app for our end users.
Read full review
Return on Investment
  • Coming from an SQL based standard delivery model, Dundas BI has provided a fantastic rate of ROI.
  • The preparation and delivery time has reduced from weeks to just a few hours.
Read full review
  • Time and cost savings achieved by automation of report creating across many data sources we maintain.
  • The ability to drill down into granular details of the data leads to a better understanding of the business procedures.
  • Well-presented reports are invaluable for getting new clients on board.
Read full review
ScreenShots

Logi Symphony Screenshots

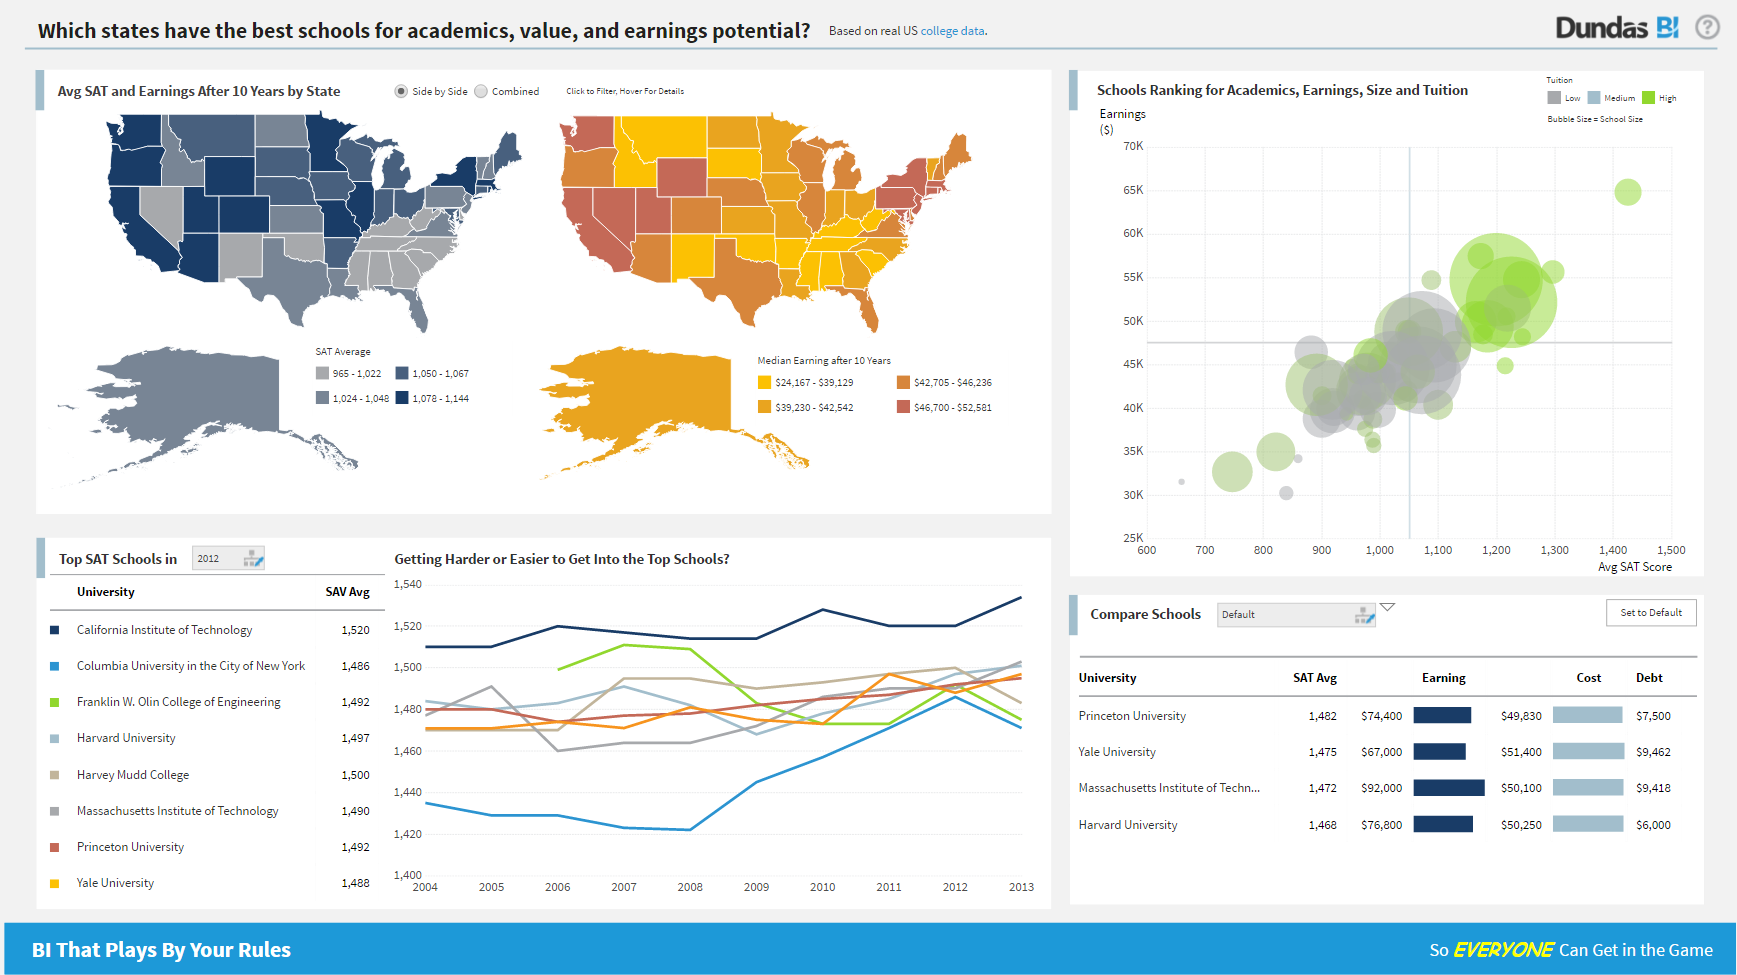
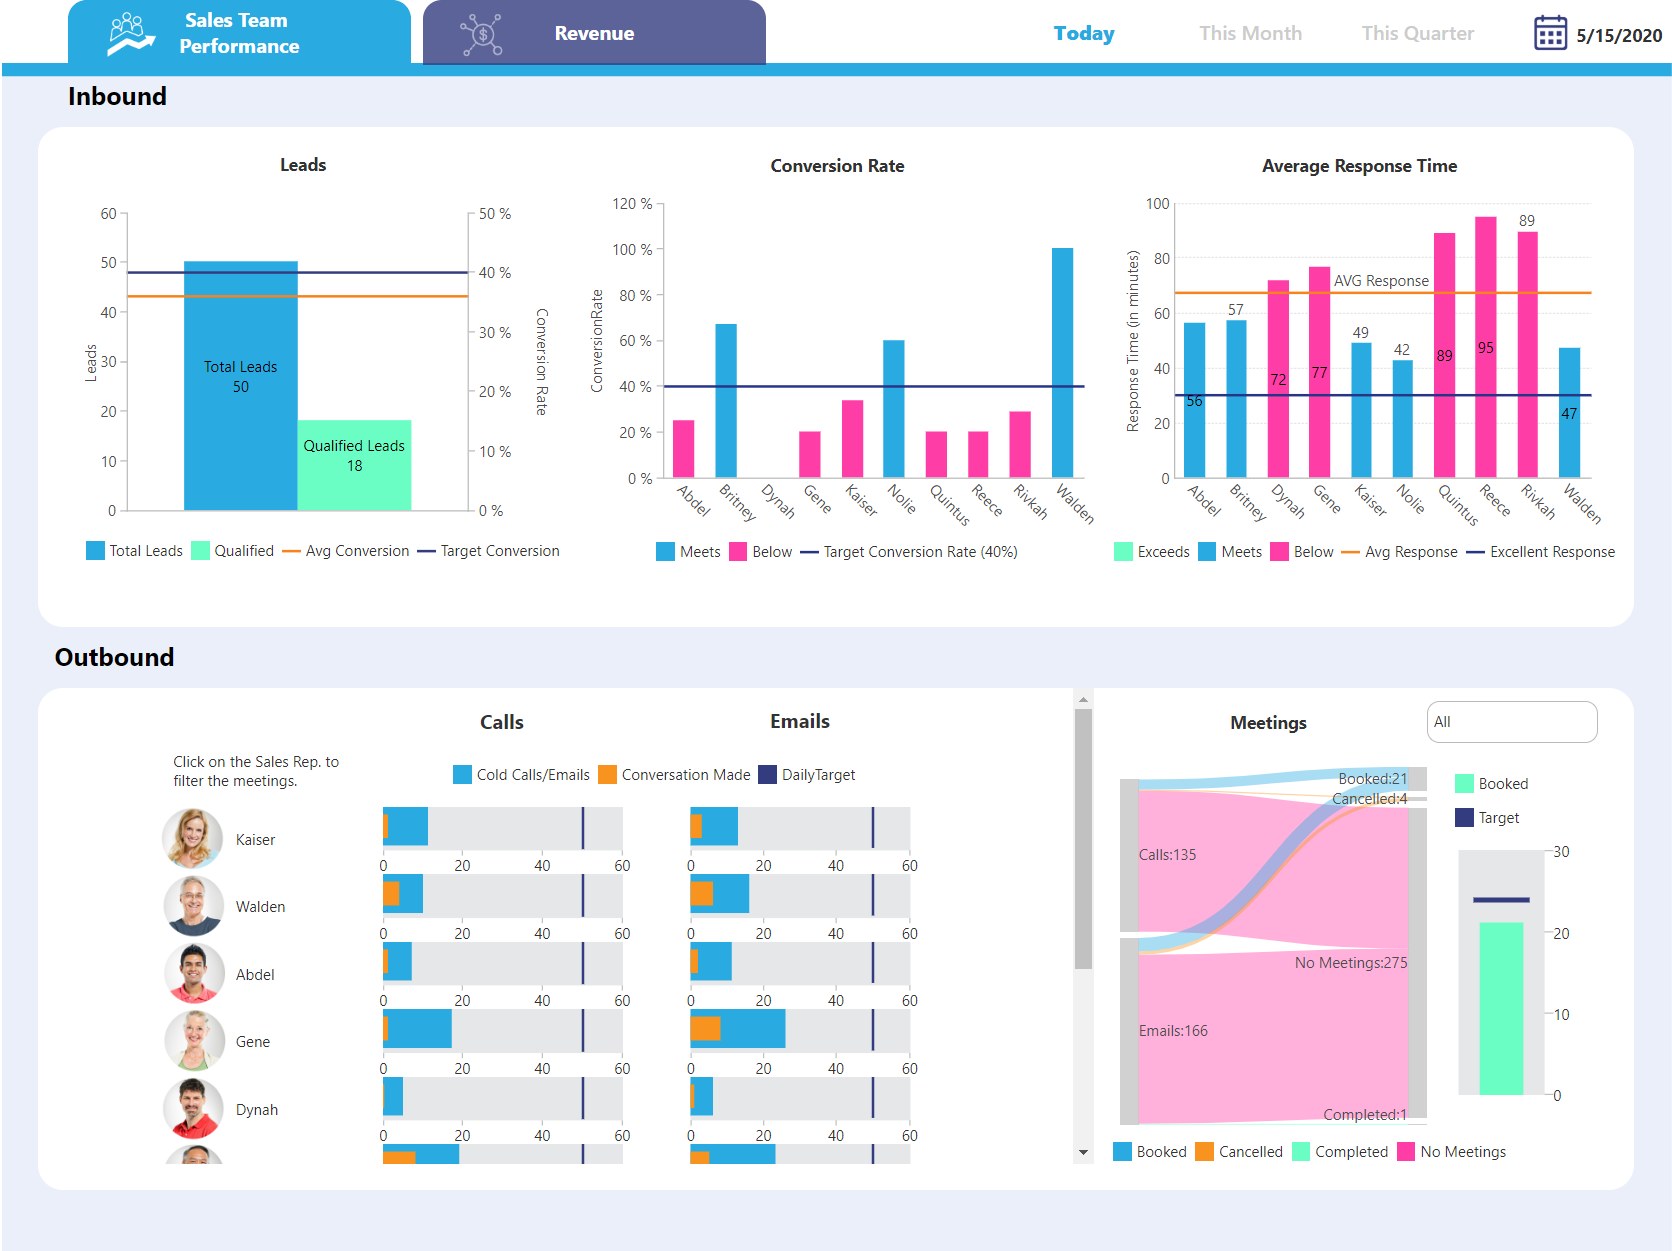
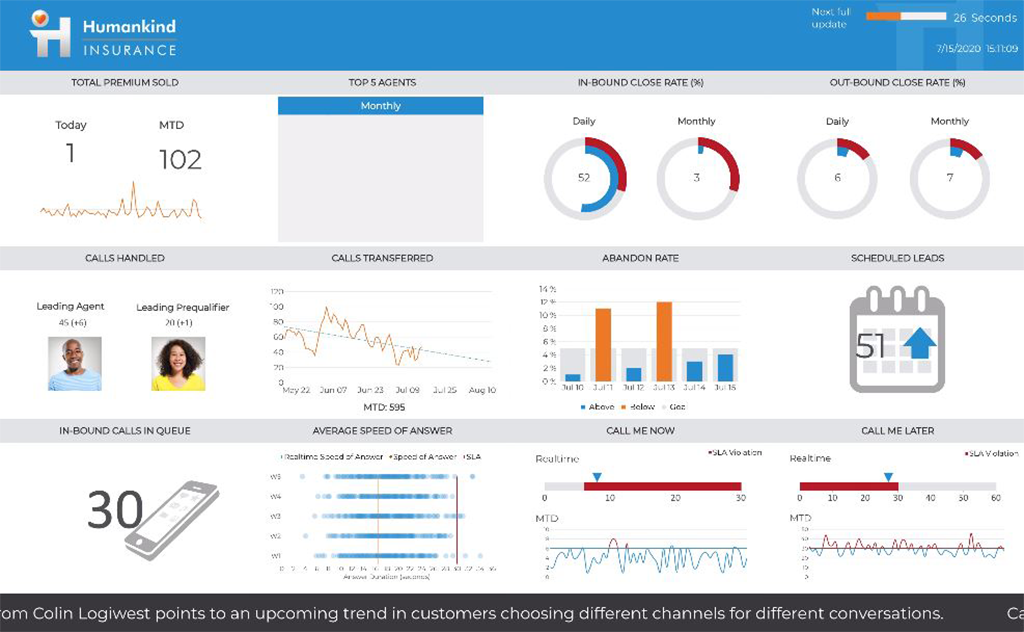
Screenshot of Dundas BI Dashboard Sample - EducationScreenshot of Dundas BI Dashboard Sample - Sales Team PerformanceScreenshot of Dundas BI Dahsboard Sample - Sales PerformanceScreenshot of Dundas BI Dashboard Sample - InsuranceScreenshot of Dundas BI Dashboard Sample - EmbeddedScreenshot of Dundas BI Dashboard Sample - Sales and Marketing

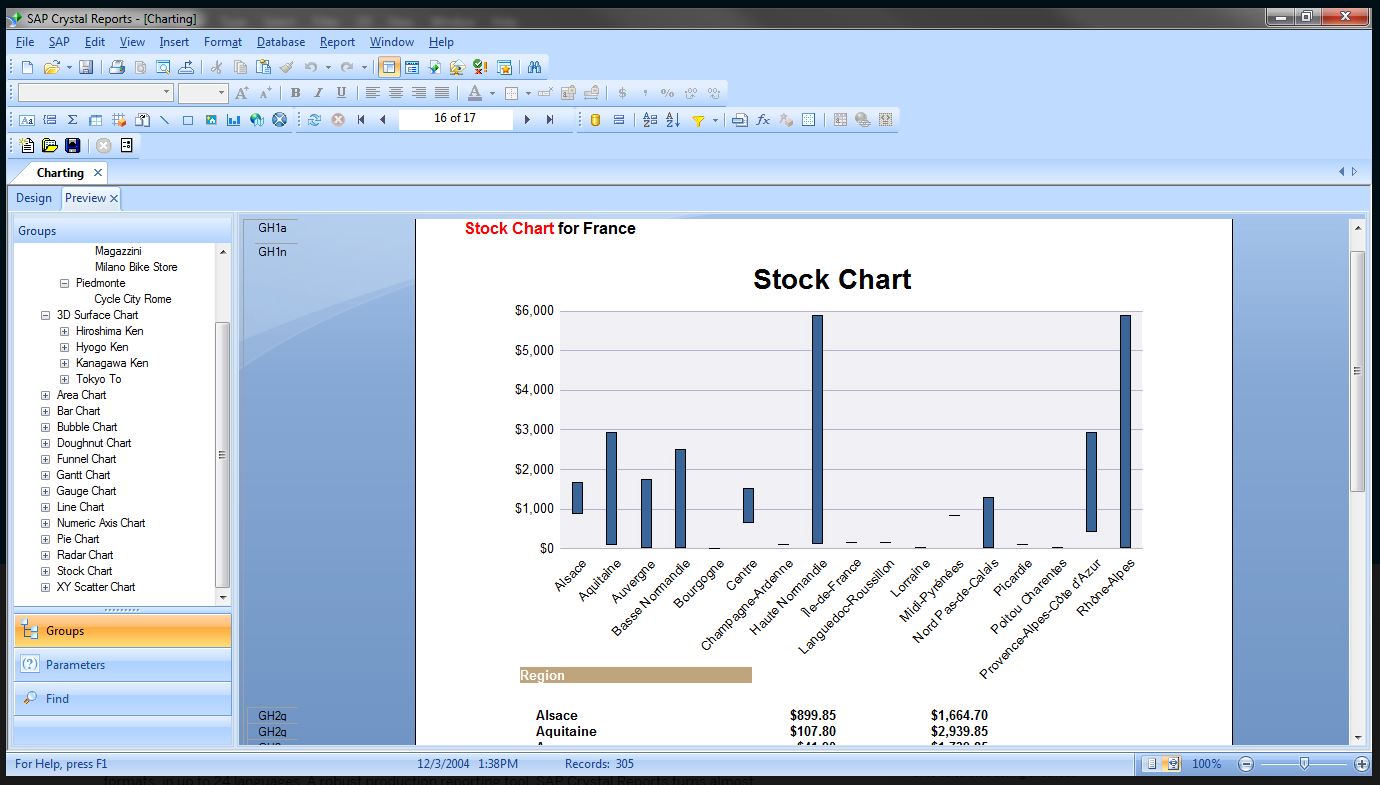
SAP Crystal Screenshots

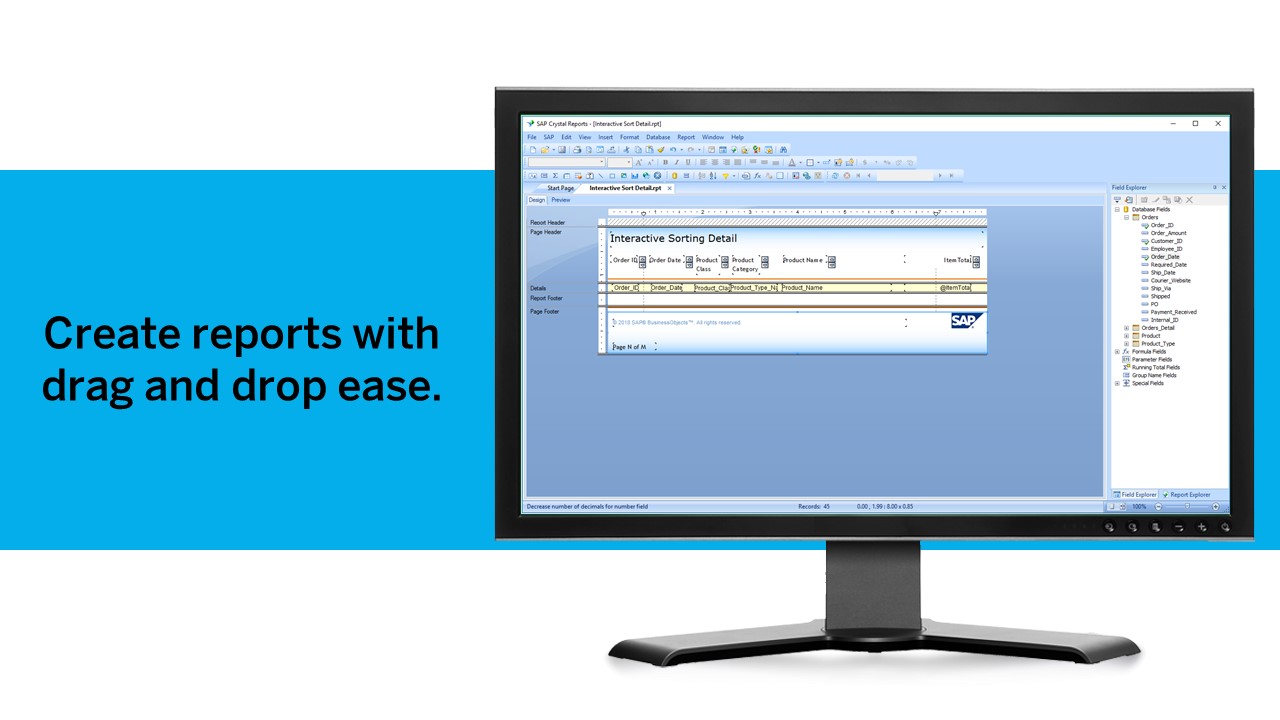
Screenshot of Pixel-perfect reporting solutionScreenshot of Refresh with a clickScreenshot of Build pixel-perfect documentsScreenshot of Connect to all data sourcesScreenshot of Use drag and dropScreenshot of Build interactive reports