LiveAction’s LiveNX is a network performance monitoring and analytics platform. It supports packet-level, network-wide visibility and proactive alerts. It can be deployed on-premise, virtually, or in the cloud.
N/A
PingPlotter
Score 9.3 out of 10
N/A
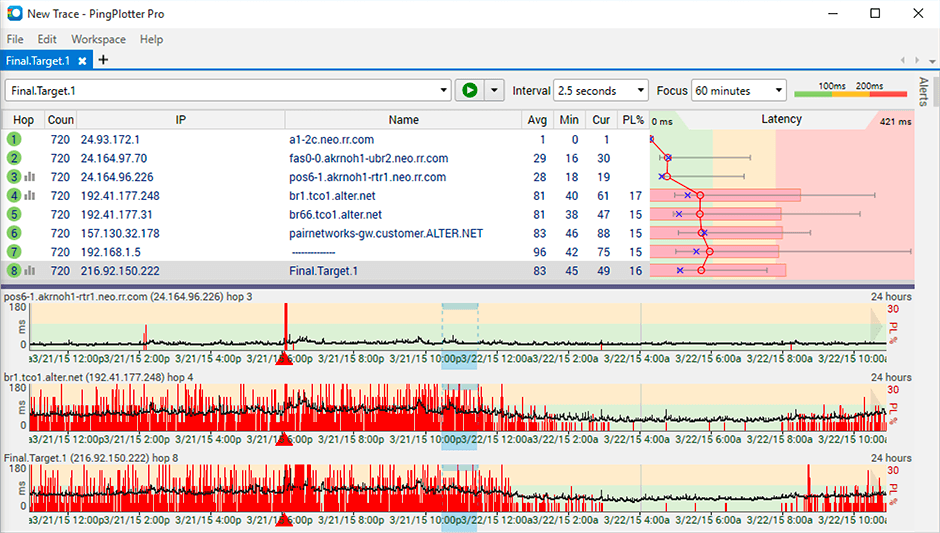
PingPlotter is a graphical traceroute and ping tool that visualizes network performance in a way that makes identifying the source of problems quicker and easier for everyone from online gamers and video streamers to VoIP admins and IT pros. Features for remote deployment, network monitoring, scripting, and a web interface are included along with several additional capabilities.
$0
per user
Pricing
LiveAction
PingPlotter
Editions & Modules
No answers on this topic
PingPlotter Free
$0.00
per user
PingPlotter Free
$0.00
per user
PingPlotter Standard
$6.99
per user per month
PingPlotter Professional
$29.00
per user per month
PingPlotter Standard
$39.99
per user
PingPlotter Professional
$349.00
per user
Offerings
Pricing Offerings
LiveAction
PingPlotter
Free Trial
No
Yes
Free/Freemium Version
No
Yes
Premium Consulting/Integration Services
No
No
Entry-level Setup Fee
No setup fee
No setup fee
Additional Details
—
—
More Pricing Information
Community Pulse
LiveAction
PingPlotter
Features
LiveAction
PingPlotter
Network Performance Monitoring
Comparison of Network Performance Monitoring features of Product A and Product B
The product is best suited for performing assessments on your network infrastructure via data and voice over IP flows. Finding bandwidth hogs is also easy to do with the product (Similar to Plixer's Scrutinizer product), and permits point-and-click remediation of Quality of Service (QOS), layer2/3 transit problems, and security issues.
The best scenario and best results are seen when the path does not reuse the same device for the "next hop". It is less well suited in situations where the path is being tricked by the re-use of devices for the next interface. This is seen required in many networks where the proper type of connection is not on an end device and the core device is used to provide a fiber to copper sort of "pass-through" connection.
Its a little confusing to see which targets are currently running pings and which ones are displayed in the plots.
Starting and stopping pings requires a right click and that would be better with a play/pause button I think.
Ability to drag and drop the graphs to reorder them.
more columns to show which targets are running and which are displayed. Currently this is done with symbols so you cant sort by just the running targets for example I've found.
I installed it and it just started working. I realized I could then tweak it to show what I needed but didn't have to spend a long time configuring it before use, editing YAML files etc. Maybe that's fine for a network professional, but I only need this software if something goes wrong, and then need it to work quickly out of the box.
Can't really rate this, we never had to call support. The product wasn't complicated to setup and learn. We have a high level of network knowledge so the product was self-explanatory.
I have not had much contact with the PingPlotter support, only one time have I went to them and it was a positive experience. The questions I had were answered quickly and professionally. I have no issue with the experience I had with the Support team. This was from before and after the purchase of the product.
Compared to ExtraHop it lacked the network analytics that compares data from an L2 up. We were able to track down rogue devices. certificates, a DNS attack, etc. that would have been a little hard to do in LiveAction. On the flip side, compared to PRTG, LiveAction has many more features that PRTG is lacking. The reporting, actions and visual analytics alone were better.
PingPlotter has better visualizations and a stronger ability to capture historical data than other tools I've used. This makes it easier to find the root cause by looking back in the log data to find where latency or packet loss occurred.