Klipfolio is a customizable dashboard and reporting platform that provides real-time business insights. It is used by small to mid-sized businesses and agencies to track performance metrics and create tailored reports, and to consolidate, transform, and visualize data.
$90
per month
Qlik Sense
Score 7.4 out of 10
N/A
Qlik Sense® is a self-service BI platform for data discovery and visualization. It supports a full range of analytics use cases—data governance, pixel-perfect reporting, and collaboration. Its Associative Engine indexes and connects relationships between data points for creating actionable insights.
$200
per month
Pricing
Klipfolio Klips
Qlik Sense
Editions & Modules
Base
$90
per month
Grow
$190
per month
Team
$350
per month
Starter
$200
per month
Standard
$825
per month
Premium
$2,750
per month
Qlik Sense Enterprise on Windows
Contact Sales
Enterprise
Custom Quote
Offerings
Pricing Offerings
Klipfolio Klips
Qlik Sense
Free Trial
Yes
No
Free/Freemium Version
No
No
Premium Consulting/Integration Services
No
No
Entry-level Setup Fee
Optional
No setup fee
Additional Details
Discount available for annual pricing. There are various implementation and training options available, from a 60 Day Proof of Concept, to Onboarding & Training, or ongoing dedicated Data Hero support.
—
More Pricing Information
Community Pulse
Klipfolio Klips
Qlik Sense
Features
Klipfolio Klips
Qlik Sense
BI Standard Reporting
Comparison of BI Standard Reporting features of Product A and Product B
Klipfolio Klips
9.0
Ratings
7% above category average
Qlik Sense
8.5
Ratings
4% above category average
Pixel Perfect reports
9.10 Ratings
8.30 Ratings
Customizable dashboards
8.90 Ratings
8.90 Ratings
Report Formatting Templates
9.10 Ratings
8.20 Ratings
Ad-hoc Reporting
Comparison of Ad-hoc Reporting features of Product A and Product B
Klipfolio Klips
8.6
Ratings
8% above category average
Qlik Sense
8.6
Ratings
7% above category average
Drill-down analysis
8.30 Ratings
8.90 Ratings
Formatting capabilities
7.80 Ratings
8.20 Ratings
Integration with R or other statistical packages
9.10 Ratings
8.40 Ratings
Report sharing and collaboration
9.10 Ratings
9.00 Ratings
Report Output and Scheduling
Comparison of Report Output and Scheduling features of Product A and Product B
Klipfolio Klips
9.4
Ratings
11% above category average
Qlik Sense
8.8
Ratings
6% above category average
Publish to Web
8.90 Ratings
8.80 Ratings
Publish to PDF
9.20 Ratings
8.80 Ratings
Report Delivery Scheduling
10.00 Ratings
8.80 Ratings
Report Versioning
00 Ratings
8.80 Ratings
Delivery to Remote Servers
00 Ratings
8.80 Ratings
Data Discovery and Visualization
Comparison of Data Discovery and Visualization features of Product A and Product B
It's a piece of software that's capable of almost anything. Dynamic variables can be changed in real-time via the interface's UI/UX and UI/UX customizations. As a result, it can always keep its database up-to-date and obtain the most current information from a variety of sources. The Klip customer service team is extremely friendly and helpful. Every time a problem with the Klip setup arises, they're there to help. As a result of their activities, they try to work with the group's experience.
Qlik Sense is a program whose purpose is to greatly improve all your operations and use of all data in an organic way. The mission will always be to increase the economic and commercial processes of the company in a short time. I recommended it for its high technology, which was Created for this area, the results are successful. We have noticed how it has increased relationships with our clients thanks to the credibility and security that we provide.
Dashboard design. Super simple and easy to set up, move and size components, and display.
Klip creation. This is report/chart creation. Klipfolio straddles the line well between ease-of-use and robust capability for data crunching and visualization.
Data sync. I have had very few data sync issues. The sync just works and it is very light-weight on API calls.
Multiple data source formats. You can make data sources in JSON, Summarized View, and Detailed View.
Modeled data sources. You can create modeled versions of any data source, which allows you to lock in data formats, add columns (including formula columns), and more.
Team permissions. I have been able to set team permission sets and use that to display the given dashboards around the office. With this, I can control who has access to which data.
Chart options. There is a great selection of chart types to choose from.
Great support. Their support staff has always been very responsive—almost always immediate. I have always been able to resolve my issues with them.
Onboarding. The process of setting up a new client for a dashboard can be a little tedious.
File size upload and third-party integrations. I have been limited to the size of the .csv file we were uploading but we were able to find a workaround.
Not a lot of room for customization as we were used to in QlikView
UI and default navigation can be very clunky and not user friendly
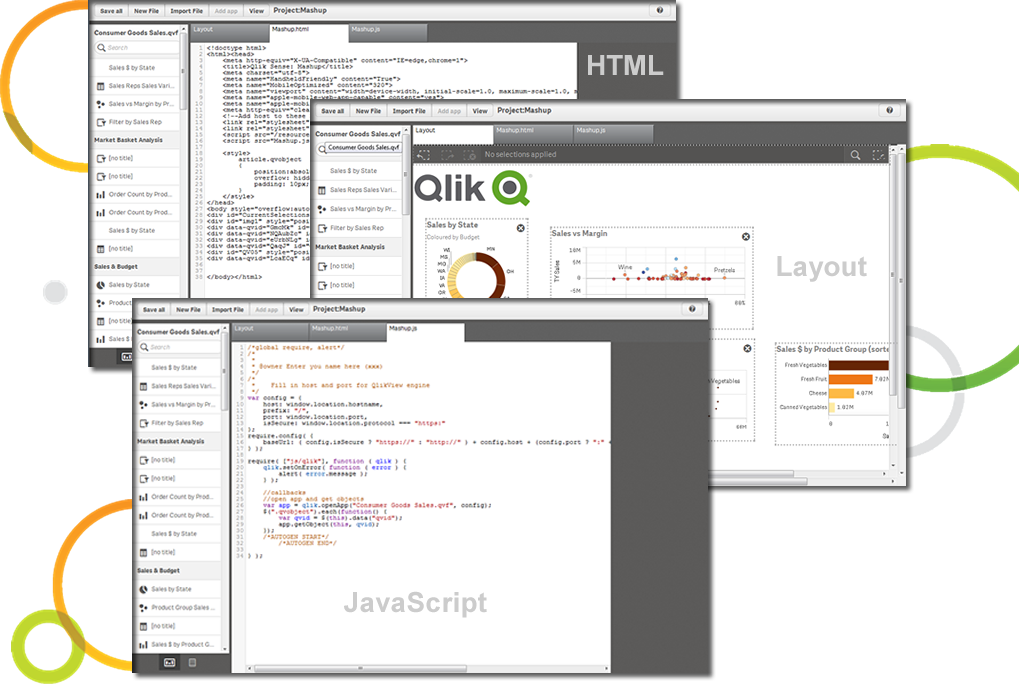
Although the backend is fantastic, the front end experience leaves a lot to be desired. As a developer you don't have a lot of options to customized your app unless you turn to Javascript, CSS and HTML. This is not a common stack you would find in most BI developers
Qlik Sense is a constantly improving it's software and working with its' users to make it better. They are great at keeping their users informed of progress and care about delivering a quality product
My initial impressions of the software have been extremely positive. There are YouTube tutorials that explain how to make klips. The intuitive design of the UI It appears that everything in this software has been thoroughly tested to create all the visualizations that can be imagined as well as the user input controls that allow users to have exactly the data they want to be displayed in seconds, considering the various functions and formulas available in the Excel integrations and the extensive list of other services that can be integrated.
Qlik Sense has a better and easy to learn user interface compared with other analytics tool which always help us to create regular and adhoc reports within the stipulated time frame and can be easily refreshed at a scheduled time and sent to multiple stakeholders for timely update regarding the Key metrics indicator.
It provides all the necessary information to be able to carry out the analysis of any type of business, to know how money is managed virtually, what to do to have greater visibility, in addition to being a platform that is always accessible and allows continuous and efficient work.
Not only can you ask the support team for help, but you can also ask the community. Also with the community there is a vast amount of problems that have already been solved. The problem you are encountering has a likely chance of already being discussed and even solved in the community section saving you time from reaching out.
It was clear that Klipfolio had the edge in terms of the number of third-party connectors and templates available, allowing us to quickly be up and running with various API integrations and visually stunning designs in only an hour. It was a no-brainer for us, and we're glad we went with them instead of the other options.
The customization of the platform opens up plenty of other options depending on the use cases. The API layer is incredibly rich and makes integration of Qlik based visualization into web pages a simple and effective pattern. It's been very easy to use with a great community made up of professionals. Qlik Sense has introduces artificial Intelligence into my data visualization and reporting activity.
Klipfolio not only delivers great-looking dashboards, but it makes our agency look awesome to our clients!
Klipfolio is one of the few platforms that we have implemented where the minimal investment has consistently provided maximum results in the return on our investment.
Not only had Klipfolio proven to be a fiscally smart - money-saving - move, but has also proven to be a great time saver as well.
Thanks to Klipfolio we spend less time having to pull data and have more time to analyze and strategize for our reporting and recommendations to our clients.
The impact has undoubtedly been positive, it is difficult to quantify it, however in terms of effectiveness or efficiency I give it a 90%.
I don't give it 100% because to use the complete package you have to pay, and it's not that cheap and on the other hand because it has some deficiencies, such as technical support and some issues like windows that are not so friendly and easy to work with.