JMP® is statistical analysis software with capabilities that span from data access to advanced statistical techniques, with click of a button sharing. The software is interactive and visual, and statistically deep enough to allow users to see and explore data.
$1,320
per year per user
Powerslide
Score9.5 out of 10
N/A
Created in 2019, Powerslide is a data storytelling and data visualization solution. This software helps business users to create usages around data. Powerslide is a solution for data analysis, visualization and presentation. Interactive and collaborative, Powerslide aims to answer data issues in a simple, practical and design interface, and help users simplify the analysis and communication of…
N/A
Pricing
JMP
Powerslide
Editions & Modules
JMP
$1320
per year per user
No answers on this topic
Offerings
Pricing Offerings
JMP
Powerslide
Free Trial
Yes
Yes
Free/Freemium Version
No
No
Premium Consulting/Integration Services
No
No
Entry-level Setup Fee
No setup fee
Optional
Additional Details
Bulk discounts available.
Our rates are flexible and adapt to the size and use of your organization. Contact us and let’s discuss about it.
It is perfectly suited for statistical analyses, but I would not recommend JMP for users who do not have a statistical background. As previously stated, the learning curve is exceptionally steep, and I think that it would prove to be too steep for those without statistical background/knowledge
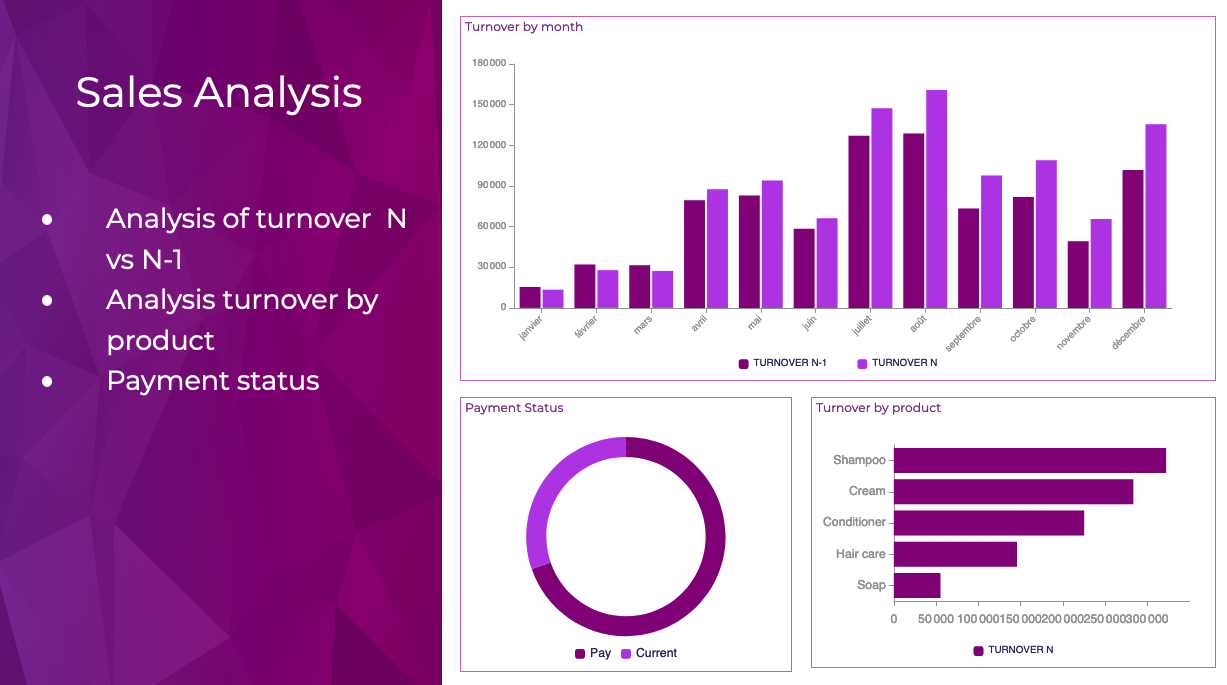
It has allowed us as an organization to clearly deliver our numbers to our collaborators, but above all to the heads of our teams and company. Not being entirely professional, it is easy to use for someone who does not understand the function of these numbers or hard data.
A de minimis incentive was given to thank the reviewer for their time. The incentive was not used to bias or drive a particular response, nor was the incentive contingent on a positive endorsement. More Info
JMP is designed from the ground-up to be a tool for analysts who do not have PhDs in Statistics without in anyway "dumbing down" the level of statistical analysis applied. In fact, JMP operationalizes the most advanced statistical methods. JMP's design is centred on the JMP data table and dialog boxes. It is data focused not jargon-focussed. So, unlike other software where you must choose the correct statistical method (eg. contingency, ANOVA, linear regression, etc.), with JMP you simply assign the columns in a dialog into roles in the analysis and it chooses the correct statistical method. It's a small thing but it reflects the thinking of the developers: analysts know their data and should only have to think about their data. Analyses should flow from there.
JMP makes most things interactive and visual. This makes analyses dynamic and engaging and obviates the complete dependence on understanding p-values and other statistical concepts(though they are all there) that are often found to be foreign or intimidating.
One of the best examples of this is JMP's profiler. Rather than looking at static figures in a spreadsheet, or a series of formulas, JMP profiles the formulas interactively. You can monitor the effect of changing factors (Xs) and see how they interact with other factors and the responses. You can also specify desirability (maximize, maximize, match-target) and their relative importances to find factor settings that are optimal. I have spent many lengthy meetings working with the profiler to review design and process options with never a dull moment.
The design of experiments (DOE) platform is simply outstanding and, in fact, the principal developers of it have won several awards. Over the last 15 years, using methods broadly known as an "exchange algorithm," JMP can create designs that are far more flexible than conventional designs. This means, for example, that you can create a design with just the interactions that are of interest; you can selectively choose those interactions that are not of interest and drop collecting their associated combinations.
Classical designs are rigid. For example, a Box-Benhken or other response surface design can have only continuous factors. What if you want to investigate these continuous factors along with other categorical factors such as different categorical variables such as materials or different furnace designs and look at the interaction among all factors? This common scenario cannot be handled with conventional designs but are easily accommodated with JMP's Custom DOE platform.
The whole point of DOE is to be able to look at multiple effects comprehensively but determine each one's influence in near or complete isolation. The custom design platform, because it produces uniques designs, provides the means to evaluate just how isolated the effects are. This can be done before collecting data because this important property of the DOE is a function of the design, not the data. By evaluating these graphical reports of the quality of the design, the analyst can make adjustments, adding or reducing runs, to optimize cost, effort and expected learnings.
Over the last number of releases of JMP, which appear about every 18 months now, they have skipped the dialog boxes to direct, drag-and-drop analyses for building graphs and tables as well as Statistical Process Control Charts. Interactivity such as this allows analysts to "be in the moment." As with all aspects of JMP, they are thinking of their subject matter without the cumbersomeness associated with having to think about statistical methods. It's rather like a CEO thinking about growing the business without having to think about every nuance and intricacy of accounting. The statistical thinking is burned into the design of JMP.
Without data analysis is not possible. Getting data into a situation where it can be analyzed can be a major hassle. JMP can pull data from a variety of sources including Excel spreadsheets, CSV, direct data feeds and databases via ODBC. Once the data is in JMP it has all the expected data manipulation capabilities to form it for analysis.
Back in 2000 JMP added a scripting language (JMP Scripting Language or JSL for short) to JMP. With JSL you can automate routine analyses without any coding, you can add specific analyses that JMP does not do out of the box and you can create entire analytical systems and workflows. We have done all three. For example, one consumer products company we are working with now has a need for a variant of a popular non-parametric analysis that they have employed for years. This method will be found in one of the menus and appear as if it were part of JMP to begin with. As for large systems, we have written some that are tens of thousands of lines that take the form of virtual labs and process control systems among others.
JSL applications can be bundled and distributed as JMP Add-ins which make it really easy for users to add to their JMP installation. All they need to do is double-click on the add-in file and it's installed. Pharmaceutical companies and others who are regulated or simply want to control the JMP environment can lock-down JMP's installation and prevent users from adding or changing functionality. Here, add-ins can be distributed from a central location that is authorized and protected to users world-wide.
JMP's technical support is second to none. They take questions by phone and email. I usually send email knowing that I'll get an informed response within 24 hours and if they cannot resolve a problem they proactively keep you informed about what is being done to resolve the issue or answer your question.
In general JMP is much better fit for a general "data mining" type application. If you want a specific statistics based toolbox, (meaning you just want to run some predetermined test, like testing for a different proportion) then JMP works, but is not the best. JMP is much more suited to taking a data set and starting from "square 1" and exploring it through a range of analytics.
The CPK (process capability) module output is shockingly poor in JMP. This sticks out because, while as a rule everything in JMP is very visual and presentable, the CPK graph is a single-line-on-grey-background drawing. It is not intuitive, and really doesn't tell the story. (This is in contrast with a capability graph in Minitab, which is intuitive and tells a story right off.) This is also the case with the "guage study" output, used for mulivary analysis in a Six Sigma project. It is not intuitive and you need to do a lot of tweaking to make the graph tell you the story right off. I have given this feedback to JMP, and it is possible that it will be addressed in future versions.
I've never heard of JMP allowing floating licenses in a company. This will ALWAYS be a huge sticking point for small to middle size companies, that don't have teams people dedicated to analytics all day. If every person that would do problem solving needs his/her own seat, the cost can be prohibitive. (It gets cheaper by the seat as you add licenses, but for a small company that might get no more than 5 users, it is still a hard sell.)
A de minimis incentive was given to thank the reviewer for their time. The incentive was not used to bias or drive a particular response, nor was the incentive contingent on a positive endorsement. More Info
JMP has been good at releasing updates and adding new features and their support is good. Analytics is quick and you don't need scripting/programming experience. It has been used organization wide, and works well in that respect. Open source means that there are concerns regarding timely support. Cheap licensing and easy to maintain.
The GUI interface makes it easier to generate plots and find statistics without having to write code. The JSL scripting is a bit of a steep learning curve but does give you more ability to customize your analysis. Overall, I would recommend JMP as a good product for overall usability.
A de minimis incentive was given to thank the reviewer for their time. The incentive was not used to bias or drive a particular response, nor was the incentive contingent on a positive endorsement. More Info
Support is great and give ease of contact, rapid response, and willingness to 'stick to the task' until resolution or acknowledgement that the problem would have to be resolved in a future build. Basically, one gets the very real sense that another human being is sensitive to your problems - great or small.
A de minimis incentive was given to thank the reviewer for their time. The incentive was not used to bias or drive a particular response, nor was the incentive contingent on a positive endorsement. More Info
MS Excel with AnalysisToolPak provides a home-grown solution, but requires a high degree of upkeep and is difficult to hand off. Minitab is the closes competitor, but JMP is better suited to the production environment, roughly equivalent in price, and has superior support.
A de minimis incentive was given to thank the reviewer for their time. The incentive was not used to bias or drive a particular response, nor was the incentive contingent on a positive endorsement. More Info
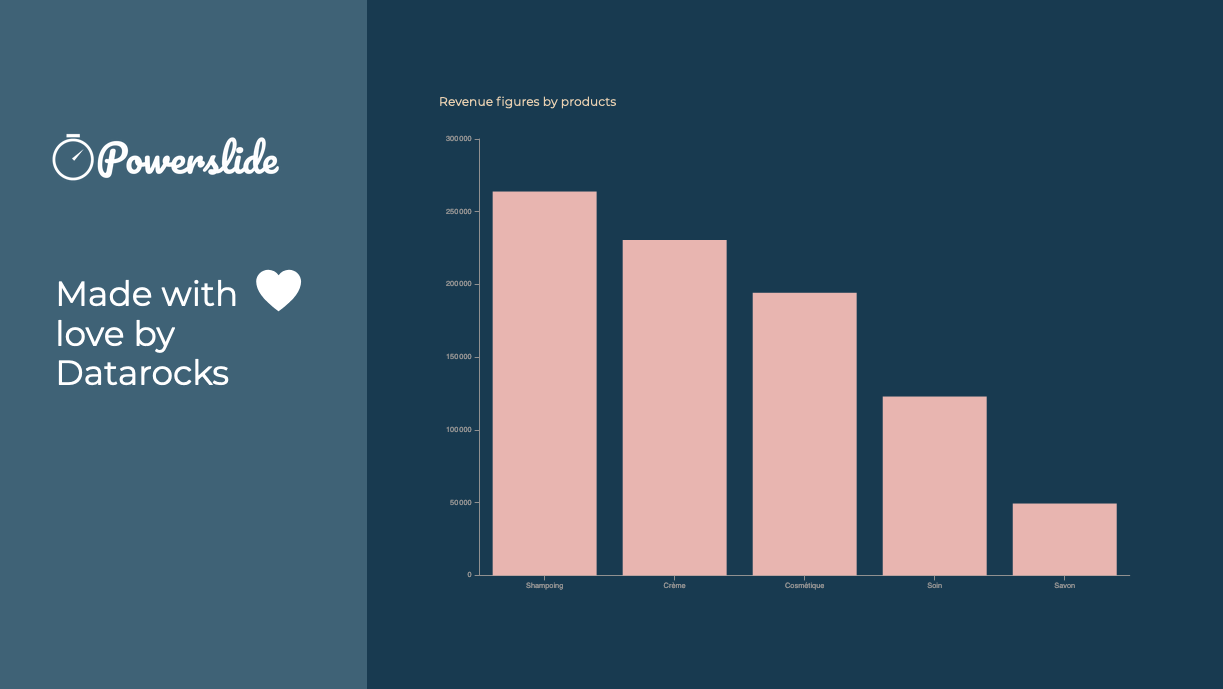
Powerslide stands out for having templates that help you easily organize hard data and more delicate information such as numbers and statistics. By having many ways to present and edit it in one place, it makes this a page with variety and empathy with its user.
A de minimis incentive was given to thank the reviewer for their time. The incentive was not used to bias or drive a particular response, nor was the incentive contingent on a positive endorsement. More Info
ROI: Even if the cost can be high, the insights you get out of the tool would definitely be much more valuable than the actual cost of the software. In my case, most of the results of your analysis were shown to the client, who was blown away, making the money spent well worth for us.
Potential negative: If you are not sure your team will use it, there's a chance you will just waste money. Sometimes the IT department (usually) tries to deploy a better tool for the entire organization but they keep using the old tool they are used too (most likely MS Excel).
A de minimis incentive was given to thank the reviewer for their time. The incentive was not used to bias or drive a particular response, nor was the incentive contingent on a positive endorsement. More Info
Our collaborators do not get bored in meetings and even if it is a lot of information, seeing it in an interesting design makes them pay attention and like to be informed of the numbers they manage to obtain with their work.
A de minimis incentive was given to thank the reviewer for their time. The incentive was not used to bias or drive a particular response, nor was the incentive contingent on a positive endorsement. More Info