Jama Analyze (Discontinued) vs. Microsoft Power BI

Overview
ProductRatingMost Used ByProduct SummaryStarting Price
Jama Analyze (Discontinued)
Score 8.0 out of 10
Mid-Size Companies (51-1,000 employees)
Jama Analyze (formerly called Notion) was a solution for quickly creating shareable, custom dashboards. However, the product is no longer available. Jama Software sunset the Analyze product in 2019. Some of the benefits of Jama Analyze included the ability to: Create custom metrics across all teams with data from any source with the intuitive metric builder. Experience self-serve BI with no coding and no IT to get started making custom dashboards.…
$23
per month
Microsoft Power BI
Score 8.5 out of 10
N/A
Microsoft Power BI is a visualization and data discovery tool from Microsoft. It allows users to convert data into visuals and graphics, visually explore and analyze data, collaborate on interactive dashboards and reports, and scale across their organization with built-in governance and security.N/A
Pricing
Jama Analyze (Discontinued)Microsoft Power BI
Editions & Modules
Starter Teams - 2 users
$23
per month
Small Teams - 5 users
$89
per month
Growing Teams - 10 users
$179
per month
Growing Teams - 15 users
$259
per month
Growing Teams - 20 users
$339
per month
No answers on this topic
Offerings
Pricing Offerings
Jama Analyze (Discontinued)Microsoft Power BI
Free Trial
YesYes
Free/Freemium Version
NoYes
Premium Consulting/Integration Services
NoNo
Entry-level Setup FeeNo setup feeNo setup fee
Additional Details
More Pricing Information
Community Pulse
Jama Analyze (Discontinued)Microsoft Power BI
Features
Jama Analyze (Discontinued)Microsoft Power BI
BI Standard Reporting
Comparison of BI Standard Reporting features of Product A and Product B
Jama Analyze (Discontinued)
9.3
Ratings
13% above category average
Microsoft Power BI
8.8
Ratings
8% above category average
Pixel Perfect reports9.00 Ratings8.50 Ratings
Customizable dashboards10.00 Ratings10.00 Ratings
Report Formatting Templates9.00 Ratings8.00 Ratings
Ad-hoc Reporting
Comparison of Ad-hoc Reporting features of Product A and Product B
Jama Analyze (Discontinued)
8.0
Ratings
1% below category average
Microsoft Power BI
8.2
Ratings
2% above category average
Report sharing and collaboration8.00 Ratings9.00 Ratings
Drill-down analysis00 Ratings7.00 Ratings
Formatting capabilities00 Ratings9.00 Ratings
Integration with R or other statistical packages00 Ratings8.00 Ratings
Report Output and Scheduling
Comparison of Report Output and Scheduling features of Product A and Product B
Jama Analyze (Discontinued)
7.0
Ratings
17% below category average
Microsoft Power BI
8.6
Ratings
3% above category average
Publish to Web7.00 Ratings8.00 Ratings
Report Versioning7.00 Ratings9.00 Ratings
Publish to PDF00 Ratings9.00 Ratings
Report Delivery Scheduling00 Ratings8.00 Ratings
Delivery to Remote Servers00 Ratings9.00 Ratings
Data Discovery and Visualization
Comparison of Data Discovery and Visualization features of Product A and Product B
Jama Analyze (Discontinued)
10.0
Ratings
23% above category average
Microsoft Power BI
8.7
Ratings
9% above category average
Pre-built visualization formats (heatmaps, scatter plots etc.)10.00 Ratings9.00 Ratings
Location Analytics / Geographic Visualization00 Ratings8.00 Ratings
Predictive Analytics00 Ratings9.00 Ratings
Pattern Recognition and Data Mining00 Ratings9.00 Ratings
Access Control and Security
Comparison of Access Control and Security features of Product A and Product B
Jama Analyze (Discontinued)
7.7
Ratings
10% below category average
Microsoft Power BI
8.6
Ratings
1% above category average
Multi-User Support (named login)8.00 Ratings9.00 Ratings
Role-Based Security Model7.00 Ratings9.00 Ratings
Multiple Access Permission Levels (Create, Read, Delete)8.00 Ratings10.00 Ratings
Report-Level Access Control00 Ratings7.00 Ratings
Single Sign-On (SSO)00 Ratings8.30 Ratings
Mobile Capabilities
Comparison of Mobile Capabilities features of Product A and Product B
Jama Analyze (Discontinued)
6.5
Ratings
19% below category average
Microsoft Power BI
8.0
Ratings
2% above category average
Responsive Design for Web Access7.00 Ratings8.00 Ratings
Dashboard / Report / Visualization Interactivity on Mobile6.00 Ratings7.70 Ratings
Mobile Application00 Ratings7.70 Ratings
Application Program Interfaces (APIs) / Embedding
Comparison of Application Program Interfaces (APIs) / Embedding features of Product A and Product B
Jama Analyze (Discontinued)
6.0
Ratings
26% below category average
Microsoft Power BI
8.4
Ratings
8% above category average
REST API6.00 Ratings8.00 Ratings
Javascript API00 Ratings9.90 Ratings
iFrames00 Ratings8.00 Ratings
Java API00 Ratings8.00 Ratings
Themeable User Interface (UI)00 Ratings8.10 Ratings
Customizable Platform (Open Source)00 Ratings8.40 Ratings
Best Alternatives
Jama Analyze (Discontinued)Microsoft Power BI
Small Businesses
BrightGauge
BrightGauge
Score 9.1 out of 10
BrightGauge
BrightGauge
Score 9.1 out of 10
Medium-sized Companies
Reveal
Reveal
Score 10.0 out of 10
Reveal
Reveal
Score 10.0 out of 10
Enterprises
Kyvos Semantic Intelligence Layer
Score 9.9 out of 10
Kyvos Semantic Intelligence Layer
Score 9.9 out of 10
All AlternativesView all alternativesView all alternatives
User Ratings
Jama Analyze (Discontinued)Microsoft Power BI
Likelihood to Recommend
8.0
(0 ratings)
8.5
(0 ratings)
Likelihood to Renew
-
(0 ratings)
9.0
(0 ratings)
Usability
-
(0 ratings)
7.9
(0 ratings)
Support Rating
-
(0 ratings)
10.0
(0 ratings)
Implementation Rating
-
(0 ratings)
9.0
(0 ratings)
User Testimonials
Jama Analyze (Discontinued)Microsoft Power BI
Likelihood to Recommend
The integration with JIRA is quite a handy tool to have. It allows for team progress to be easily tracked and visualized using the software while key metrics are brought to the forefront through the software's business intelligence. It makes presenting data and milestones achieved to non-technical management quite simple and can be extremely useful.
Read full review
Microsoft Power BI is great for sales tracking, financial reporting, and real-time operations monitoring. It integrates data from multiple sources, creating interactive dashboards for better decision-making. However, it's less ideal for real-time big data processing, offline access, or when deep customization is needed. It works best for structured reporting but struggles with highly complex data models.
Read full review
Pros
  • This allows us to keep track of our team's work by integrating with our product boards on JIRA.
  • It allows us to create visualized reports for our team's progress.
  • It allows us to gain insights about things that are going well in our product pipeline as well as potential areas of concern based on the data that is collected.
Read full review
  • It is great at taking in large amounts of data and housing it all.
  • Microsoft Power BI is so user friendly and it's dashboards are very easy on the eye.
  • The ease of sharing dashboards makes it great for use across a large company.
Read full review
Cons
  • The service tends to be slow at times and working offline can be a pain.
  • It has a bit of a learning curve when you start out.
  • The price is quite high for the features it offers.
Read full review
  • It would be easier for users could Microsoft Power BI and Excel used the same programming languages.
  • Would like to see the online version of Microsoft Power BI be as powerful as the desktop version.
  • Publishing a Microsoft Power BI file online and then having to save the file is somewhat redundant.
  • Would like to export each page or chart as an image.
Read full review
Likelihood to Renew
No answers on this topic
Microsoft Power BI is an excellent and scalable tool. It has a learning curve, but once you get past that, the sky is the limit and you can build from the most simple to the most complex dashboards. I have built everything from simple reports with only a few data points to complex reports with many pages and advanced filtering.
Read full review
Usability
No answers on this topic
Takes a little bit to get used to it. Not natively intuitive but fairly straight forward to pick up. Also docking it a few points because you can create a really clean, simple UI in Claude very quickly that's faster than building all of this yourself in Microsoft Power BI.
Read full review
Support Rating
No answers on this topic
It is a fantastic tool, you can do almost everything related with data and reports, it is a perfect substitutive of Power Point and Excel with a high evolution and flexibility, and also it is very friendly and easy to share. I think all companies should have Power BI (or other BI tool) in their software package and if they are in the MS Suite, for sure Power BI should be the one due to all the benefits of the MS ecosystem.
Read full review
Implementation Rating
No answers on this topic
It was integrated with our erp easily and was accessible on cloud.
Read full review
Alternatives Considered
Jama Analyze, as well as Asana, connect with JIRA to visualize milestone tracking and team progress. While Asana is cheaper, Jama Analyze provides better reports and visual data. Google Data Studio, through a bit of tinkering from your software development team, can achieve similar results, however, the charts and graphs leave a bit to be desired in terms of design. In all, Jama Analyze is great if you have few users and don't need to go for the licensing option. Otherwise, there are definitely cheaper options available but you may have to sacrifice on performance and look-and-feel.
Read full review
All others apps are enablers and Microsoft Power BI is the visual that end user sees which often adds more value to the end user to make strategic decisions from this. All are equally great but Microsoft Power BI is the end result
Read full review
Return on Investment
No answers on this topic
  • We're still early in the adoption process at this company, but we've illustrated how bad data keeps us from being more productive. ~25% of a team's work week was dedicated to effectively cleaning up entries, but it was always seen as a normal to them.
Read full review
ScreenShots

Jama Analyze (Discontinued) Screenshots

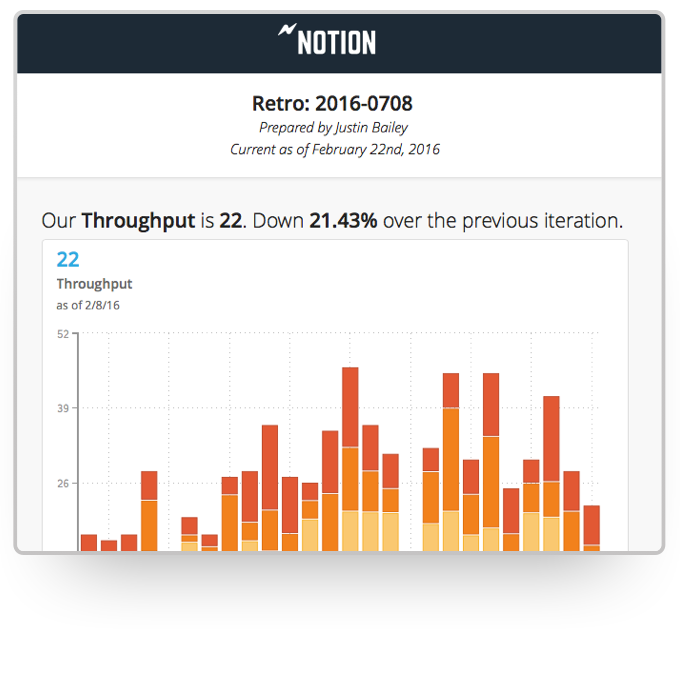
Screenshot of An example of a Notion dashboard with custom team metrics, a variety of visualizations, and summaries of the data at the top of each card.Screenshot of The Notion directory is where metrics from all your data sources live, making it easy to compare and combine. Give your team a single source of truth for the metrics that matter most.Screenshot of You can also assign metric ownership to members of your team. They'll got automatic reminders to report the data.Screenshot of Build custom metrics and quickly change how they're visualized or the reporting interval.Screenshot of Every metric has built-in commenting to help you capture context around the data.Screenshot of One click reporting means it's easy to share important team or product performance data with key stakeholders.

Microsoft Power BI Screenshots

Screenshot of Microsoft Power BI - Turns insights into impact for business usersScreenshot of Power BI integrates easily with Microsoft 365Screenshot of Microsoft Power BI - AI-Powered CapabilitiesScreenshot of Microsoft Power BI - Copilot can be used to create reportsScreenshot of Microsoft Power BI - Data HubScreenshot of Microsoft Power BI - Scales as organizational needs grow