
Izenda vs. Microsoft Power BI
Izenda vs. Microsoft Power BI
| Product | Rating | Most Used By | Product Summary | Starting Price |
|---|---|---|---|---|
 Izenda | Small Businesses (1-50 employees) | Izenda is a business intelligence software offering from Izenda. | N/A | |
 Microsoft Power BI | N/A | Microsoft Power BI is a visualization and data discovery tool from Microsoft. It allows users to convert data into visuals and graphics, visually explore and analyze data, collaborate on interactive dashboards and reports, and scale across their organization with built-in governance and security. | $10 per month per user |
| Izenda | Microsoft Power BI | |||||||||||||||
|---|---|---|---|---|---|---|---|---|---|---|---|---|---|---|---|---|
| Editions & Modules | No answers on this topic | No answers on this topic | ||||||||||||||
| Offerings |
| |||||||||||||||
| Entry-level Setup Fee | No setup fee | No setup fee | ||||||||||||||
| Additional Details | No per user or core fees, unlimited use licensing for production and non-production instances. | — | ||||||||||||||
| More Pricing Information | ||||||||||||||||
| Izenda | Microsoft Power BI |
|---|
| Izenda | Microsoft Power BI | |||||||||||||||||||||
|---|---|---|---|---|---|---|---|---|---|---|---|---|---|---|---|---|---|---|---|---|---|---|
| BI Standard Reporting |
| |||||||||||||||||||||
| Ad-hoc Reporting |
| |||||||||||||||||||||
| Report Output and Scheduling |
| |||||||||||||||||||||
| Data Discovery and Visualization |
| |||||||||||||||||||||
| Access Control and Security |
| |||||||||||||||||||||
| Mobile Capabilities |
| |||||||||||||||||||||
| Application Program Interfaces (APIs) / Embedding |
|
| Izenda | Microsoft Power BI | |
|---|---|---|
| Small Businesses |  BrightGauge Score 9.1 out of 10 | BrightGauge Score 9.1 out of 10 |
| Medium-sized Companies |  Reveal Score 10.0 out of 10 | Reveal Score 10.0 out of 10 |
| Enterprises |  Kyvos Semantic Intelligence Layer Score 9.9 out of 10 | Kyvos Semantic Intelligence Layer Score 9.9 out of 10 |
| All Alternatives | View all alternatives | View all alternatives |
| Izenda | Microsoft Power BI | |
|---|---|---|
| Likelihood to Recommend | 10.0 (2 ratings) | 8.5 (142 ratings) |
| Likelihood to Renew | - (0 ratings) | 9.0 (2 ratings) |
| Usability | 8.0 (1 ratings) | 7.9 (58 ratings) |
| Support Rating | 9.0 (1 ratings) | 10.0 (53 ratings) |
| Implementation Rating | - (0 ratings) | 9.0 (1 ratings) |
| Izenda | Microsoft Power BI | |
|---|---|---|
| Likelihood to Recommend | Izenda
 Nitish kumar System Engineer | Microsoft
|
| Pros | Izenda
| Microsoft
|
| Cons | Izenda
Nitish kumar System Engineer | Microsoft
|
| Likelihood to Renew | Izenda No answers on this topic | Microsoft
 David Jensen Operations Manager, Customer Success |
| Usability | Izenda
Nitish kumar System Engineer | Microsoft
|
| Support Rating | Izenda
Nitish kumar System Engineer | Microsoft
|
| Implementation Rating | Izenda No answers on this topic | Microsoft
 Anuj Sant Technical Supply chain professional Senior buyer |
| Alternatives Considered | Izenda
| Microsoft
|
| Return on Investment | Izenda
Nitish kumar System Engineer | Microsoft
|
| ScreenShots | Izenda Screenshots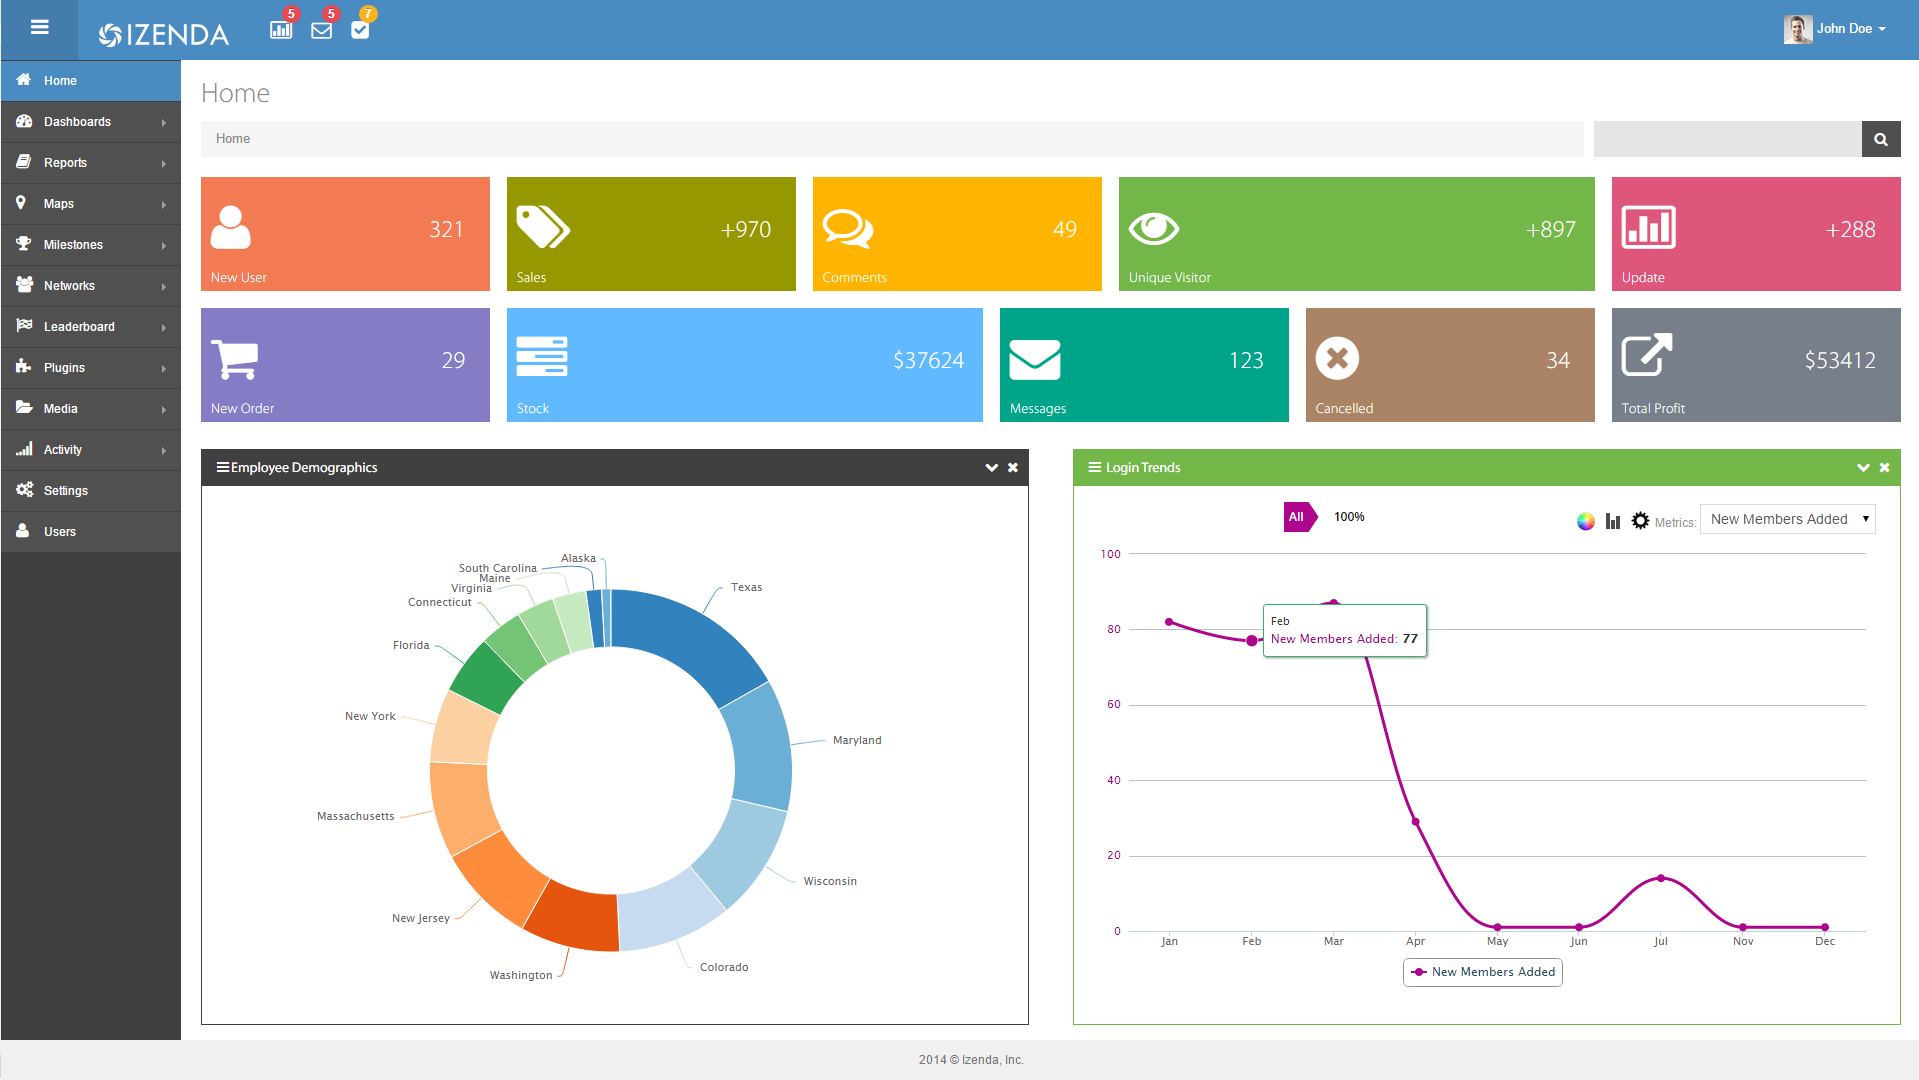    | Microsoft Power BI Screenshots      |