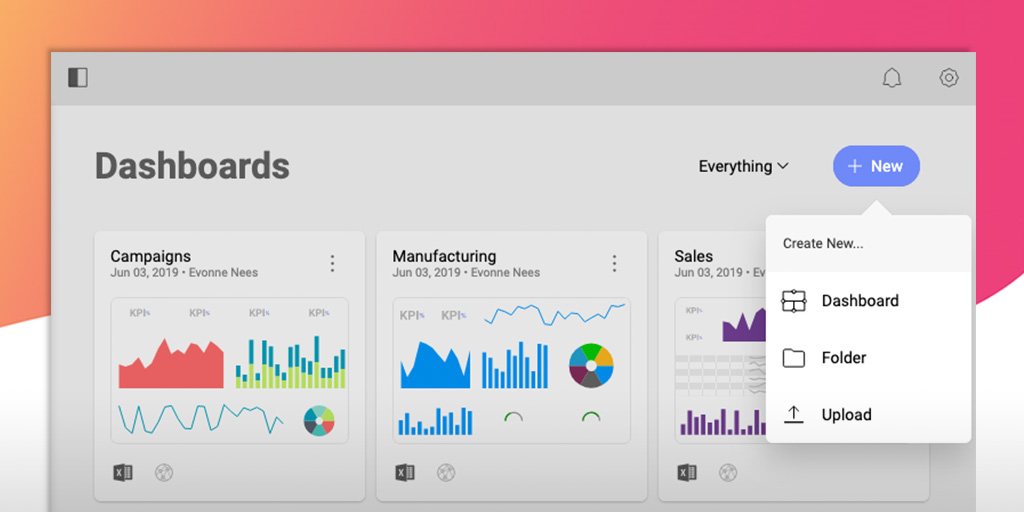
Reveal embedded analytics enables teams and customers to drive data insights with embedded intelligence, transforming the user experience of apps.
Built with embed in mind first, on modern architecture, Reveal’s API aims to remove the complexity of embedding analytics into applications. Reveal’s native SDKs can be integrated into applications on any
platform and tech stack including: .NET Core, Java, NodeJS (coming soon), and
front-end technologies such as React, Angular, WebComponent,…
$0
Tableau Desktop
Score 8.1 out of 10
N/A
Tableau Desktop is a data visualization product from Tableau. It connects to a variety of data sources for combining disparate data sources without coding. It provides tools for discovering patterns and insights, data calculations, forecasts, and statistical summaries and visual storytelling.
$75
per month per user
Pricing
Reveal
Tableau Desktop
Editions & Modules
Embedded Analytics - Contact Us!
$0.00
Tableau
$75
per month per user
Tableau Enterprise
$115
per month per user
Offerings
Pricing Offerings
Reveal
Tableau Desktop
Free Trial
Yes
No
Free/Freemium Version
No
No
Premium Consulting/Integration Services
No
No
Entry-level Setup Fee
Optional
No setup fee
Additional Details
—
All pricing plans are billed annually.
More Pricing Information
Community Pulse
Reveal
Tableau Desktop
Features
Reveal
Tableau Desktop
BI Standard Reporting
Comparison of BI Standard Reporting features of Product A and Product B
Reveal
7.0
Ratings
0% above category average
Tableau Desktop
8.3
Ratings
2% above category average
Pixel Perfect reports
6.50 Ratings
8.80 Ratings
Customizable dashboards
7.40 Ratings
8.40 Ratings
Report Formatting Templates
00 Ratings
7.80 Ratings
Ad-hoc Reporting
Comparison of Ad-hoc Reporting features of Product A and Product B
Reveal
7.3
Ratings
6% below category average
Tableau Desktop
8.7
Ratings
8% above category average
Drill-down analysis
7.00 Ratings
8.60 Ratings
Formatting capabilities
7.30 Ratings
9.20 Ratings
Report sharing and collaboration
8.00 Ratings
9.20 Ratings
Integration with R or other statistical packages
00 Ratings
7.70 Ratings
Data Discovery and Visualization
Comparison of Data Discovery and Visualization features of Product A and Product B
As a company responsible for people money we have to deal with following challenges every day: Clients who want to track the status of their transfers. Licensing agencies who need to ensure professional standards are met. Internal team managers who need to track client and staff progress to ensure company progression and success. Reveal does a good job as self-service tool enabling the accountable parties to have full access to important insights 24/7. The prebuilt dashboard themes save time and investment as we don’t need to hire a dedicated data analyst. The interactive dashboards give full transparency. The ability to easily create, analyze and report keeps clients, partners and stuff on the same page.
The best scenario is definitely to collect data from several sources and create dedicated dashboards for specific recipients. However, I miss the possibility of explaining these reports in more detail. Sometimes, we order a report, and after half a year, we don't remember the meaning of some data (I know it's our fault as an organization, but the tool could force better practices).
Ease of Use - Reveal is super intuitive when it comes to creating dashboards. You don't need to be a data expert, which is key for me.
Sharing - The ability to share across our teams, locations, and with clients is great. We create teams for our different clients and share dashboards there that also are connected to our company dashboards.
Support and Roadmap - Reveal support has been great. They care about the needs of their customers. They have released 3 updates in the last few months, and they are adding a lot of value.
The Visualizations graphics are really good and the color options help in designing attractive charts. They help to convey more information and can be made interactive.
You can add filters with offer you to plug and play with values and understand different outcomes.
You can drag and drop options while creating charts and dashboards. also it is a very fluid layout.
As a developer of the project, I feel comfortable with this tool for its peculiarities: acceptable costs, simple configuration, creation and maintenance of simple reports, fairly complete account management, also, not least, I appreciate the work done by their technical support always timely intervention and, above all, resolutive. Furthermore, as far as end users are concerned, I found a good appreciation of the proposed reports
Because right now its the best option out there (disclosure: I haven't used Qlikview or some of the other direct competitors of Tableau). The big investment is in Tableau Server not desktop. For the cost of the license of Tableau desktop, its a pretty good deal. You can hook it up to pretty much any data source easily. You can easily share the visualizations with your team/colleagues easily. Tableau Desktop is generally easy to use for business users. But the more advanced stuff is better suited for a analyst or someone with a IT/CS background.
There's a little setup initially, but it's very simple. I would only ask for a few more options in font size. My iOS app screenshots perfectly, while the Android version is hard to get all the data to show in the field. I typically show total sales and percentage to LY as my primary team reports...as well as seeing how I'm doing versus the other Area Managers.
Tableau Desktop has proven to be a lifesaver in many situations. Once we've completed the initial setup, it's simple to use. It has all of the features we need to quickly and efficiently synthesize our data. Tableau Desktop has advanced capabilities to improve our company's data structure and enable self-service for our employees.
This assessment is due to the fact that I have not yet found Reveal not available for use. Apart from some problems of development crash, then fixed by the product assistance service, I have not found any particular problems or loss of time caused by the instrument.
When used as a stand-alone tool, Tableau Desktop has unlimited uptime, which is always nice. When used in conjunction with Tableau Server, this tool has as much uptime as your server admins are willing to give it. All in all, I've never had an issue with Tableau's availability.
The pages load rather quickly even in the presence of several elevations in the same dashboard that insist on different data sources and with visualizations that insist on different types of graph. I can only be satisfied with these performances.
Tableau Desktop's performance is solid. You can really dig into a large dataset in the form of a spreadsheet, and it exhibits similarly good performance when accessing a moderately sized Oracle database. I noticed that with Tableau Desktop 9.3, the performance using a spreadsheet started to slow around 75K rows by about 60 columns. This was easily remedied by creating an extract and pushing it to Tableau Server, where performance went to lightning fast
The Tableau Desktop's support team has been very helpful and tend to response very quickly. After all you have paid very premium price for the product and it goes to the services. This makes using the tool much easier for these who doesn't have such experience to get help quickly.
It is admittedly hard to train a group of people with disparate levels of ability coming in, but the software is so easy to use that this is not a huge problem; anyone who can follow simple instructions can catch up pretty quickly.
I think the training was good overall, but it was maybe stating the obvious things that a tech savvy young engineer would be able to pick up themselves too. However, the example work books were good and Tableau web community has helped me with many problems
None in particular, however, would be welcome if improvements were made in the personalization of the prospects and in the connection between them (perhaps being able to transfer the selections present in one prospect to another recalled by the first).
Time needs to be spent ahead of implementation to make sure data sources are set up and ready. Consultants need to understand the data sources and the goals before setting foot on-site. Installation is easy, learning to use it takes time. The training resources available are great.
I tested these other platforms, but for what we are needing, they didn't have all the features that Reveal does. Reveal allows for more personalization and modifications. The other platforms also didn't have the plethora of templates that Reveal does.
Tableau Desktop is clearly one of the best in the business. It has incredible capabilities, and many features are extremely useful. The intuitiveness of the dashboards and the graphical nature of the visualizations are widely used features and super helpful. One of the other benefits is that both programmers and non-programmers can equally explore and create their own opportunities, and seamless integration is possible.
This evaluation is the result of the fact that I have not had the opportunity to deepen the Reveal interface with other tools and / or other software, so the evaluation that I am giving follows what I have been able to read regarding the characteristics of the product online.
Tableau Desktop's scaleability is really limited to the scale of your back-end data systems. If you want to pull down an extract and work quickly in-memory, in my application it scaled to a few tens of millions of rows using the in-memory engine. But it's really only limited by your back-end data store if you have or are willing to invest in an optimized SQL store or purpose-built query engine like Veritca or Netezza or something similar.