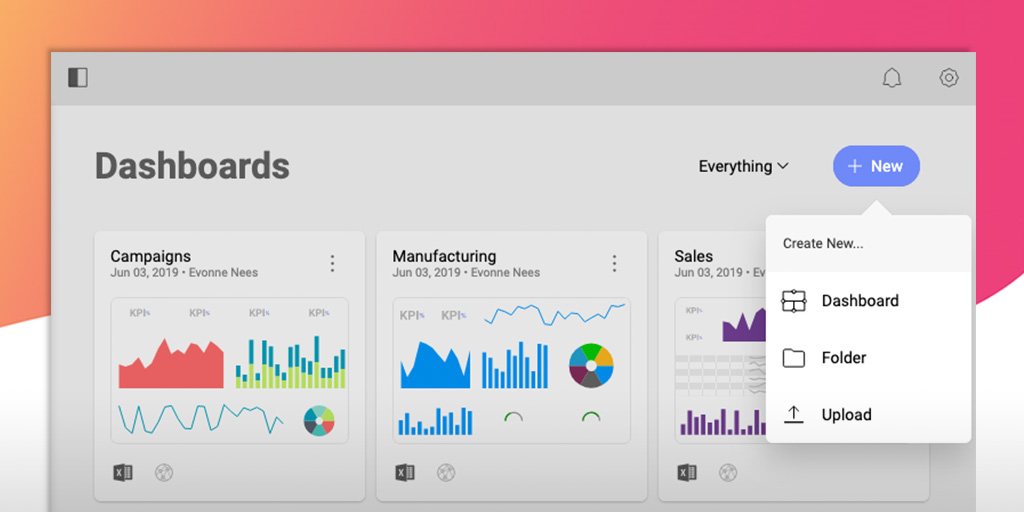
Reveal vs. Tableau Cloud

Overview
ProductRatingMost Used ByProduct SummaryStarting Price
Reveal
Score 10.0 out of 10
N/A
Reveal embedded analytics enables teams and customers to drive data insights with embedded intelligence, transforming the user experience of apps. Built with embed in mind first, on modern architecture, Reveal’s API aims to remove the complexity of embedding analytics into applications. Reveal’s native SDKs can be integrated into applications on any platform and tech stack including: .NET Core, Java, NodeJS (coming soon), and front-end technologies such as React, Angular, WebComponent,…
$0
Tableau Cloud
Score 7.9 out of 10
N/A
Tableau Cloud (formerly Tableau Online) is a self-service analytics platform that is fully hosted in the cloud. Tableau Cloud enables users to publish dashboards and invite colleagues to explore hidden opportunities with interactive visualizations and accurate data, from any browser or mobile device.
$15
per month billed annually per user
Pricing
RevealTableau Cloud
Editions & Modules
Embedded Analytics - Contact Us!
$0.00
Tableau Viewer
$15
per month billed annually per user
Enterprise Viewer
$35
per month billed annually per user
Tableau Explorer
$42
per month billed annually per user
Enterprise Explorer
$70
per month billed annually per user
Tableau Creator
$75
per month billed annually per user
Enterprise Creator
$115
per month billed annually per user
Tableau+
Contact Sales
Offerings
Pricing Offerings
RevealTableau Cloud
Free Trial
YesNo
Free/Freemium Version
NoNo
Premium Consulting/Integration Services
NoNo
Entry-level Setup FeeOptionalNo setup fee
Additional Details
More Pricing Information
Community Pulse
RevealTableau Cloud
Features
RevealTableau Cloud
BI Standard Reporting
Comparison of BI Standard Reporting features of Product A and Product B
Reveal
7.0
Ratings
0% above category average
Tableau Cloud
7.0
Ratings
15% below category average
Pixel Perfect reports6.50 Ratings7.00 Ratings
Customizable dashboards7.40 Ratings8.00 Ratings
Report Formatting Templates00 Ratings6.00 Ratings
Ad-hoc Reporting
Comparison of Ad-hoc Reporting features of Product A and Product B
Reveal
7.3
Ratings
6% below category average
Tableau Cloud
6.9
Ratings
15% below category average
Drill-down analysis7.00 Ratings8.00 Ratings
Formatting capabilities7.30 Ratings6.00 Ratings
Report sharing and collaboration8.00 Ratings7.50 Ratings
Integration with R or other statistical packages00 Ratings6.00 Ratings
Data Discovery and Visualization
Comparison of Data Discovery and Visualization features of Product A and Product B
Reveal
7.6
Ratings
1% above category average
Tableau Cloud
6.8
Ratings
16% below category average
Pre-built visualization formats (heatmaps, scatter plots etc.)7.50 Ratings7.50 Ratings
Location Analytics / Geographic Visualization7.50 Ratings6.50 Ratings
Predictive Analytics7.70 Ratings6.50 Ratings
Pattern Recognition and Data Mining00 Ratings6.50 Ratings
Access Control and Security
Comparison of Access Control and Security features of Product A and Product B
Reveal
6.7
Ratings
12% below category average
Tableau Cloud
7.0
Ratings
19% below category average
Multi-User Support (named login)6.60 Ratings7.00 Ratings
Role-Based Security Model7.10 Ratings7.00 Ratings
Multiple Access Permission Levels (Create, Read, Delete)7.60 Ratings7.00 Ratings
Single Sign-On (SSO)5.60 Ratings7.50 Ratings
Report-Level Access Control00 Ratings6.50 Ratings
Application Program Interfaces (APIs) / Embedding
Comparison of Application Program Interfaces (APIs) / Embedding features of Product A and Product B
Reveal
6.0
Ratings
22% below category average
Tableau Cloud
6.4
Ratings
20% below category average
REST API2.60 Ratings6.00 Ratings
Javascript API7.20 Ratings6.50 Ratings
Java API6.40 Ratings6.00 Ratings
iFrames00 Ratings6.50 Ratings
Themeable User Interface (UI)00 Ratings6.50 Ratings
Customizable Platform (Open Source)00 Ratings7.00 Ratings
Report Output and Scheduling
Comparison of Report Output and Scheduling features of Product A and Product B
Reveal
-
Ratings
Tableau Cloud
7.1
Ratings
16% below category average
Publish to Web00 Ratings7.00 Ratings
Publish to PDF00 Ratings7.50 Ratings
Report Versioning00 Ratings7.00 Ratings
Report Delivery Scheduling00 Ratings8.00 Ratings
Delivery to Remote Servers00 Ratings6.00 Ratings
Mobile Capabilities
Comparison of Mobile Capabilities features of Product A and Product B
Reveal
-
Ratings
Tableau Cloud
6.4
Ratings
20% below category average
Responsive Design for Web Access00 Ratings5.50 Ratings
Mobile Application00 Ratings6.00 Ratings
Dashboard / Report / Visualization Interactivity on Mobile00 Ratings7.00 Ratings
Best Alternatives
RevealTableau Cloud
Small Businesses
BrightGauge
BrightGauge
Score 9.0 out of 10
BrightGauge
BrightGauge
Score 9.0 out of 10
Medium-sized Companies
BrightGauge
BrightGauge
Score 9.0 out of 10
Reveal
Reveal
Score 10.0 out of 10
Enterprises
Infor Birst
Infor Birst
Score 5.3 out of 10
Kyvos Semantic Intelligence Layer
Score 9.9 out of 10
All AlternativesView all alternativesView all alternatives
User Ratings
RevealTableau Cloud
Likelihood to Recommend
10.0
(0 ratings)
8.0
(0 ratings)
Likelihood to Renew
8.2
(0 ratings)
-
(0 ratings)
Usability
8.3
(0 ratings)
8.0
(0 ratings)
Availability
8.2
(0 ratings)
-
(0 ratings)
Performance
7.3
(0 ratings)
-
(0 ratings)
Support Rating
-
(0 ratings)
8.7
(0 ratings)
Implementation Rating
7.3
(0 ratings)
-
(0 ratings)
Configurability
7.3
(0 ratings)
-
(0 ratings)
Ease of integration
6.4
(0 ratings)
-
(0 ratings)
Product Scalability
6.4
(0 ratings)
-
(0 ratings)
Vendor post-sale
7.3
(0 ratings)
-
(0 ratings)
Vendor pre-sale
7.3
(0 ratings)
-
(0 ratings)
User Testimonials
RevealTableau Cloud
Likelihood to Recommend
As a company responsible for people money we have to deal with following challenges every day: Clients who want to track the status of their transfers. Licensing agencies who need to ensure professional standards are met. Internal team managers who need to track client and staff progress to ensure company progression and success. Reveal does a good job as self-service tool enabling the accountable parties to have full access to important insights 24/7. The prebuilt dashboard themes save time and investment as we don’t need to hire a dedicated data analyst. The interactive dashboards give full transparency. The ability to easily create, analyze and report keeps clients, partners and stuff on the same page.
Read full review
If you're using Tableau as the primary BI tool, then Tableau Cloud is well suited to publish and share the results with a wide(r) audience. It is well suited for various degrees of self-service proficiency, from pure consumers of analytical work to more advanced users who can use web editing for smaller or larger adjustments, and even for desktop power users who will publish their work to Tableau Cloud. It has many good ways to organize the content and make it easily accessible via search, favorites, folders, collections ("playlists for your data"), or history ("recents"). It might not be ideally suited if there are many on-prem sources to be used (even though there are options to connect them) or if you have very special requirements regarding custom server setup, which is limited in a shared cloud environment like Tableau Cloud.
Read full review
Pros
  • Ease of Use - Reveal is super intuitive when it comes to creating dashboards. You don't need to be a data expert, which is key for me.
  • Sharing - The ability to share across our teams, locations, and with clients is great. We create teams for our different clients and share dashboards there that also are connected to our company dashboards.
  • Support and Roadmap - Reveal support has been great. They care about the needs of their customers. They have released 3 updates in the last few months, and they are adding a lot of value.
Read full review
  • Tableau Online is completely cloud based and that's why the reports and dashboards are accessible even on the go. One doesn't always need to access the office laptop to access the reports.
  • The visualizations are interactive and one can quickly change the level at which they want to view the information. For example, one person might be more interested in looking at the country level performances rather than client level. This is intuitive and one doesn't need to create multiple reports for the same.
  • The feature to ask questions in plain vanilla English language is great and helpful. For quick adhoc fact checks one can simply type what they are looking for and the Natural Language Programming algorithms under the hood parse the query, interpret it and then fetch the results accordingly in a visual form.
Read full review
Cons
  • There are a limited number of templates, but this is something they say they are working on.
  • Cost is reasonable for individual personal use, but prohibitive to small companies looking to embed their services in their own App.
  • Responses to emails for support can be delayed, but what else is new?
Read full review
  • Can be a steep learning curve for new users
  • Modeling and building algorithms aren't always intuitive and take some testing/retesting to ensure it's working as it should
  • Inability to integrate easily with our HRIS platform. Reports are pulled from HRIS at various intervals and uploaded into Tableau
Read full review
Likelihood to Renew
As a developer of the project, I feel comfortable with this tool for its peculiarities: acceptable costs, simple configuration, creation and maintenance of simple reports, fairly complete account management, also, not least, I appreciate the work done by their technical support always timely intervention and, above all, resolutive.
Furthermore, as far as end users are concerned, I found a good appreciation of the proposed reports
Read full review
The tool's capacity to handle complex data sources.
Read full review
Usability
There's a little setup initially, but it's very simple. I would only ask for a few more options in font size. My iOS app screenshots perfectly, while the Android version is hard to get all the data to show in the field. I typically show total sales and percentage to LY as my primary team reports...as well as seeing how I'm doing versus the other Area Managers.
Read full review
From an end user perspective Tableau Online is overall very easy to navigate once you get used to it, my only complaint is that when expanding or contracting a graph, the "plus" and "minus" on the bottom left is sometimes hidden, and should always be visible. From a builder perspective, it can take some getting used to but the sheer depth of customization makes it all worthwhile.
Read full review
Reliability and Availability
This assessment is due to the fact that I have not yet found Reveal not available for use. Apart from some problems of development crash, then fixed by the product assistance service, I have not found any particular problems or loss of time caused by the instrument.
Read full review
No answers on this topic
Performance
The pages load rather quickly even in the presence of several elevations in the same dashboard that insist on different data sources and with visualizations that insist on different types of graph. I can only be satisfied with these performances.
Read full review
No answers on this topic
Support Rating
No answers on this topic
I have no had a lot of experience with the support team, but I know that it’s hardly necessary for the end-user to contact. Usually, the main questions I get are on how to read a certain dashboard or how to navigate to a certain place. Overall, the simplicity of the software is what helps out with less need for support.
Read full review
Implementation Rating
None in particular, however, would be welcome if improvements were made in the personalization of the prospects and in the connection between them (perhaps being able to transfer the selections present in one prospect to another recalled by the first).
Read full review
I wasn't part of the implementation team
Read full review
Alternatives Considered
I tested these other platforms, but for what we are needing, they didn't have all the features that Reveal does. Reveal allows for more personalization and modifications. The other platforms also didn't have the plethora of templates that Reveal does.
Read full review
When weighing the pros and cons of Tableau Online vs. SAP ERP, two key considerations emerged as clear winners. SAP ERP is a powerful data purification tool, but it doesn't measure up to the competition in terms of data presentation. When it came to data visualization and analytics, Tableau was our go-to tool. The price is the second consideration. Tableau, on the other hand, was the more cost-effective option for our requirements.
Read full review
Scalability
This evaluation is the result of the fact that I have not had the opportunity to deepen the Reveal interface with other tools and / or other software, so the evaluation that I am giving follows what I have been able to read regarding the characteristics of the product online.
Read full review
No answers on this topic
Return on Investment
  • We have the best platform for visualizing data for better understanding
  • The drag and drop features saves time
  • With data from multiple sources, we get the right intelligence to drive our business forward.
  • While it is expensive, the benefits outweighs the high cost
Read full review
  • No need to hire a team of developers to deliver our product, a huge cost savings for a start up company.
  • The ability to work off data extracts allows us to "set in and forget it" so to speak, which allows our customers to use the system during business hours with almost no cost in terms of database usage.
  • It has been a great internal tool for dashboarding company metrics and helping us track goals and implement solutions to meet those goals through efficient data analysis.
Read full review
ScreenShots

Reveal Screenshots

Screenshot of Screenshot of Screenshot of Screenshot of Screenshot of Screenshot of