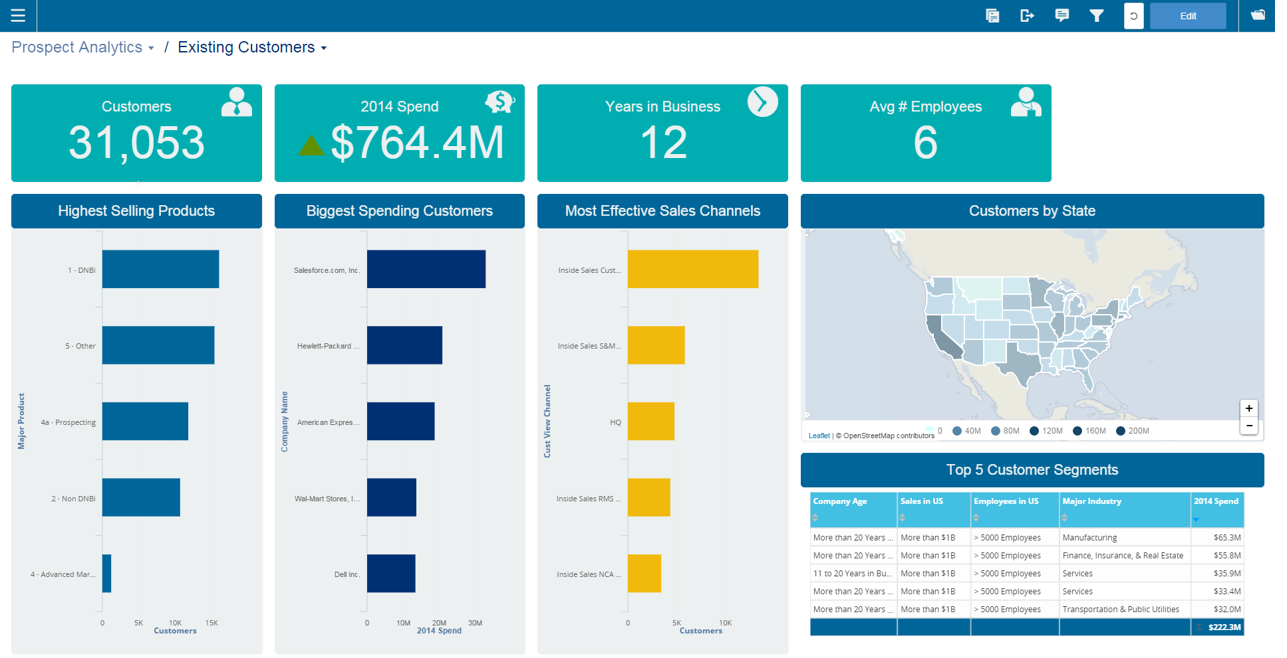
Infor Birst offers multi-tenant cloud BI for deployment in a public or private cloud, or on-premises. It provides an in-memory columnar data store and a BI layer comprising a reporting engine, predictive analytics tools, mobile native apps, dashboards, discovery tools, and an open client interface.
N/A
Microsoft Power BI Embedded
Score 8.5 out of 10
N/A
A solution from Microsoft to provide customer-facing reports, dashboards, and analytics in applications by using and branding Power BI as one's own. Designed to reduce developer resources by automating the monitoring, management, and deployment of analytics, while getting full control of Power BI features and intelligent analytics.
N/A
Pricing
Infor Birst
Microsoft Power BI Embedded
Editions & Modules
No answers on this topic
No answers on this topic
Offerings
Pricing Offerings
Infor Birst
Microsoft Power BI Embedded
Free Trial
No
No
Free/Freemium Version
No
No
Premium Consulting/Integration Services
No
No
Entry-level Setup Fee
No setup fee
No setup fee
Additional Details
—
—
More Pricing Information
Community Pulse
Infor Birst
Microsoft Power BI Embedded
Features
Infor Birst
Microsoft Power BI Embedded
BI Standard Reporting
Comparison of BI Standard Reporting features of Product A and Product B
Infor Birst
7.4
Ratings
10% below category average
Microsoft Power BI Embedded
-
Ratings
Pixel Perfect reports
7.00 Ratings
00 Ratings
Customizable dashboards
8.00 Ratings
00 Ratings
Report Formatting Templates
7.10 Ratings
00 Ratings
Ad-hoc Reporting
Comparison of Ad-hoc Reporting features of Product A and Product B
Infor Birst
7.0
Ratings
14% below category average
Microsoft Power BI Embedded
-
Ratings
Drill-down analysis
8.00 Ratings
00 Ratings
Formatting capabilities
7.00 Ratings
00 Ratings
Integration with R or other statistical packages
6.10 Ratings
00 Ratings
Report sharing and collaboration
7.00 Ratings
00 Ratings
Report Output and Scheduling
Comparison of Report Output and Scheduling features of Product A and Product B
Infor Birst
8.0
Ratings
4% below category average
Microsoft Power BI Embedded
-
Ratings
Publish to Web
8.00 Ratings
00 Ratings
Publish to PDF
8.00 Ratings
00 Ratings
Report Versioning
7.20 Ratings
00 Ratings
Report Delivery Scheduling
9.00 Ratings
00 Ratings
Data Discovery and Visualization
Comparison of Data Discovery and Visualization features of Product A and Product B
Birst is well suited for an organization looking for a cloud-hosted analytics solution that is contained within one package. It is able to connect to a very wide variety of different data sources, and has options for either light or involved ETL procedures, depending on the users experience with preparing data. As with any BI project, it would not be suitable for an organization where there is no dedicated team to maintain and manage the project.
The scenario where it shines more is in the treatment of data that is not easily correlated at first sight, it helps to find causes of unsuccess in productive environments. The only thing that is required is to have properly collected data to feed to Power BI, so it won't be useful in environments where the data is not collected with care, since the representations won't be representatives of the reality.
Birst is an platform that provides connectors to some of the applications we use, but also allows us to bring in data from disparate systems to perform ETL and integrate all of the data for analyses. It makes no assumptions about your data, which is good for us, as we have a lot of customizations to many of our systems.
We have been able to overcome any of the drawbacks we've found with Birst easily and it has fulfilled almost all of our analytic needs to date. Having seen their roadmap it would be highly unlikely we would move away from this platform any time soon. You simply can't beat the functionality that Birst provides for the price and the things I see coming out of the company solidify that our decision to choose Birst was the best possible choice. We have never regretted the decision.
Birst is a reliable BI platform that has developed through uploads via the cloud, easy tabular views, quick manual uploads and links to SQL databases. It however does not compete with other BI tools with the data manipulation and connections when your data is uploaded in the platform and the visualisation and customisations available. The automation aspect is very useful and is one of the top features, alongside the user hierarchy and permissions. Birst is an easy and useful tool for finicial reporting, however is not currently the best option on the market for providing easy to understand, edit and present visualisations.
We frequently experience -103 errors due to us using the Live Connect functionality, which does not seem to handle even minor interruptions in connectivity, and treats all future connection attempts or data requests as errors, even if the issue does not exist any longer
In a reporting and analytics package there are two distinct performance times to look at. First is the performance of calculating the report data and metrics. I would rate a 9 for this. However, the interface rendering is slow, rating a 7. Dashboards can take 3-5 seconds to load. This is probably not a problem for normal users, as the dashboard render is performed once. My application integrated the dashboard into a commercial product though, with hundreds of customers - so my demands are higher with a large number of end users.
I went to their annual user conference (Birst Forward) and their standard training class (Birst Boot Camp) this year, and both were excellent. Very educational, and I got all of the personal attention I needed to get my questions about my specific answered. I've also reached out to the trainers after those events to ask more questions, and they've been great about getting back to me with answers
Although I found the online resources helpful, a lack of appropriate examples for certain tasks key to report creation and advanced modeling make the online training/documentation less than perfect. For an inexperienced BI professional, the online training would not enable a streamlined launch of the product.
Have clean data! Birst flexibility allows - Start small, then introduce functionality and complexity along the way. If you try to present all the functionality [bells and whistles] and wow them, but bad data is uncovered, the end user blames the new application and turns away.
Infor Birst OEM and embedded analytics have low-code no-code features which are easy to deploy and with easy instances creation with a dev-quality-production environment. Good capability on data mapping features from source to intermediate to target with impressive metadata management.
Microsoft Power BI Embedded is already established as a de-facto standard as a business intelligence platform for the enterprise world. It comprises the best features to be delivered for the products being developed by providing a wide range of functionality. For instance, there are supported numerous graphic visualizations of data points such histograms, pie charts, heat maps and so on
we can see that loading a lot of data can cause a noticable slow down in performance. Birst support indicated that they don't really consider anything less than 30 seconds to be an issue, but that is not the case for our customers, so we have had to change some of implementation to address this
Being a manufacturing company we tend to lag behind technologically. But having all the data for different ERP systems in one place has been an eye opener for the executives. It has lessened the need to convert some legacy ERP systems.
Having such a simple reporting tool is a great asset to some of our sites that have traditionally had trouble gathering data from AS400 systems.
Microsoft Power BI has had a positive impact on our business objectives by allowing everyone to better understand the data that is being presented. Some people can process numbers and charts easily, but interactive visualizations can aid visual learners and just makes the dashboard look a lot nicer with the ability to dive deeper into the numbers (through visualizations). Thus, engagement and understanding have improved.
One negative impact is that there is a rather steep learning curve since Microsoft Power BI's language (DAX/M) can be quite different from traditional Excel. Because of that, either you need to hire people who are specialized in Microsoft Power BI, or you need to account for the fact that they will need to be trained (or take time to learn it). Thus, there can be direct costs from hiring new people, or indirect costs through training/employee taking time to learn the software.
Another positive impact of Microsoft Power BI is that it got us thinking about how we can be better as an organization in terms of laying out our raw data, organizing data, conducting research into better metrics we can track and report on, etc. Because Microsoft Power BI made the presentation/visualization (+ regular updating/maintenance) part of our dashboard easier for us, we were able to start thinking about additional metrics and additional ways we can improve our reporting.