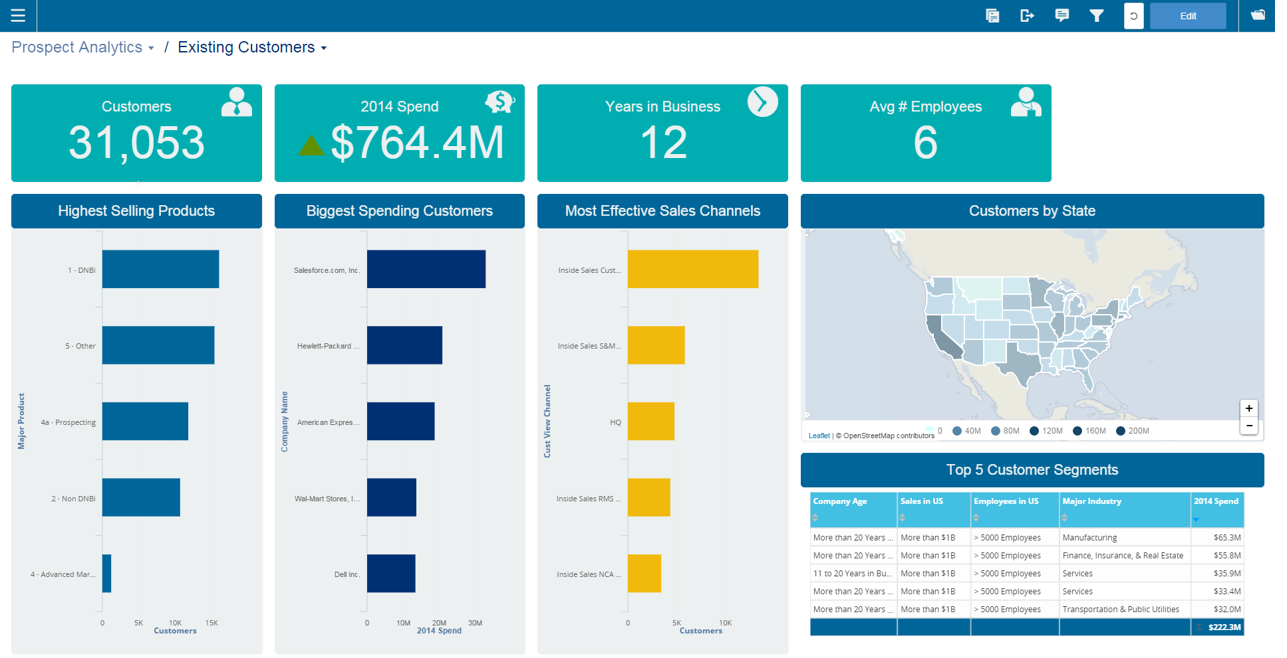
Infor Birst offers multi-tenant cloud BI for deployment in a public or private cloud, or on-premises. It provides an in-memory columnar data store and a BI layer comprising a reporting engine, predictive analytics tools, mobile native apps, dashboards, discovery tools, and an open client interface.
N/A
Klipfolio Klips
Score 9.2 out of 10
Small Businesses (1-50 employees)
Klipfolio is a customizable dashboard and reporting platform that provides real-time business insights. It is used by small to mid-sized businesses and agencies to track performance metrics and create tailored reports, and to consolidate, transform, and visualize data.
$90
per month
Pricing
Infor Birst
Klipfolio Klips
Editions & Modules
No answers on this topic
Base
$90
per month
Grow
$190
per month
Team
$350
per month
Offerings
Pricing Offerings
Infor Birst
Klipfolio Klips
Free Trial
No
Yes
Free/Freemium Version
No
No
Premium Consulting/Integration Services
Yes
Yes
Entry-level Setup Fee
No setup fee
Optional
Additional Details
—
Discount available for annual pricing. There are various implementation and training options available, from a 60 Day Proof of Concept, to Onboarding & Training, or ongoing dedicated Data Hero support.
More Pricing Information
Community Pulse
Infor Birst
Klipfolio Klips
Features
Infor Birst
Klipfolio Klips
BI Standard Reporting
Comparison of BI Standard Reporting features of Product A and Product B
Infor Birst
7.4
77 Ratings
10% below category average
Klipfolio Klips
9.0
33 Ratings
7% above category average
Pixel Perfect reports
7.068 Ratings
9.13 Ratings
Customizable dashboards
8.077 Ratings
8.933 Ratings
Report Formatting Templates
7.159 Ratings
9.13 Ratings
Ad-hoc Reporting
Comparison of Ad-hoc Reporting features of Product A and Product B
Infor Birst
7.0
78 Ratings
14% below category average
Klipfolio Klips
8.6
33 Ratings
8% above category average
Drill-down analysis
8.078 Ratings
8.35 Ratings
Formatting capabilities
7.077 Ratings
7.85 Ratings
Integration with R or other statistical packages
6.127 Ratings
9.12 Ratings
Report sharing and collaboration
7.068 Ratings
9.133 Ratings
Report Output and Scheduling
Comparison of Report Output and Scheduling features of Product A and Product B
Infor Birst
8.0
75 Ratings
4% below category average
Klipfolio Klips
9.4
33 Ratings
11% above category average
Publish to Web
8.052 Ratings
8.931 Ratings
Publish to PDF
8.067 Ratings
9.228 Ratings
Report Versioning
7.28 Ratings
00 Ratings
Report Delivery Scheduling
9.066 Ratings
10.017 Ratings
Data Discovery and Visualization
Comparison of Data Discovery and Visualization features of Product A and Product B
Infor Birst OEM and embedded analytics are well suited for advanced analytics and business intelligence. It has flexible deployment features and a lot of configuration ability with low code - no coding ability. Ability to ingest data from multiple live data sources. Source data from multiple sources can be segregated into multiple sections based on business criteria. Easily searchable business terms (metadata) across all enterprise analytic content.
Using Klipfolio is one of the finest ways we can expand our business because it is so simple to use and always has new features that make it better. We also appreciate the excellent customer service they offer. There are several benefits to making this investment in your company's efficiency and profitability. We think it's worth the money.
End-to-end solution, from raw source data, ETL, warehousing and reporting, Birst is able to do everything we need in one package instead of needing to develop and maintain multiple technologies
Intuitive report development. The drag and drop creation of reports is simple. More complicated queries are easy to generate.
Very user-friendly and interactive. A lot of nice features are available both for developers and end users to streamline the process of preparing and consuming data
Rich API which allows us to programmatically interact with Birst
While Klipfolio covers so many of the bases, one area where I would like to see expansion would be offering additional design and graphics themes for even more customization.
Klipfolio has an extensive offering but might be even better if there were a way that we could integrate with some small to mid-sized CRM solutions for audience list segmentation and marketing integrations.
It would be interesting if Klipfolio could enable us to overlay the data learnings for cross-referencing of multiple client campaigns for comparative insights.
We have been able to overcome any of the drawbacks we've found with Birst easily and it has fulfilled almost all of our analytic needs to date. Having seen their roadmap it would be highly unlikely we would move away from this platform any time soon. You simply can't beat the functionality that Birst provides for the price and the things I see coming out of the company solidify that our decision to choose Birst was the best possible choice. We have never regretted the decision.
I would like to see additional usability put into the ETL scripting. Recently, Birst added a nice function reference inline to formula creation which has kept me from having to return to documentation so much. The same in ETL would be very beneficial. The interface problems related to the Flex framework are being addressed in a rewrite to HTML 5, but for now they are still a hindrance to a higher usability rating.
My initial impressions of the software have been extremely positive. There are YouTube tutorials that explain how to make klips. The intuitive design of the UI It appears that everything in this software has been thoroughly tested to create all the visualizations that can be imagined as well as the user input controls that allow users to have exactly the data they want to be displayed in seconds, considering the various functions and formulas available in the Excel integrations and the extensive list of other services that can be integrated.
We frequently experience -103 errors due to us using the Live Connect functionality, which does not seem to handle even minor interruptions in connectivity, and treats all future connection attempts or data requests as errors, even if the issue does not exist any longer
Everything runs very fast and smoothly. The only process that I wish was faster would be processing the data after uploading new data or making changes to the existing data model. It can take 15-20 minutes (roughly) to upload and process new data once you start getting into 10's of millions of rows. Given my experience with how long it takes me to pull the same data using SQL Server Management Studio, I don't think Birst is unreasonably slow - but for me to give a higher rating, I would want it to be unreasonably fast
When we have an issue that is stopping our business from proceeding, I want answers sooner than later. While Birst does have a published response time for each case level, we always wish it could be quicker. What response improvement could there be with a larger support team? In response to first question: Blackhole of issues - Birst needs to improve upon closing issues that resolution was dependent upon code fixes or enhancements, perhaps someone to add a comment on all case tickets at least every 60 days. Escalation - I always have the ability to electronically or via phone escalate a ticket. I also have my Customer Success Manager through whom I can escalate topics.
It provides all the necessary information to be able to carry out the analysis of any type of business, to know how money is managed virtually, what to do to have greater visibility, in addition to being a platform that is always accessible and allows continuous and efficient work.
I have attended two different training sessions. The first one was my initial training on the system. It was well paced, clear and concise. If there were questions that were not able to be answered by the instructor, he took down the question and actually followed up and provided us a response quickly. The second session was specific to the dashboard and report design components. This training was very good though there were some attendants who had little or no experience and their questions slowed the class.
Although I found the online resources helpful, a lack of appropriate examples for certain tasks key to report creation and advanced modeling make the online training/documentation less than perfect. For an inexperienced BI professional, the online training would not enable a streamlined launch of the product.
Have clean data! Birst flexibility allows - Start small, then introduce functionality and complexity along the way. If you try to present all the functionality [bells and whistles] and wow them, but bad data is uncovered, the end user blames the new application and turns away.
Birst was better than Domo for our needs because we could get in and tinker with it. Our impression of Domo was that it had a lot of connectors and ready to go reports, but it made too many assumptions about applications we use. We customize too much to use a "ready to go" solution like that. When we looked at Tableau, we liked its visualization capabilities, but it wasn't going to help us do the extractions, ETL, and warehousing of data. It may have come some distance since then.
These and many other BI tools are the most direct competitors. I only have experience with Klipfolio and Tableau. Tableau is definitely more capable, but much more difficult to learn and use. Klipfolio is simple and really packs a punch for its simplicity. I have yet to run into a major problem with it lacking a needed functionality.
we can see that loading a lot of data can cause a noticable slow down in performance. Birst support indicated that they don't really consider anything less than 30 seconds to be an issue, but that is not the case for our customers, so we have had to change some of implementation to address this
Being a manufacturing company we tend to lag behind technologically. But having all the data for different ERP systems in one place has been an eye opener for the executives. It has lessened the need to convert some legacy ERP systems.
Having such a simple reporting tool is a great asset to some of our sites that have traditionally had trouble gathering data from AS400 systems.