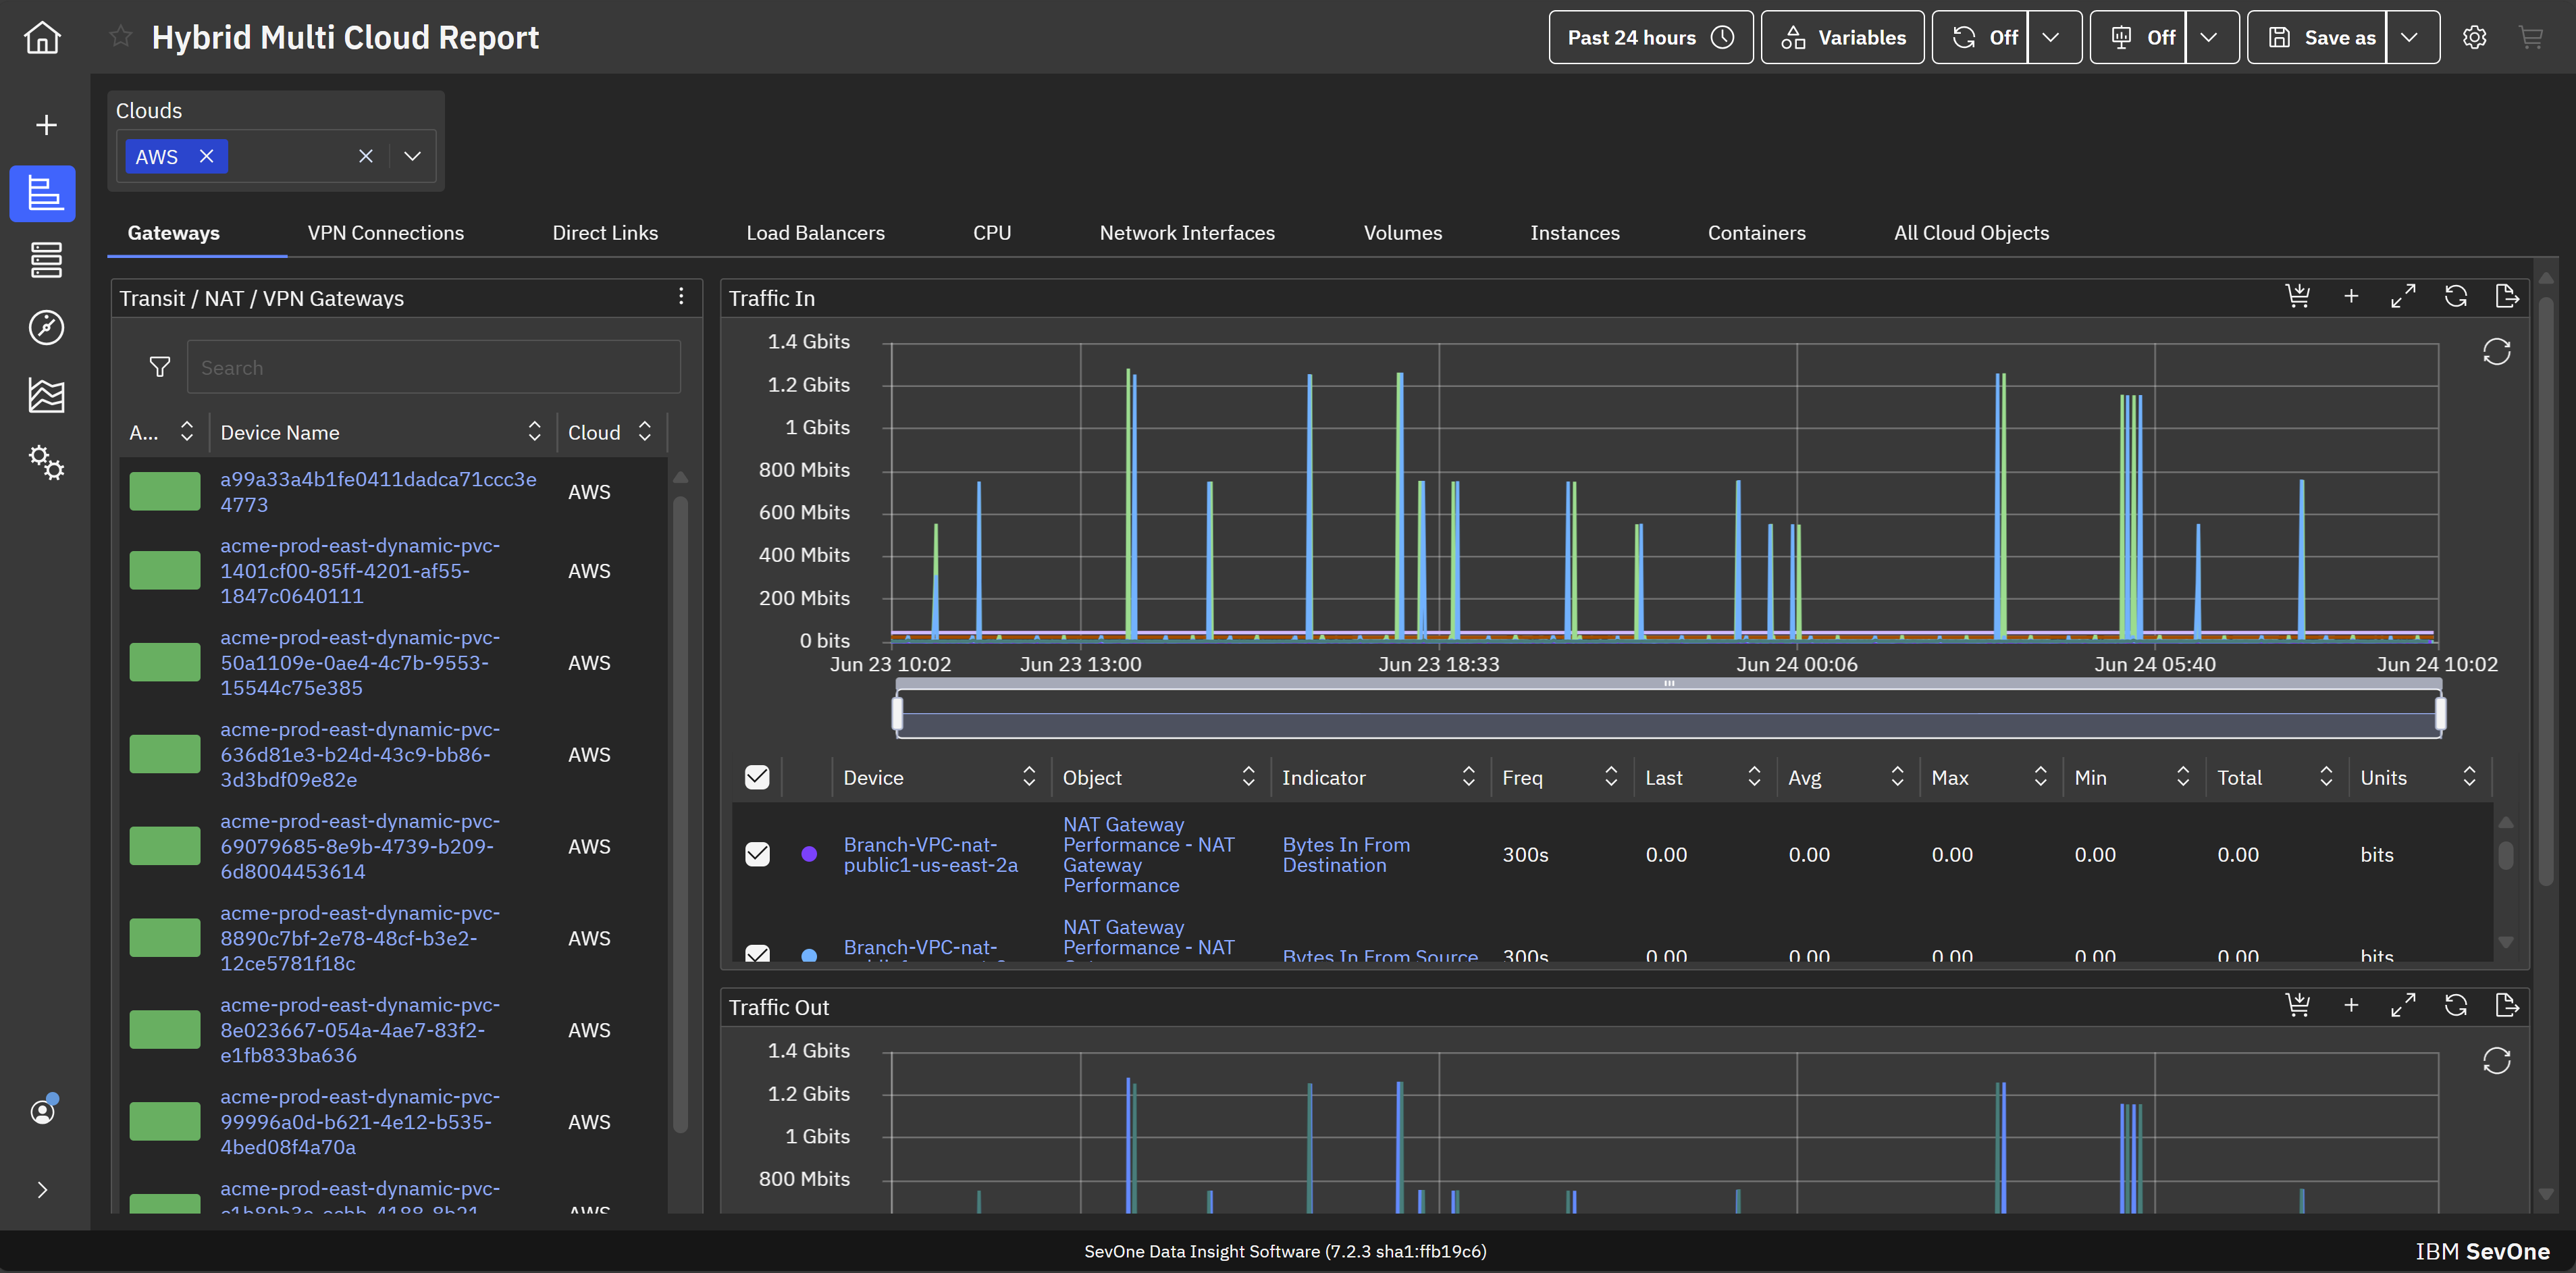
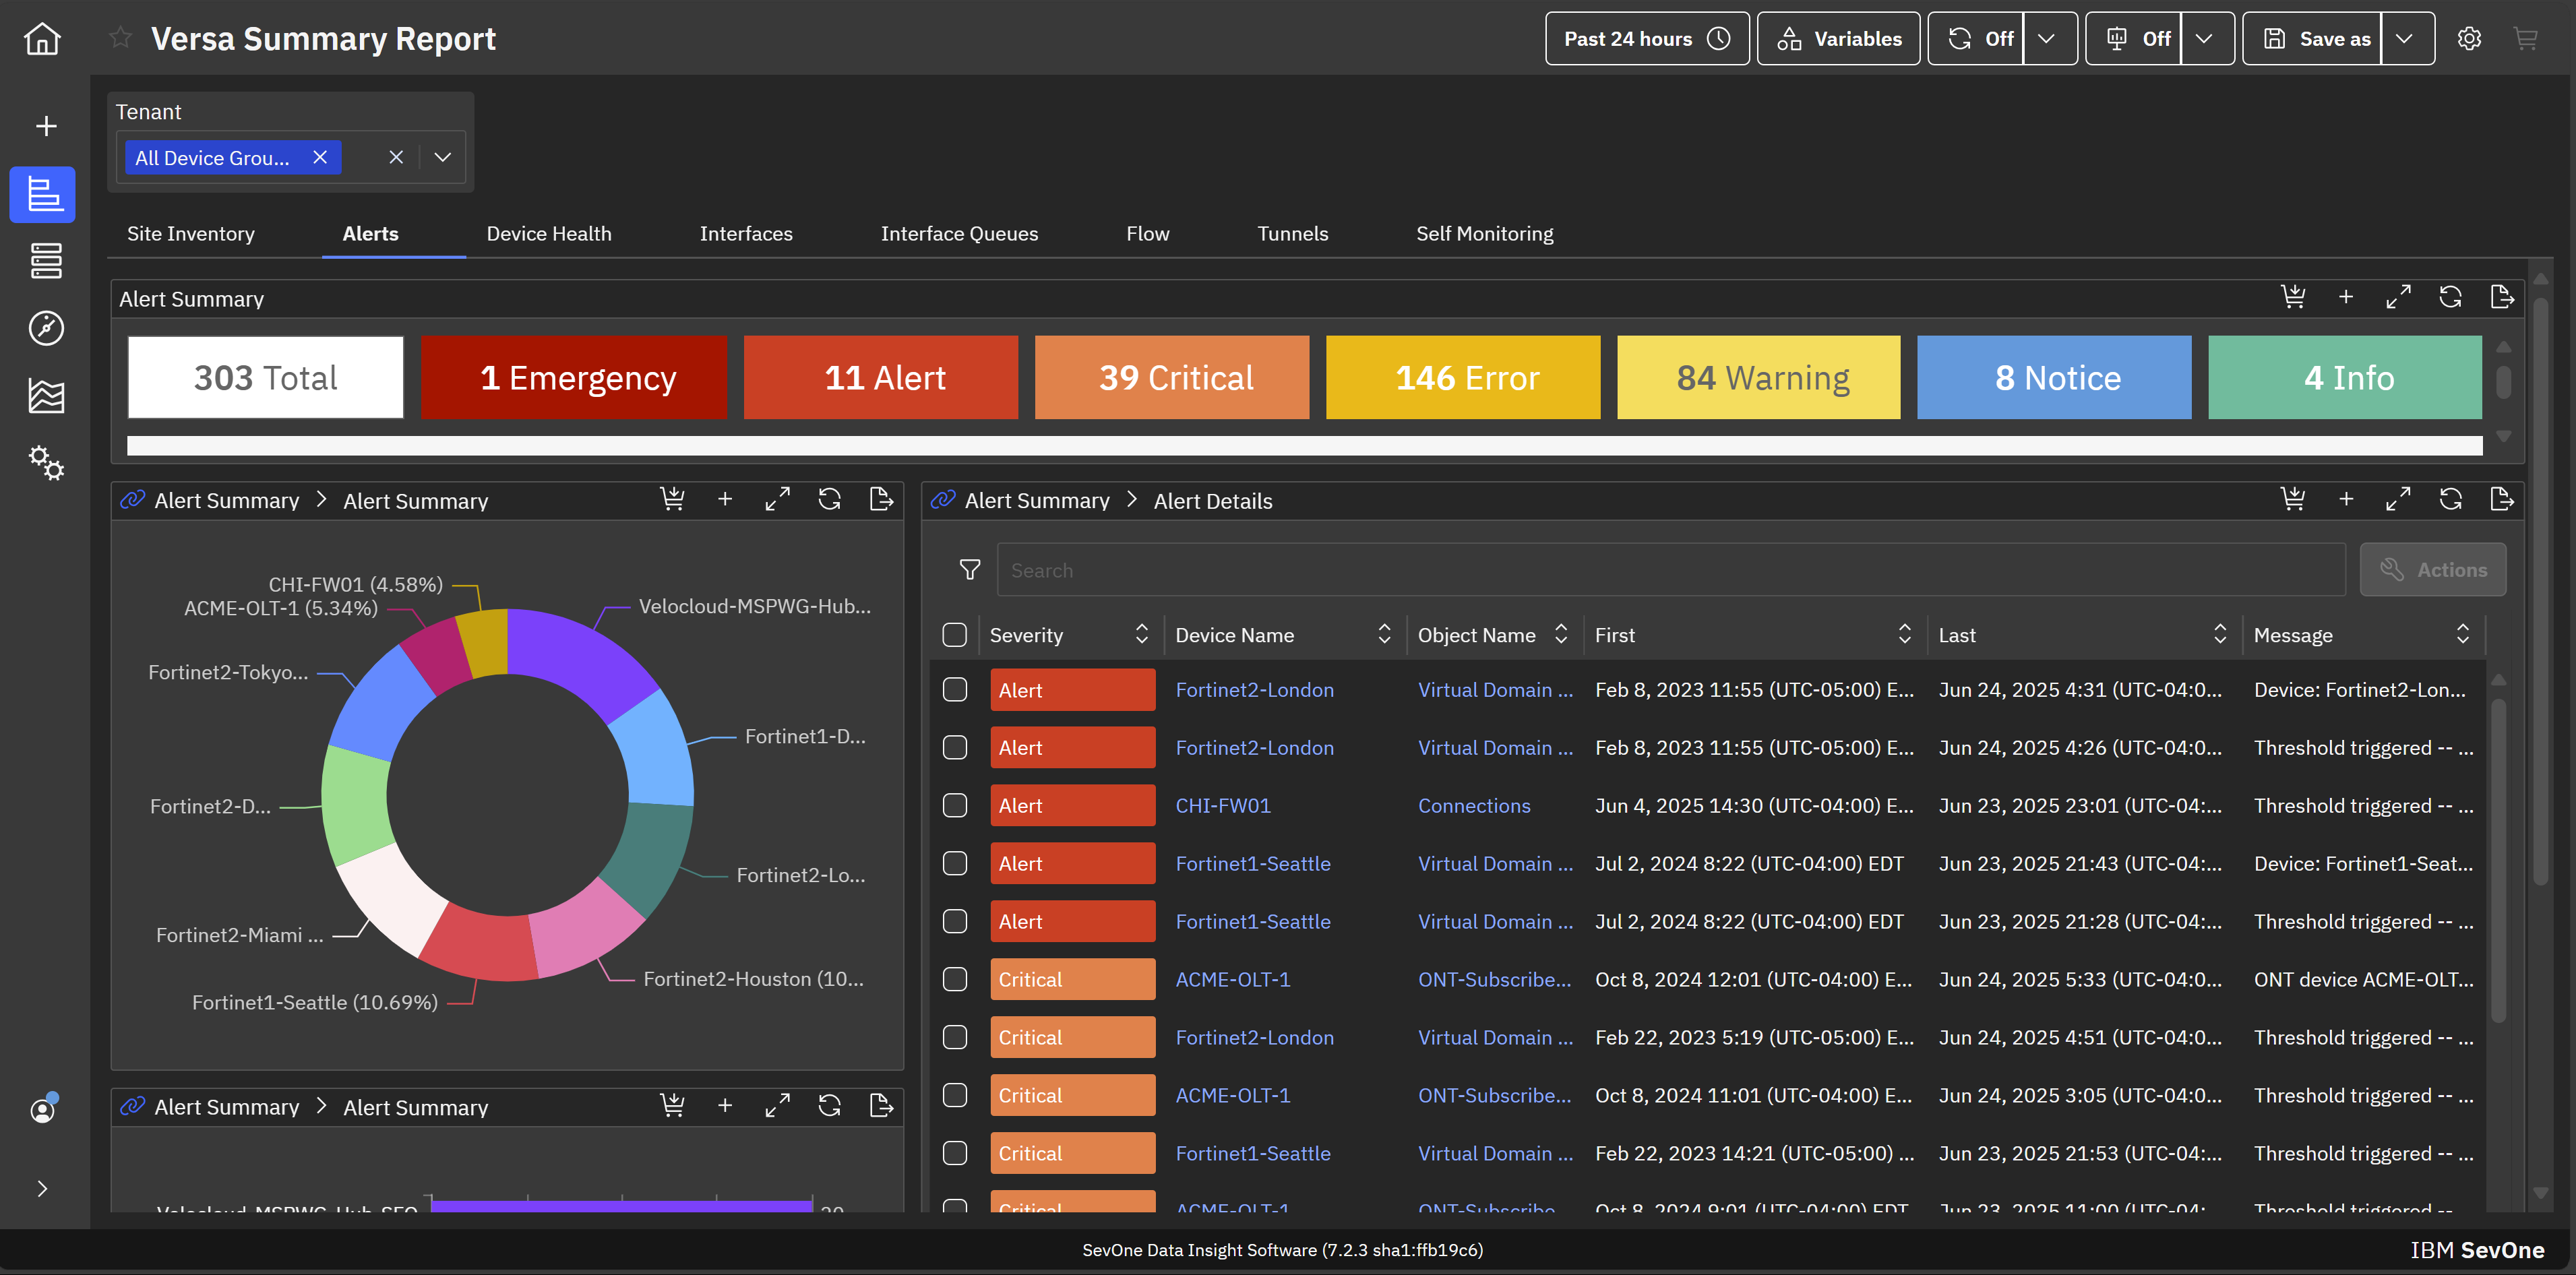
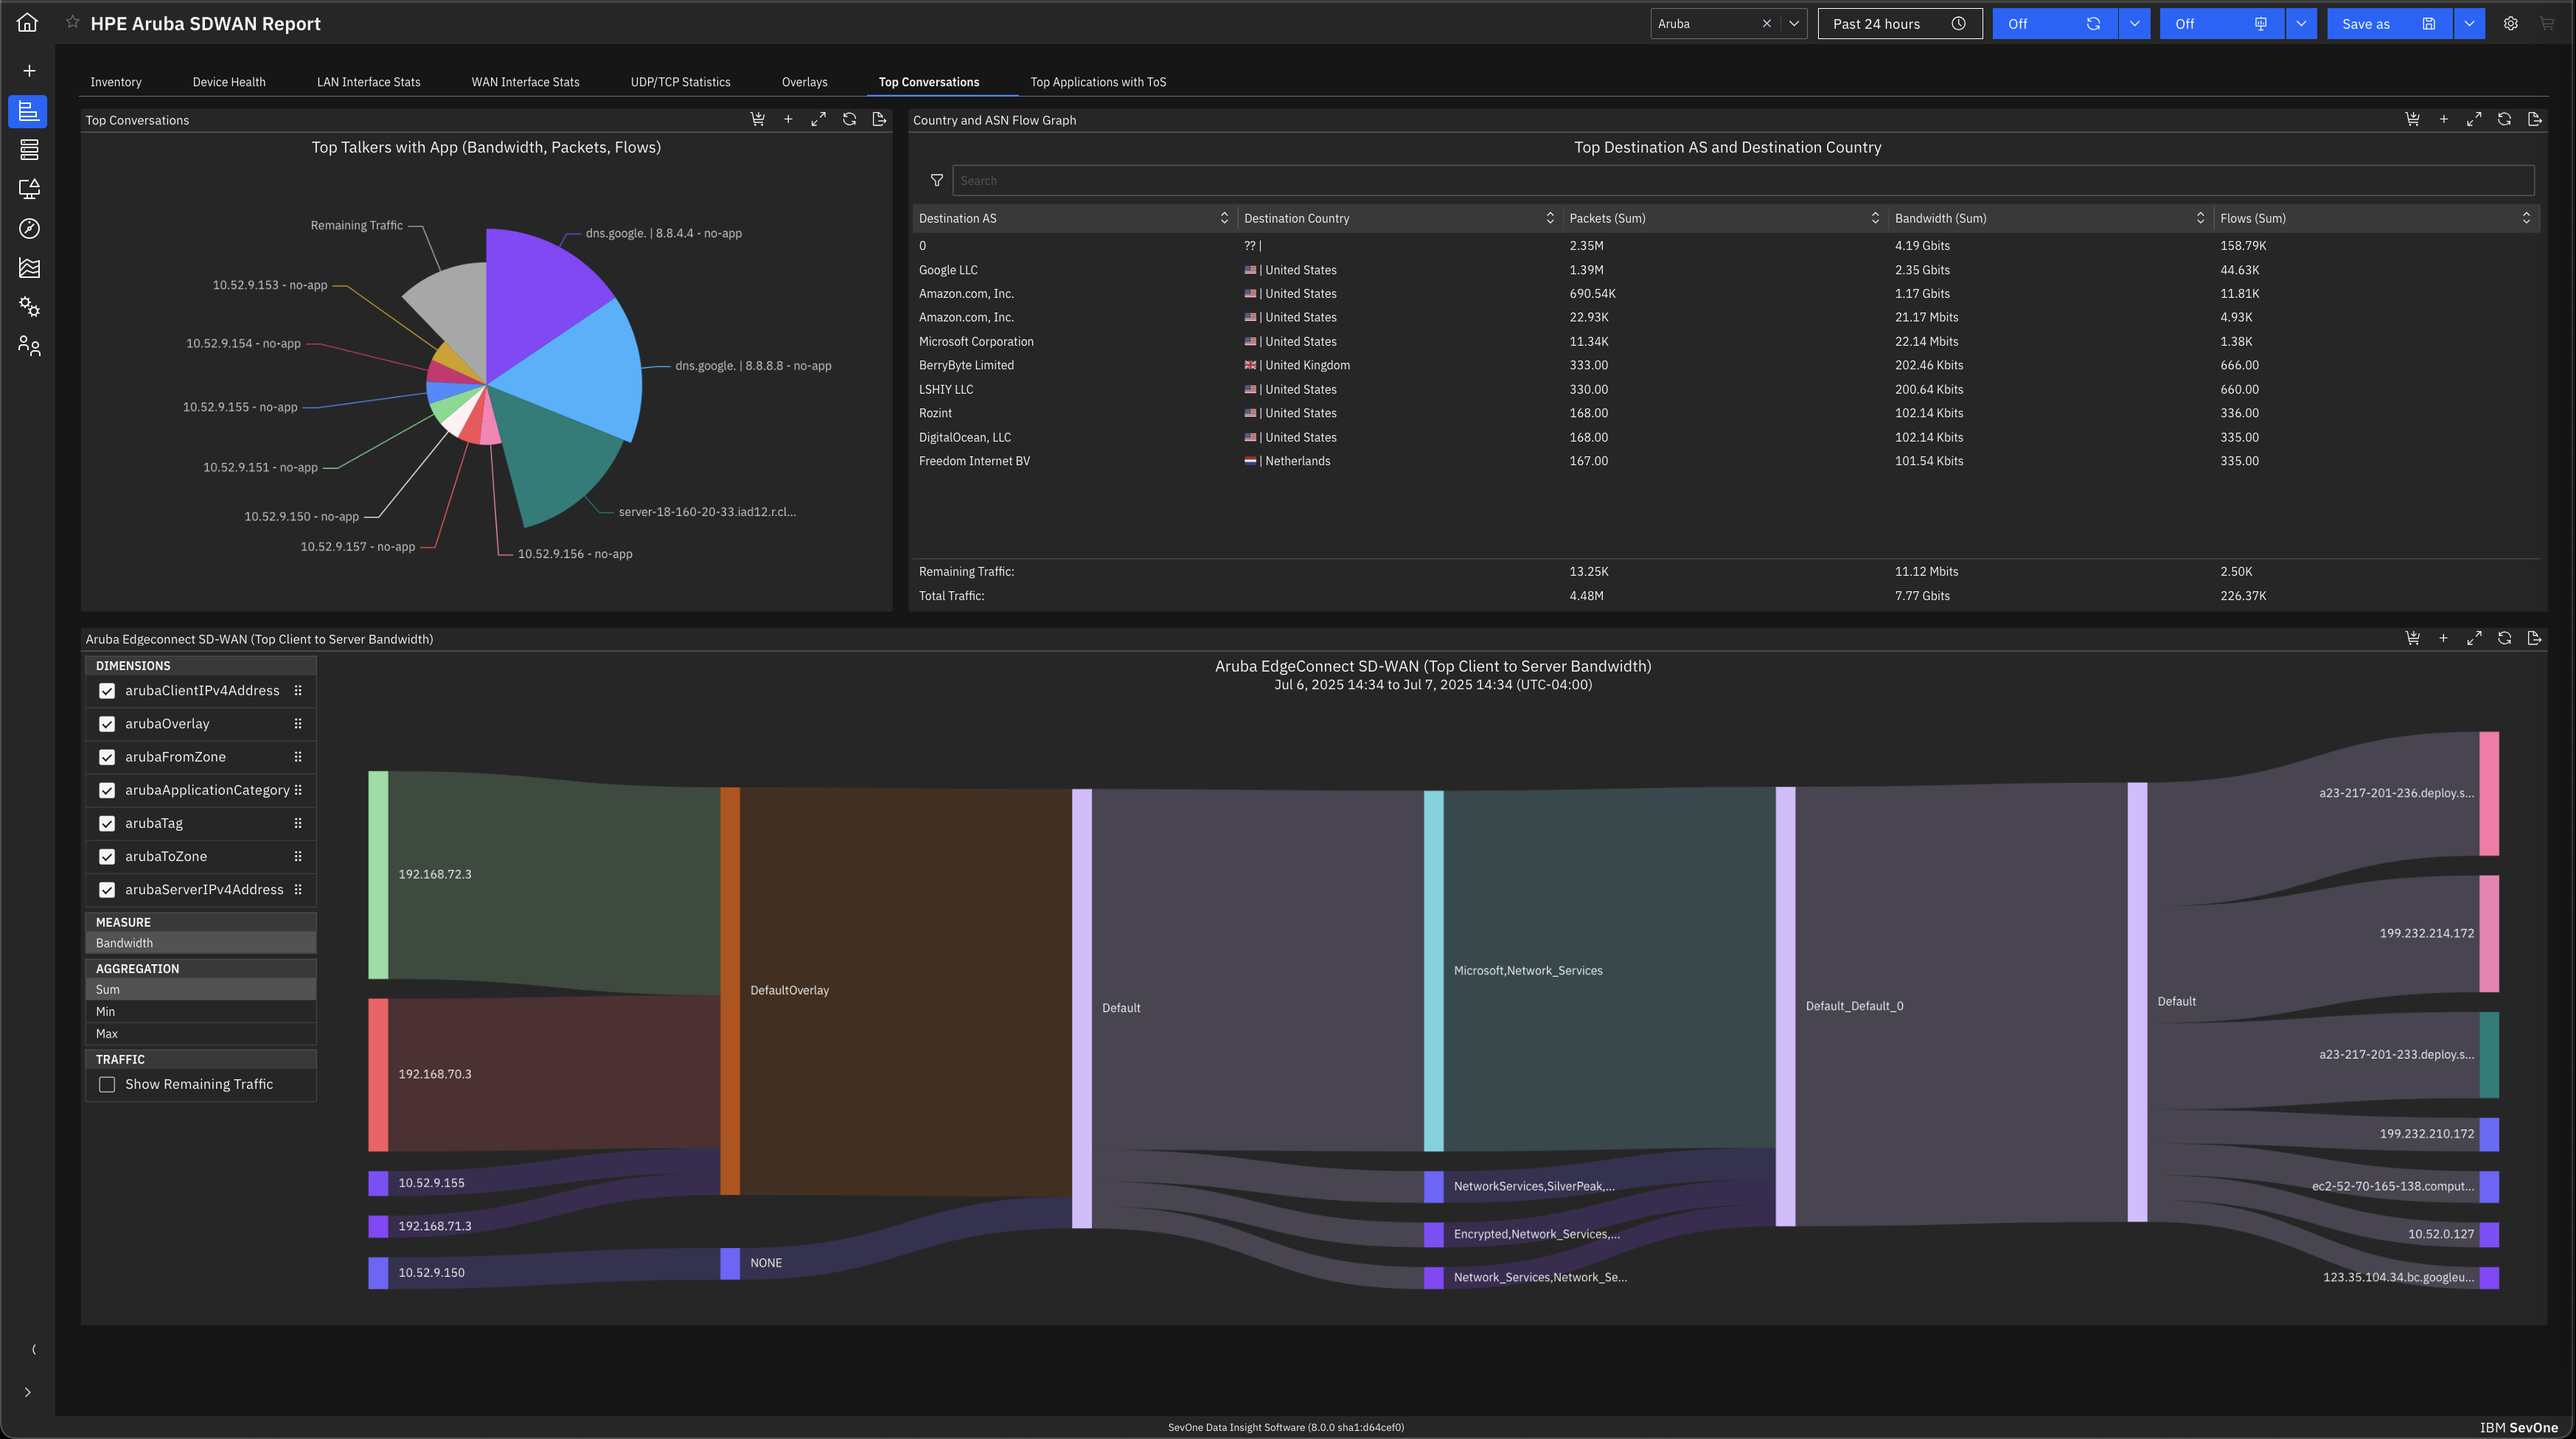
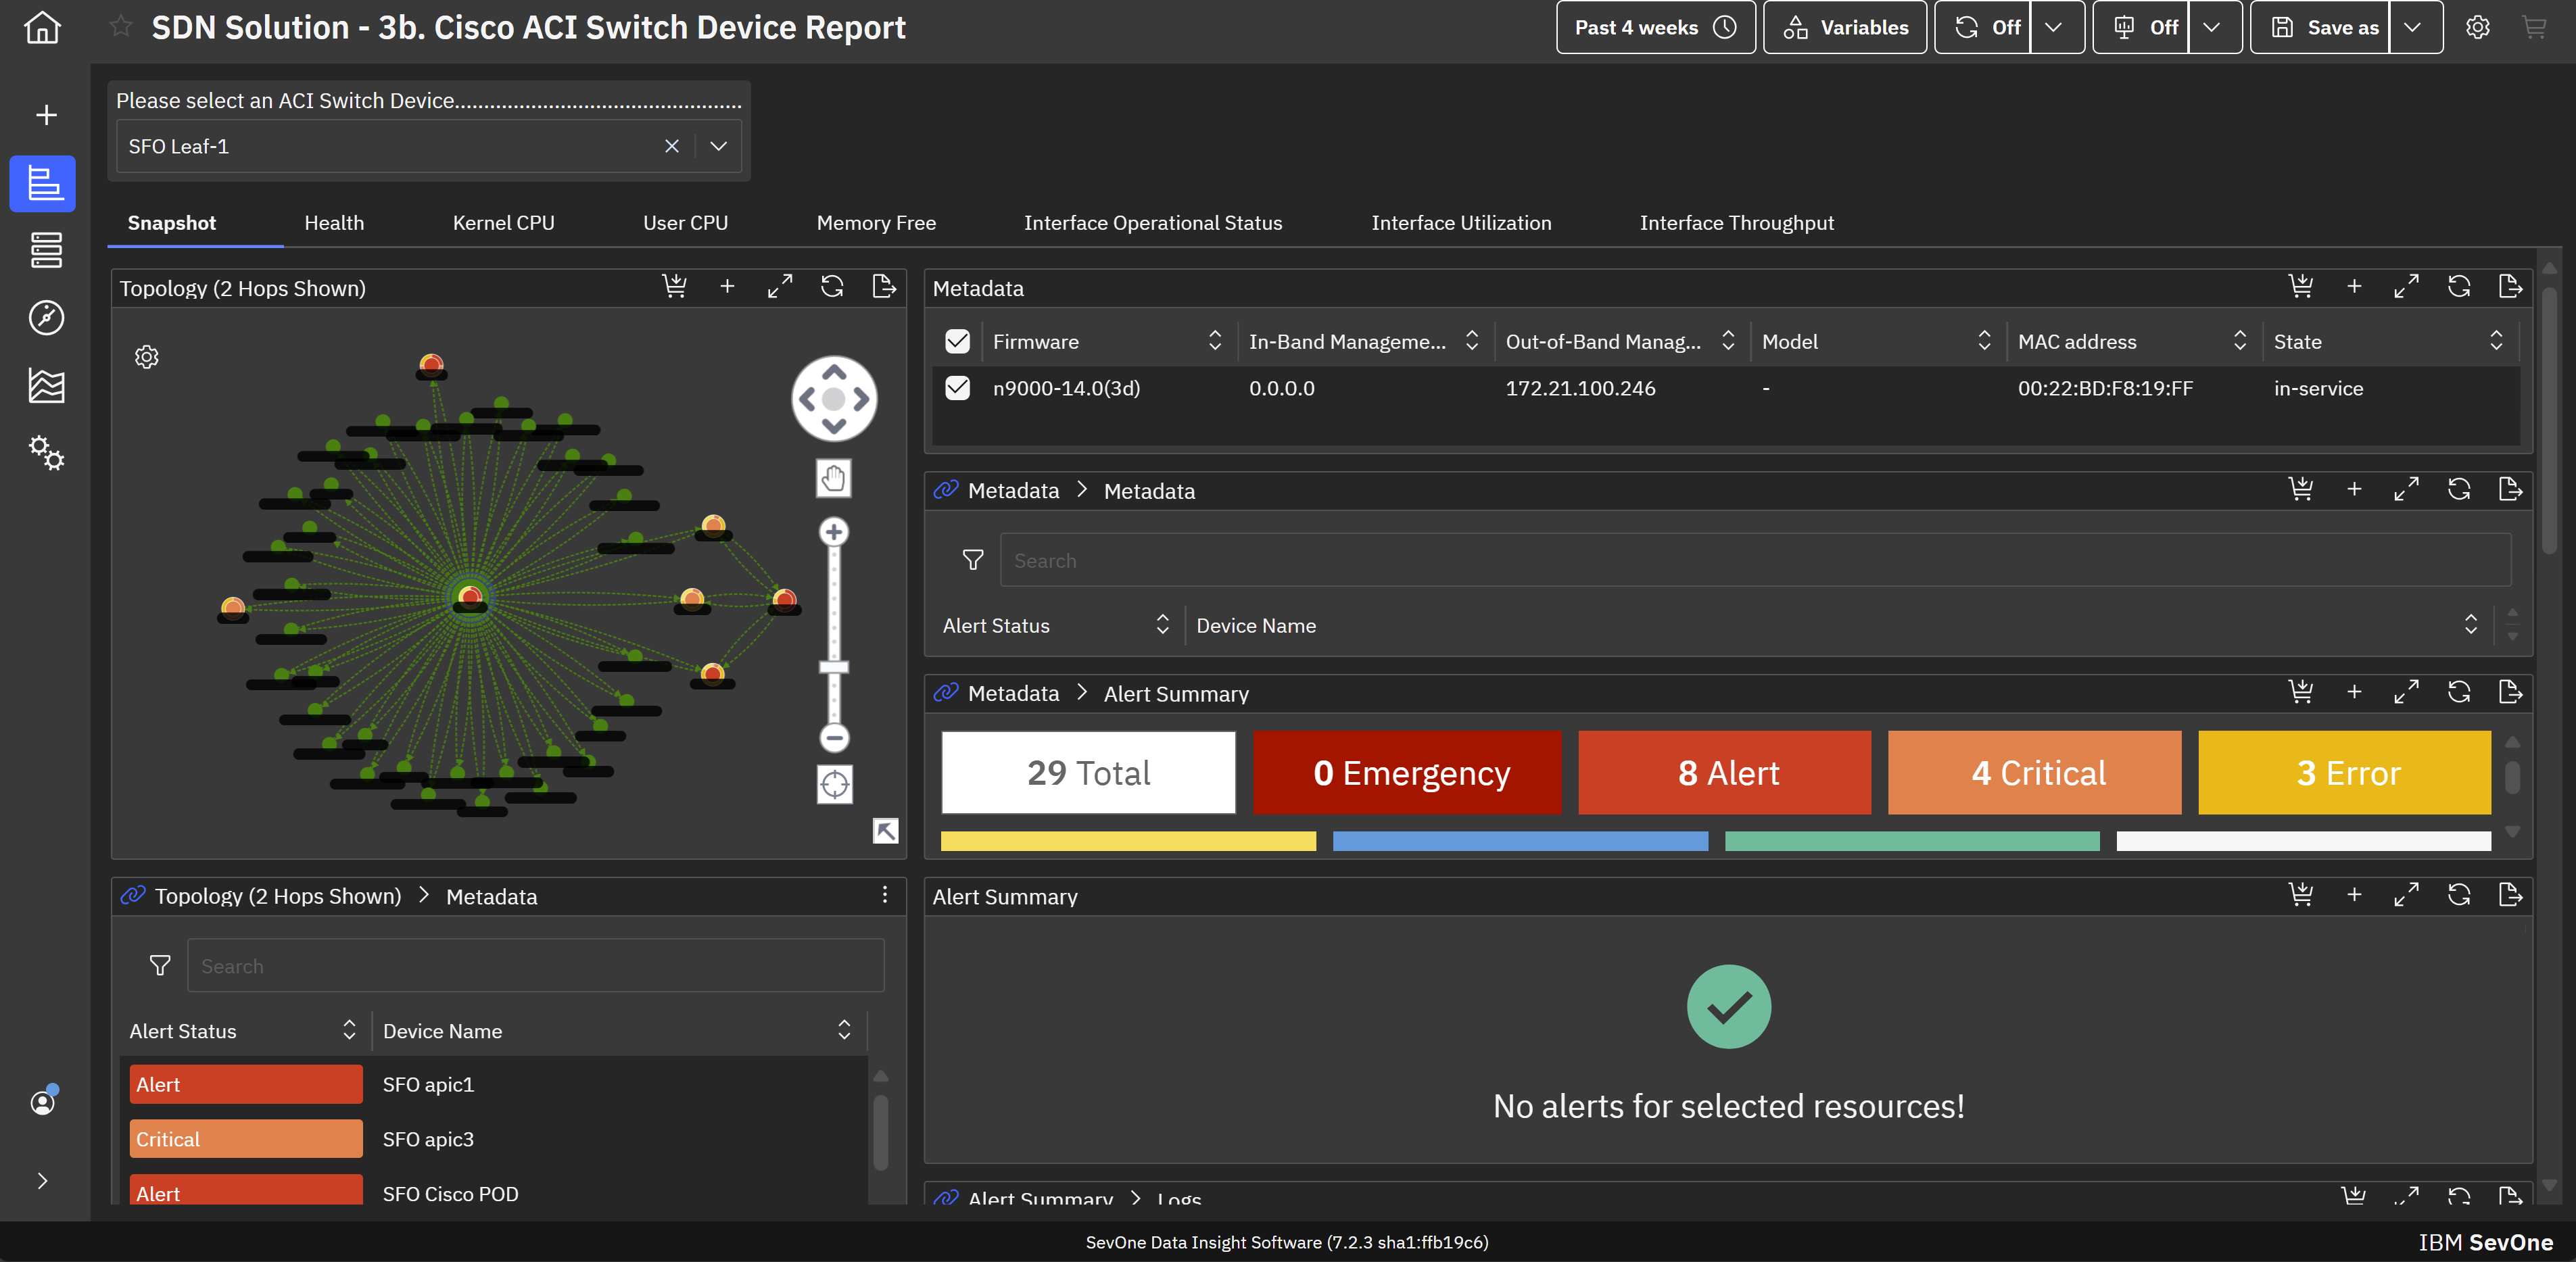
IBM SevOne’s app-centric, hybrid network observability empowers NetOps teams with ML-driven insights, enabling proactive issue prevention and resolution. With a single source of truth for network performance, it delivers visibility to optimize operations and support agility in complex, multi-cloud environments.
N/A
Nagios Core
Score 8.6 out of 10
N/A
Nagios provides monitoring of all mission-critical infrastructure components. Multiple APIs and community-build add-ons enable integration and monitoring with in-house and third-party applications for optimized scaling.
N/A
Pricing
IBM SevOne
Nagios Core
Editions & Modules
No answers on this topic
Single License
Free
Single License
Free
Offerings
Pricing Offerings
IBM SevOne
Nagios Core
Free Trial
No
Yes
Free/Freemium Version
No
Yes
Premium Consulting/Integration Services
No
No
Entry-level Setup Fee
No setup fee
No setup fee
Additional Details
IBM® SevOne® uses Managed Device (MD) and Managed Client Device (MCD) as pricing metrics. These can be mapped to managed devices for physical, virtualized and containerized functions in the managed environment.
—
More Pricing Information
Community Pulse
IBM SevOne
Nagios Core
Features
IBM SevOne
Nagios Core
Network Performance Monitoring
Comparison of Network Performance Monitoring features of Product A and Product B
The software is handy and really helps us track all the issues that may occur in our network, allowing us to rectify them before any significant problems with our server can arise. It also enhances the overall performance of all our servers and networks, but, as I mentioned earlier, it will take considerable time for a beginner to become familiar with every feature of the software.
Nagios is simply a very configurable and rock solid monitoring engine. For these reasons I would recommend it to any IT professional in any medium to large organization where creating custom checks and programming ones custom needs into the configuration is practical. I would be more hesitant to recommend it as a first monitoring solution for a small business which is usually accompanied by a less experienced and/or more time constrained admin.
Documentation for the embedded help pages in NMS and more. In my opinion, these do not provide anything of any depth or maybe anything helpful at all. If anything it just seems to be a guide of what actually exists on the page. It is nicely searchable documentation though.
It is very surprising and disappointing for us to learn that it isn't until the latest version of IBM SevOne that bulk editing was introduced. I think this is such a basic and foundational feature that should have been a part of the original rollout. My team is still trying to configure the REST API.
It was disappointing for the webinar to start with a speaker who had a thick accent and simply read from slides. To me, it felt hopeless until the second speaker, who was engaging and easy to understand. It's as if this fact wasn't considered. I'm sure the first speaker lost a lot of viewers who didn't stick around to discover the 2nd speaker.
I asked three different questions during the webinar and none were answered.
It's built by engineers for engineers so setting it up and configuring it is relatively complicated. It could really use a simplified configuration approach, or a GUI to set it up instead of editing config files.
I'd like to see the option to have service notification settings inherited from the host setting notifications. They have to be set up separately but they are often the same, so it would be nice to have less redundancy.
We're currently looking to combine a bunch of our network montioring solutions into a single platform. Running multiple unique solutions for monitoring, data collection, compliance reporting etc has become a lot to manage.
The Nagios UI is in need of a complete overhaul. Nice graphics and trendy fonts are easy on the eyes, but the menu system is dated, the lack of built in graphing support is confusing, and the learning curve for a new user is too steep.
I haven't had to use support very often, but when I have, it has been effective in helping to accomplish our goals. Since Nagios has been very popular for a long time, there is also a very large user base from which to learn from and help you get your questions answered.
IBM SevOne was selected instead of Datadog because it is perfect for large insurance networks and also connects trouble-free between the on-premise and cloud environments. Its alerts are in real-time, it offers comprehensive dashboards and it allows to gain a better grip on the network issues, thus helping to keep the downtime small and the operations well managed thanks to the good communication.
We have tested several other monitoring products which were able to monitor the basic matrix (Memory, DiskUsage, CPU%, UpTime, Running Service Status, Port 80 Up/Down). Although some offered far better UIs, they lacked the ability to monitor ANYTHING. Zabbix, being the only contender worthy of competing, is a good alternative to Nagios. We also tried Zenoss Core & OpenNMS which were good enough for non-Linux engineers to get started with. OP5 was another service-oriented monitoring solution we evaluated. Apart from Nagios, Consul is heavily used to monitor & register the micro-service systems & end-point URLs. Due to the time invested (9+years) in Nagios, we were able to get more components installed/configured easily than alternatives.
The software has made network monitoring simple and efficient by providing us with an integrated dashboard that give us a clear picture of our network infrastructure.
IBM SevOne has value for money. it is both time and expense saver.
Use of the software has enabled us to timely detect performance issues and solve them before they affect our IT infrastructures.
Use of the software has solved the issue of real-time network visibility.
With it being a free tool, there is no cost associated with it, so it's very valuable to an organization to get something that is so great and widely used for free.
You can set up as many alerts as you want without incurring any fees.