IBM Cognos is a full-featured business intelligence suite by IBM, designed for larger deployments. It comprises Query Studio, Reporting Studio, Analysis Studio and Event Studio, and Cognos Administration along with tools for Microsoft Office integration, full-text search, and dashboards.
$10
per month per user
ThoughtSpot
Score 8.2 out of 10
N/A
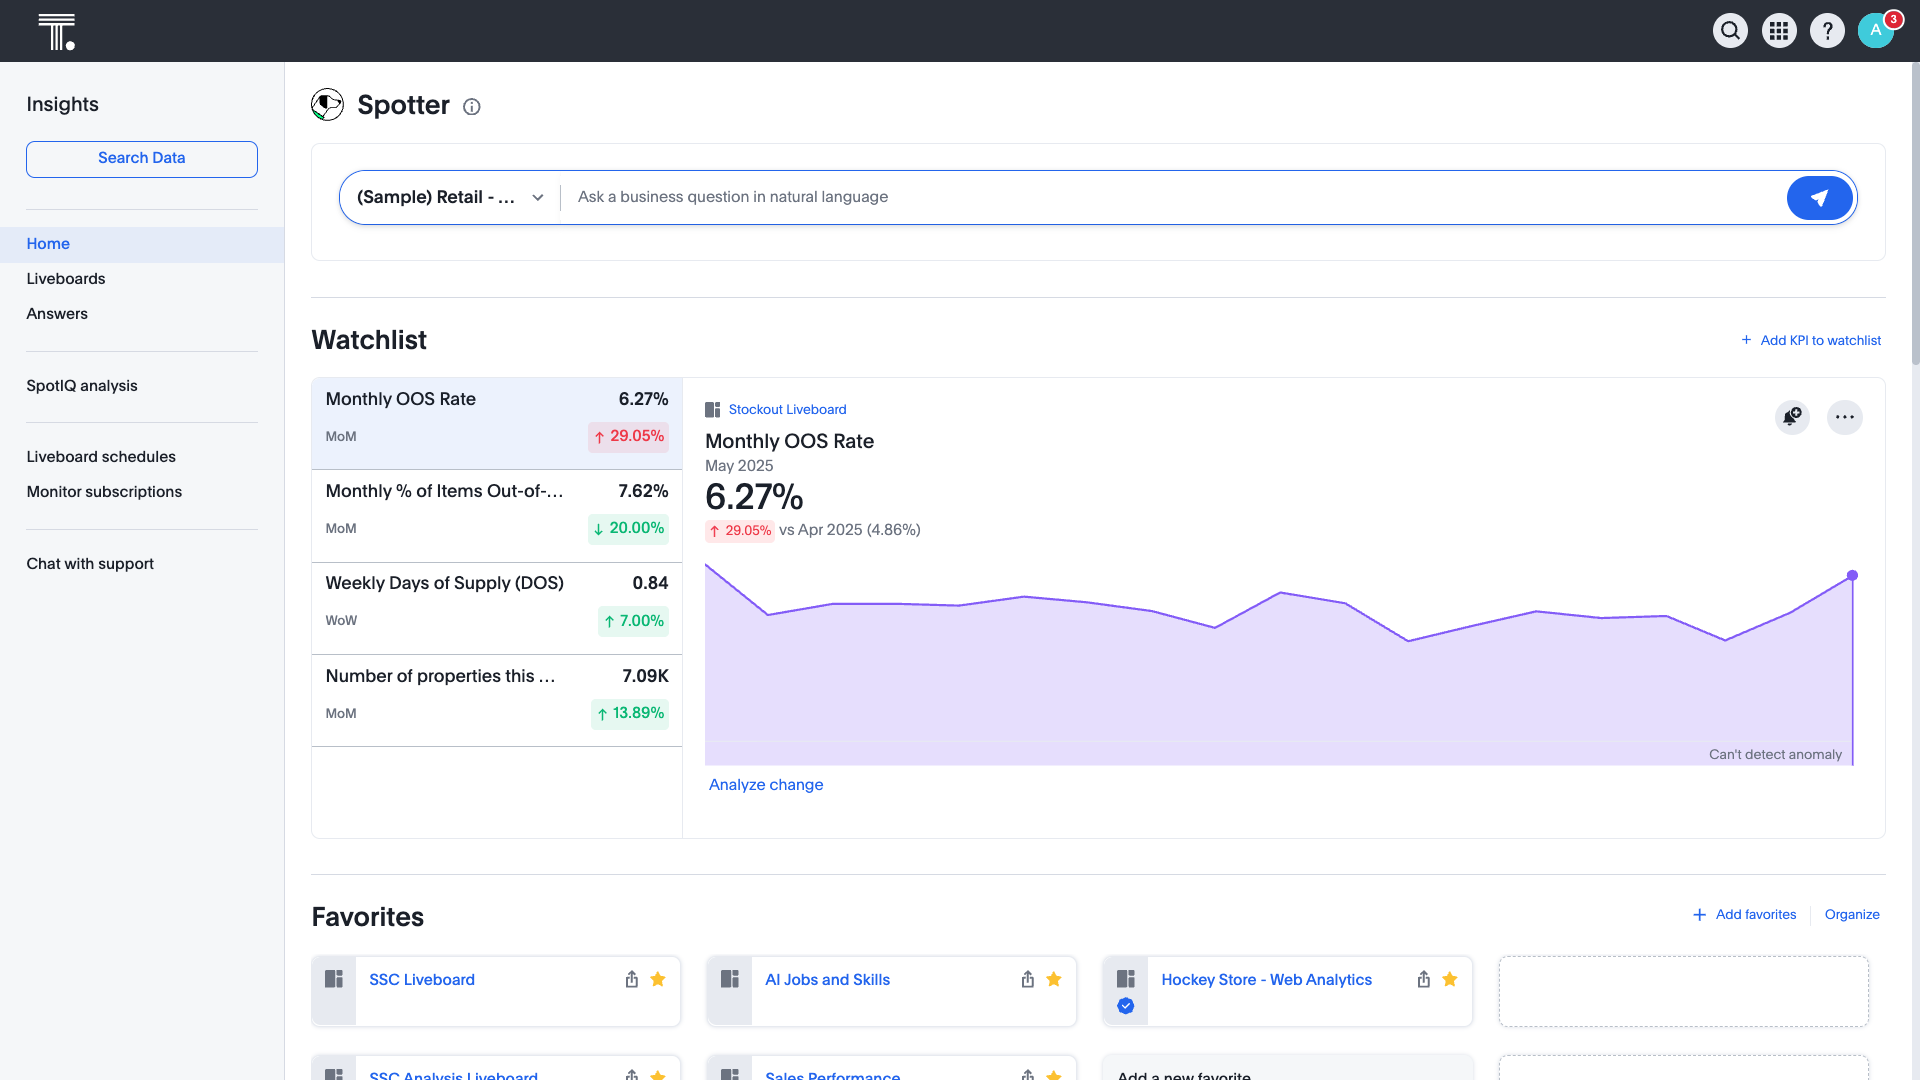
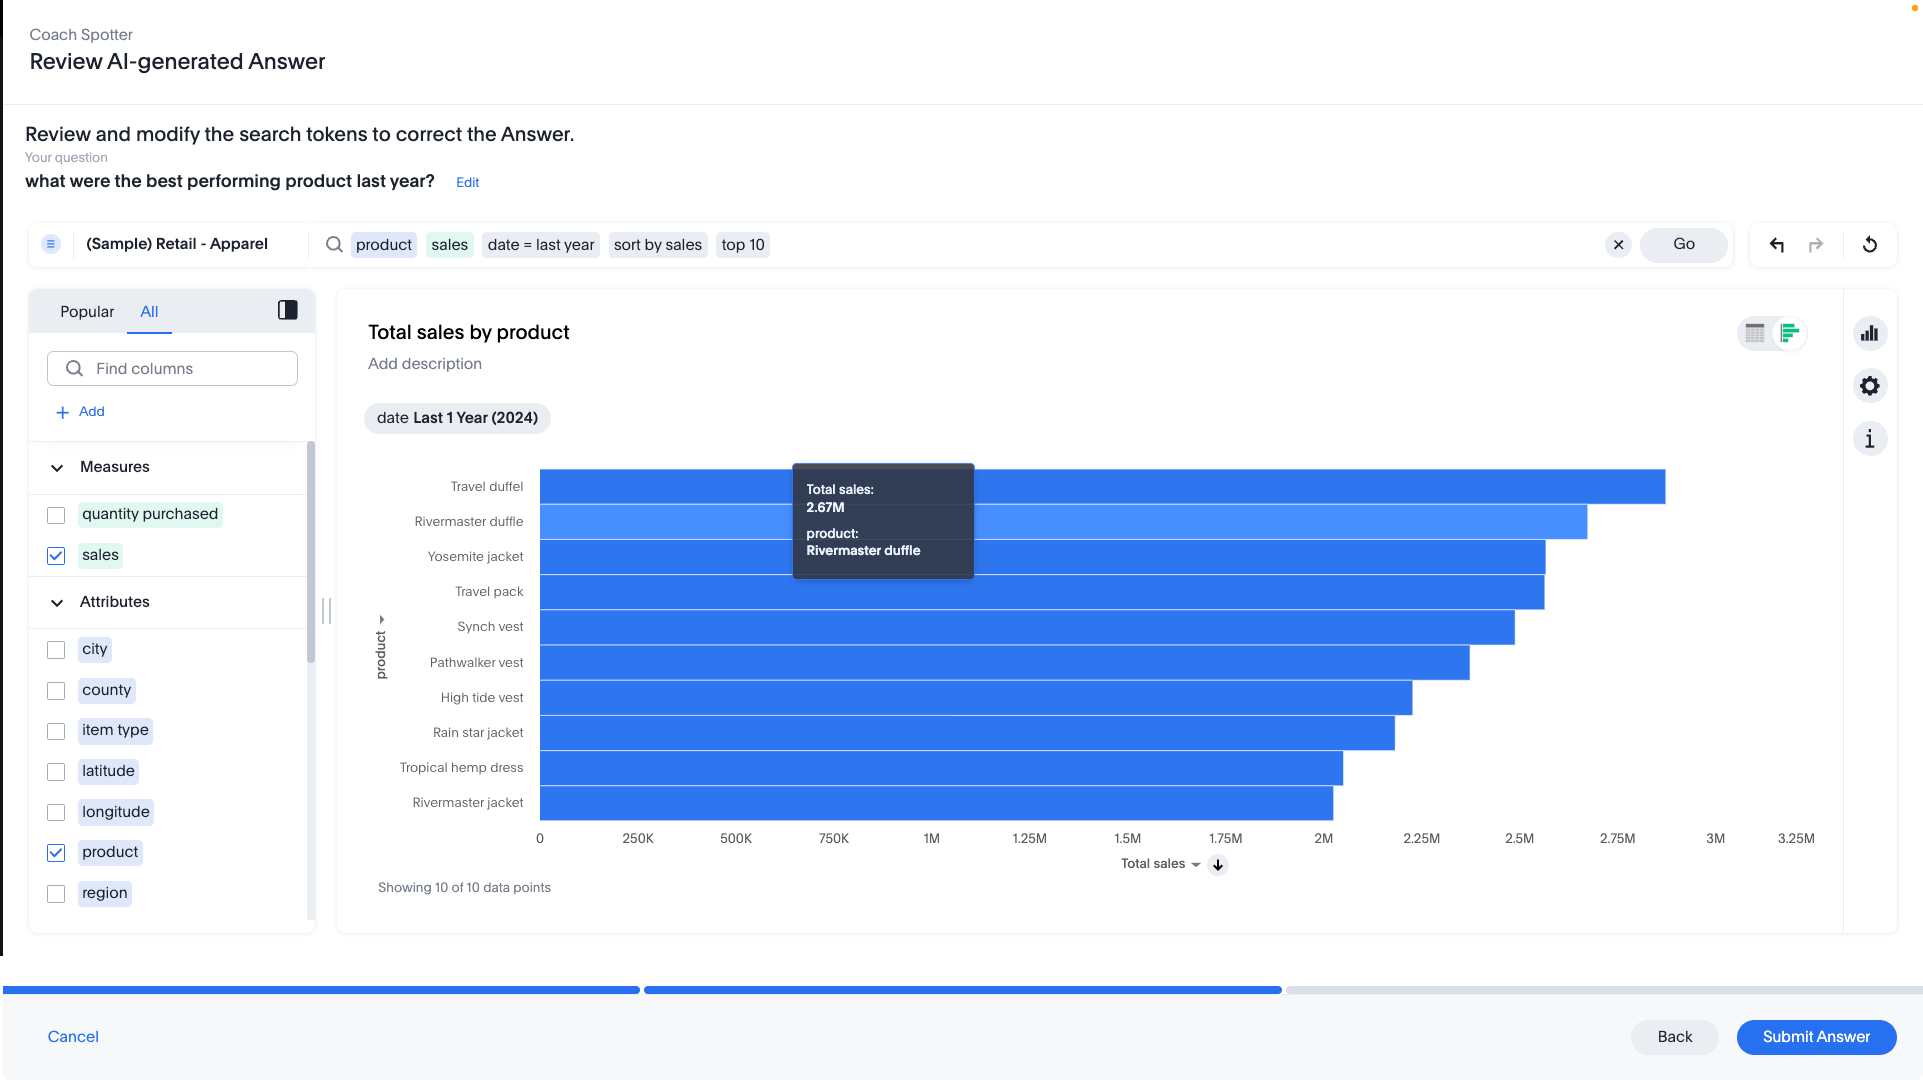
ThoughtSpot is an Agentic Analytics Platform for enterprises where users ask data questions using natural language and get answers with AI. Code-first for data teams and code-free for business users, ThoughtSpot can handle large, complex cloud data at scale.
$50
per month (billed annually) per user (25-1000 users)
Pricing
IBM Cognos Analytics
ThoughtSpot
Editions & Modules
On Demand - Standard
USD 10.00
per month per user
On Demand - Premium
USD 42.40
per month per user
On Demand - Standard
USD 10.60
per month per user
Thoughtspot Analytics - Pro
$50
per month (billed annually) per user (25-1000 users)
Thoughtspot Analytics - Enterprise
Custom
Offerings
Pricing Offerings
IBM Cognos Analytics
ThoughtSpot
Free Trial
Yes
Yes
Free/Freemium Version
No
Yes
Premium Consulting/Integration Services
No
No
Entry-level Setup Fee
Optional
Optional
Additional Details
—
—
More Pricing Information
Community Pulse
IBM Cognos Analytics
ThoughtSpot
Features
IBM Cognos Analytics
ThoughtSpot
BI Standard Reporting
Comparison of BI Standard Reporting features of Product A and Product B
IBM Cognos Analytics
7.0
Ratings
15% below category average
ThoughtSpot
7.6
Ratings
7% below category average
Pixel Perfect reports
6.70 Ratings
6.00 Ratings
Customizable dashboards
7.30 Ratings
8.90 Ratings
Report Formatting Templates
6.90 Ratings
7.70 Ratings
Ad-hoc Reporting
Comparison of Ad-hoc Reporting features of Product A and Product B
IBM Cognos Analytics
7.4
Ratings
8% below category average
ThoughtSpot
7.7
Ratings
5% below category average
Drill-down analysis
7.30 Ratings
9.00 Ratings
Formatting capabilities
7.00 Ratings
7.60 Ratings
Integration with R or other statistical packages
7.80 Ratings
5.40 Ratings
Report sharing and collaboration
7.30 Ratings
8.80 Ratings
Report Output and Scheduling
Comparison of Report Output and Scheduling features of Product A and Product B
IBM Cognos Analytics
7.8
Ratings
6% below category average
ThoughtSpot
8.8
Ratings
6% above category average
Publish to Web
8.30 Ratings
8.50 Ratings
Publish to PDF
7.00 Ratings
9.40 Ratings
Report Versioning
8.60 Ratings
7.90 Ratings
Report Delivery Scheduling
6.90 Ratings
9.10 Ratings
Delivery to Remote Servers
8.10 Ratings
8.90 Ratings
Data Discovery and Visualization
Comparison of Data Discovery and Visualization features of Product A and Product B
I use predictive analytics techniques, which can help me predict my future sales based on collected data, giving me insight into my market's trends.This market data can be analyzed, giving me the opportunity to gain in-depth insight into my market's competition and positioning it competitively, aided by developing strategies to improve my marketing approach.
By using the power of cloud platforms like bigquery or snowflake, ThoughtSpot can deliver performance at scale ensuring that even the largest organization can quickly analyze and visualize data. The ability to seamlessly share live dashboards fosters collaborations, ensuring everyone in the organization is working from the same data source and aligned in decision making.
Beautiful visualizations. The visuals are distinct, clean, and easy to discern from one another.
Intelligent querying functionality. When looking to manipulate the data, the search function makes it easy to manipulate the features in the data, along with aggregating them in the way you'd like.
Embedding! It has been a smooth process thus far for our product & technical teams to work with ThoughtSpot and bring it into our product.
It would be great if ThoughtSpot can add the feature to filter by clicking on visualizations. i.e if I click on a particular data point in the chart if the full dashboard can filter just for that particular data point.
Color coding the heatmap with different colors like green to orange to red.
It took my BI team one year to become productive at developing useful content on the IBM Cognos platform. After this year, the reports being developed for a client were stale and no longer relative to the ever changing needs of the business client. Given the same opportunity, I would select a platform that allows the team to quickly produce BI content. Fail fast and recover quickly!
We have had success with the initial use cases and there are more use cases that can receive return on investment. I don't give it a 10 because other products like Tableau are building functionality that may start to compete in the coming years.
We have a strong user base (3500 users) that are highly utilizing this tool. Basic users are able to consume content within the applied security model. We have a set of advanced users that really push the limits of Cognos with Report and Query Studio. These users have created a lot of personal content and stored it in 'My Reports'. Users enjoy this flexibility.
The tool is easy to use if you know what you are doing and looking for. I know as they work towards improvements and simple language it will become even easier, but as of now they are doing a great job but there is room for improvement.
Reports can typically be viewed through any browser that can access the server, so the availability is ultimately up to what the company utilizing it is comfortable with allowing, though report development tends to be more picky about browsers and settings as mentioned above. It also has an optional iPad app and general mobile browsing support, but dashboards lack the mobile compatibility. What keeps it from getting a higher score is the desktop tools that are vital to the development process. The compatibility with only Windows when the server has a wide range of compatibility can be a real sore point for a company that outfits its employees exclusively with Mac or Linux machines. Of course, if they are planning on outsourcing the development anyways, it's a rather moot point
Overall no major complaints but it doesn't handle DMR (Dimensionally Modeled for Relational) very well. DMR modelling is a capability that IBM Cognos Framework Manager provides allowing you to specify dimensional information for relational metadata and allows for OLAP-style queries. However, the capability is not very efficient and, for example, if I'm using only 2 columns on a 20-column model, the software is not smart enough to exclude 18 columns and the query side gets progressively larger and larger until it's effectively unusable.
Why is their web application not working as fast as you think it should? They never know, and it is always a a bunch of shots in the dark to find out. Trying to download software from them is like trying to find a book at the library before computers were invented.
I give it this meeting because the team is not only help able to help us in the current solutions but also amazing and taking feedback and feeding it back to their development team which includes more products and features into ThoughtSpot
Onsite training provided by IBM Cognos was effective and as expected. They did not perform training with our data which was a bit difficult for our end-users.
The online courses they offer are thorough and presented in such a way that someone who isn't already familiar with the general design methodologies used in this field will be capable of making a good design. The training environments are provided as a fully self contained virtual machine with everything needed already to create the environments. We've had some persisting issues with the environments becoming unavailable, but support has been responsive when these issues arise and straightening them out for us
The implementation was handled very well. The initial implementation exposed a lot of disagreement between our campuses and departments as to how we define data. This was not entirely unexpected, but I thought that we did a nice job as a team to work through some of these challenges.
Power BI is stronger for quick ad-hoc analysis and dashboards, but IBM Cognos Analytics is better when consistency, precision, and mass distribution matter. Tableau is best for interactive analysis, while IBM Cognos Analytics is better for standardized, repeatable enterprise reporting. Sigma shines for customizable dashboards and drill-down analysis while IBM Cognos Analytics holds an edge in data discovery and visualization.
It is more flexible and PowerBI, easier work online, and share information with many users. Also the dashboards and beautiful, and the user experience is better. Performance used to be faster. We use Looker for different use cases but, when it comes to reporting and sharing information, ThoughSpot is much better.
The Cognos architecture is well suited for scalability. However, the architecture must be designed with scalability in mind from day one of the implementation. We recently upgraded from 10.1 to 10.2.1 and took the opportunity to revamp our architecture. It is now poised for future growth and scalability.
Because it is very reliable, inside the situation, we need strong internet connection to access a lot of data but easily never had any downtime except during the upgrades
Time to market ROI is massive vs hiring the full-time dedicated team to build and maintain a frontend multi-tenant SaaS data viz product.
It will be interesting to see over time how the advanced features play out in terms of usability and end value, such as Natural Search, which we are very excited about, and the machine learning tools.