HCL Vector Analytics Database vs. Network Perspective
HCL Vector Analytics Database vs. Network Perspective
| Product | Rating | Most Used By | Product Summary | Starting Price |
|---|---|---|---|---|
 HCL Vector Analytics Database | N/A | Vector, an analytics database, handles continuous updates without a performance penalty. Vector is designed to achieve extreme performance with full ACID compliance on commodity hardware with the flexibility to deploy on-premises, and on AWS, Azure, and Google Cloud with little or no database tuning. | N/A | |
 Network Perspective | Enterprise companies (1,001+ employees) | Network Perspective's platform is an analytical software giving leaders data with actionable insights about teams' collaboration habits to decrease workload and boost well-being in the new reality. The platform syncs with collaboration and communication tools (G-Suite, Jira, Slack etc.) and aims to analyze in an ethical, impactful way teams' work patterns across six dimensions: meetings, deep work, and context switching time, intra-team bonding, cross-team… | N/A |
| HCL Vector Analytics Database | Network Perspective | |||||||||||||||
|---|---|---|---|---|---|---|---|---|---|---|---|---|---|---|---|---|
| Editions & Modules | No answers on this topic | No answers on this topic | ||||||||||||||
| Offerings |
| |||||||||||||||
| Entry-level Setup Fee | No setup fee | No setup fee | ||||||||||||||
| Additional Details | — | — | ||||||||||||||
| More Pricing Information | ||||||||||||||||
| HCL Vector Analytics Database | Network Perspective | |
|---|---|---|
| Small Businesses |  SingleStore Score 7.6 out of 10 |  Rippling Score 9.0 out of 10 |
| Medium-sized Companies |  Alteryx Platform Score 8.9 out of 10 |  Predictive Index Behavioral Assessment Score 6.4 out of 10 |
| Enterprises |  IBM Z Score 9.3 out of 10 | Predictive Index Behavioral Assessment Score 6.4 out of 10 |
| All Alternatives | View all alternatives | View all alternatives |
| HCL Vector Analytics Database | Network Perspective | |
|---|---|---|
| ScreenShots | Network Perspective Screenshots 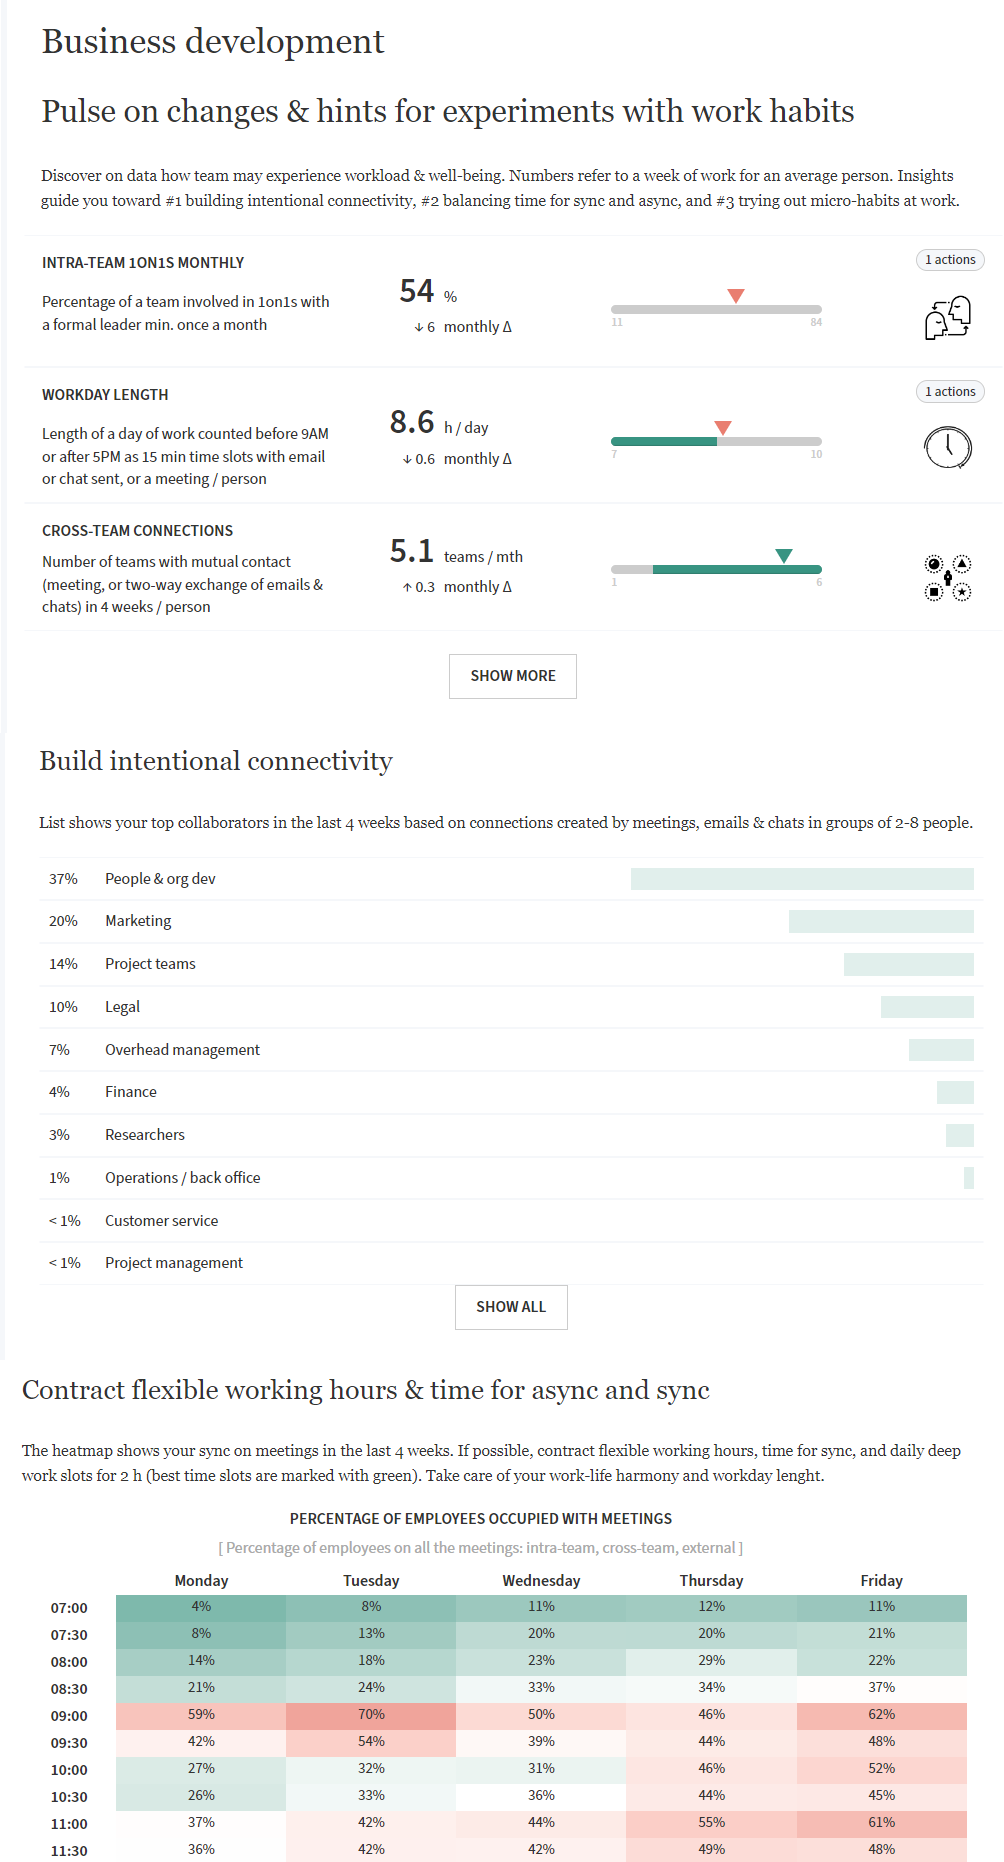 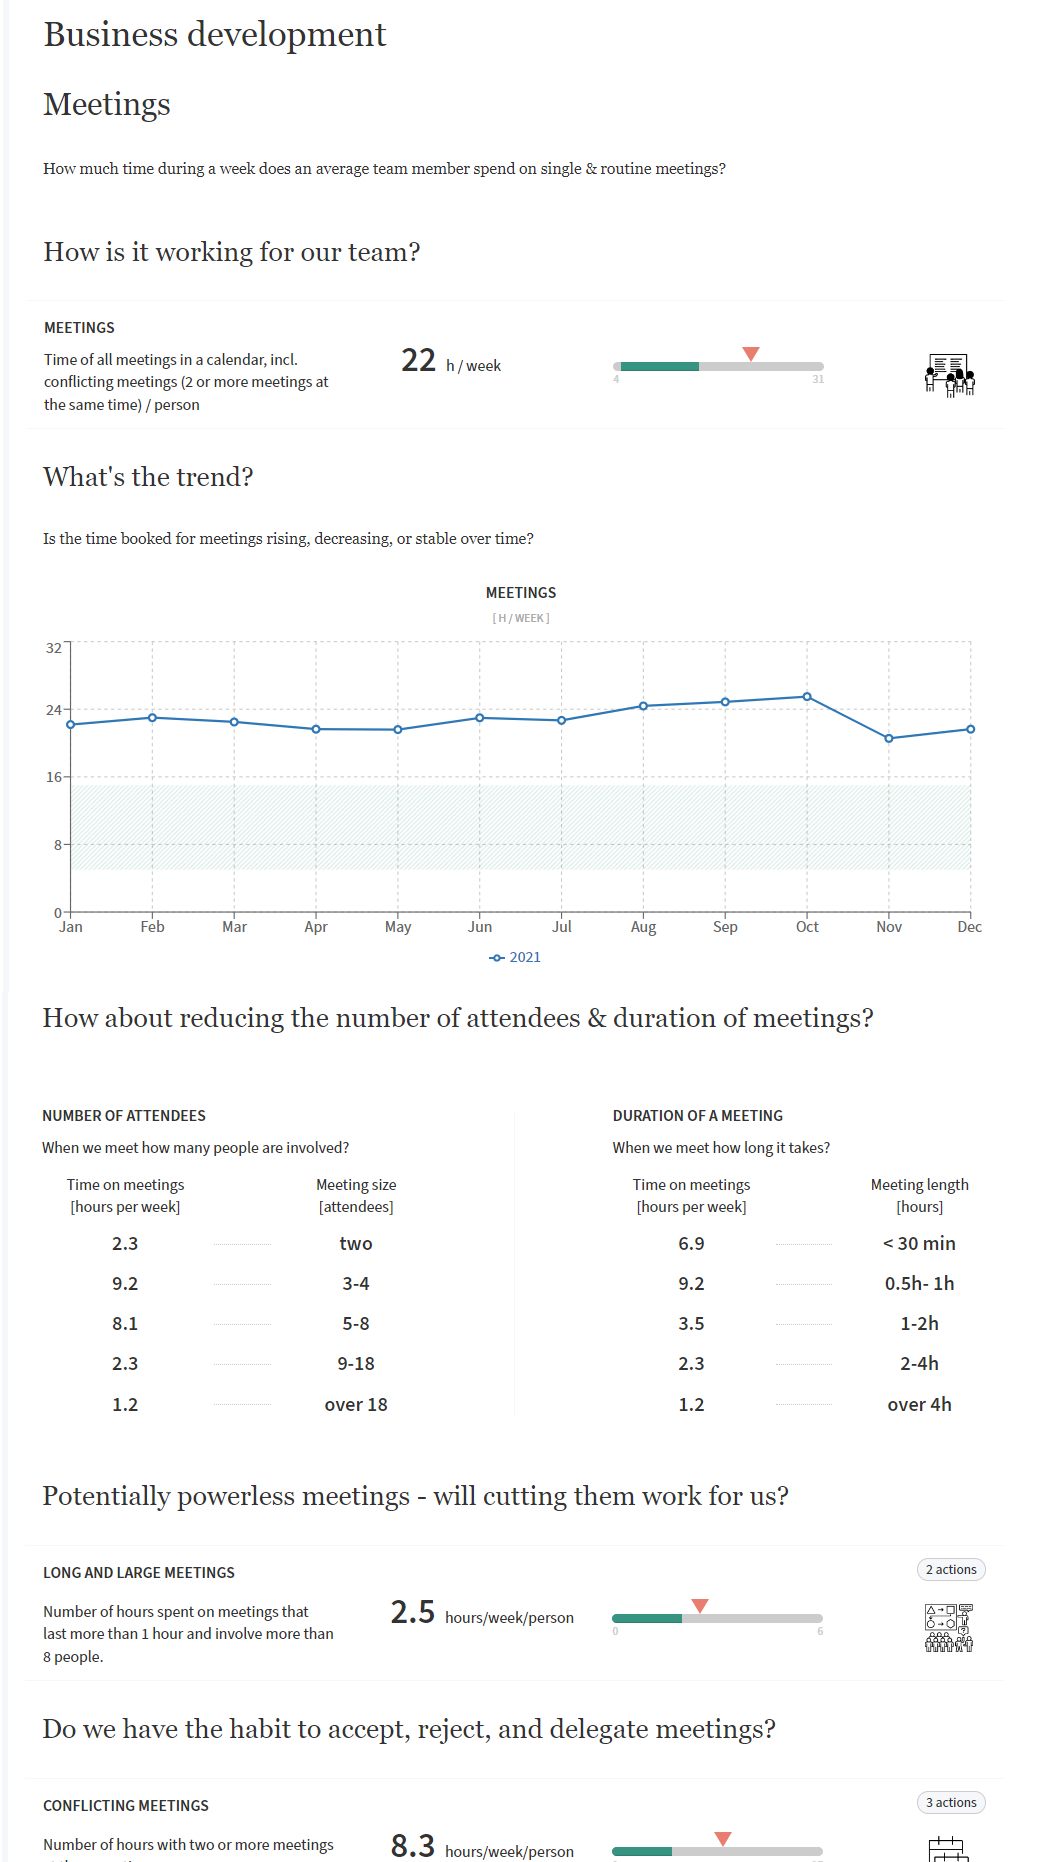  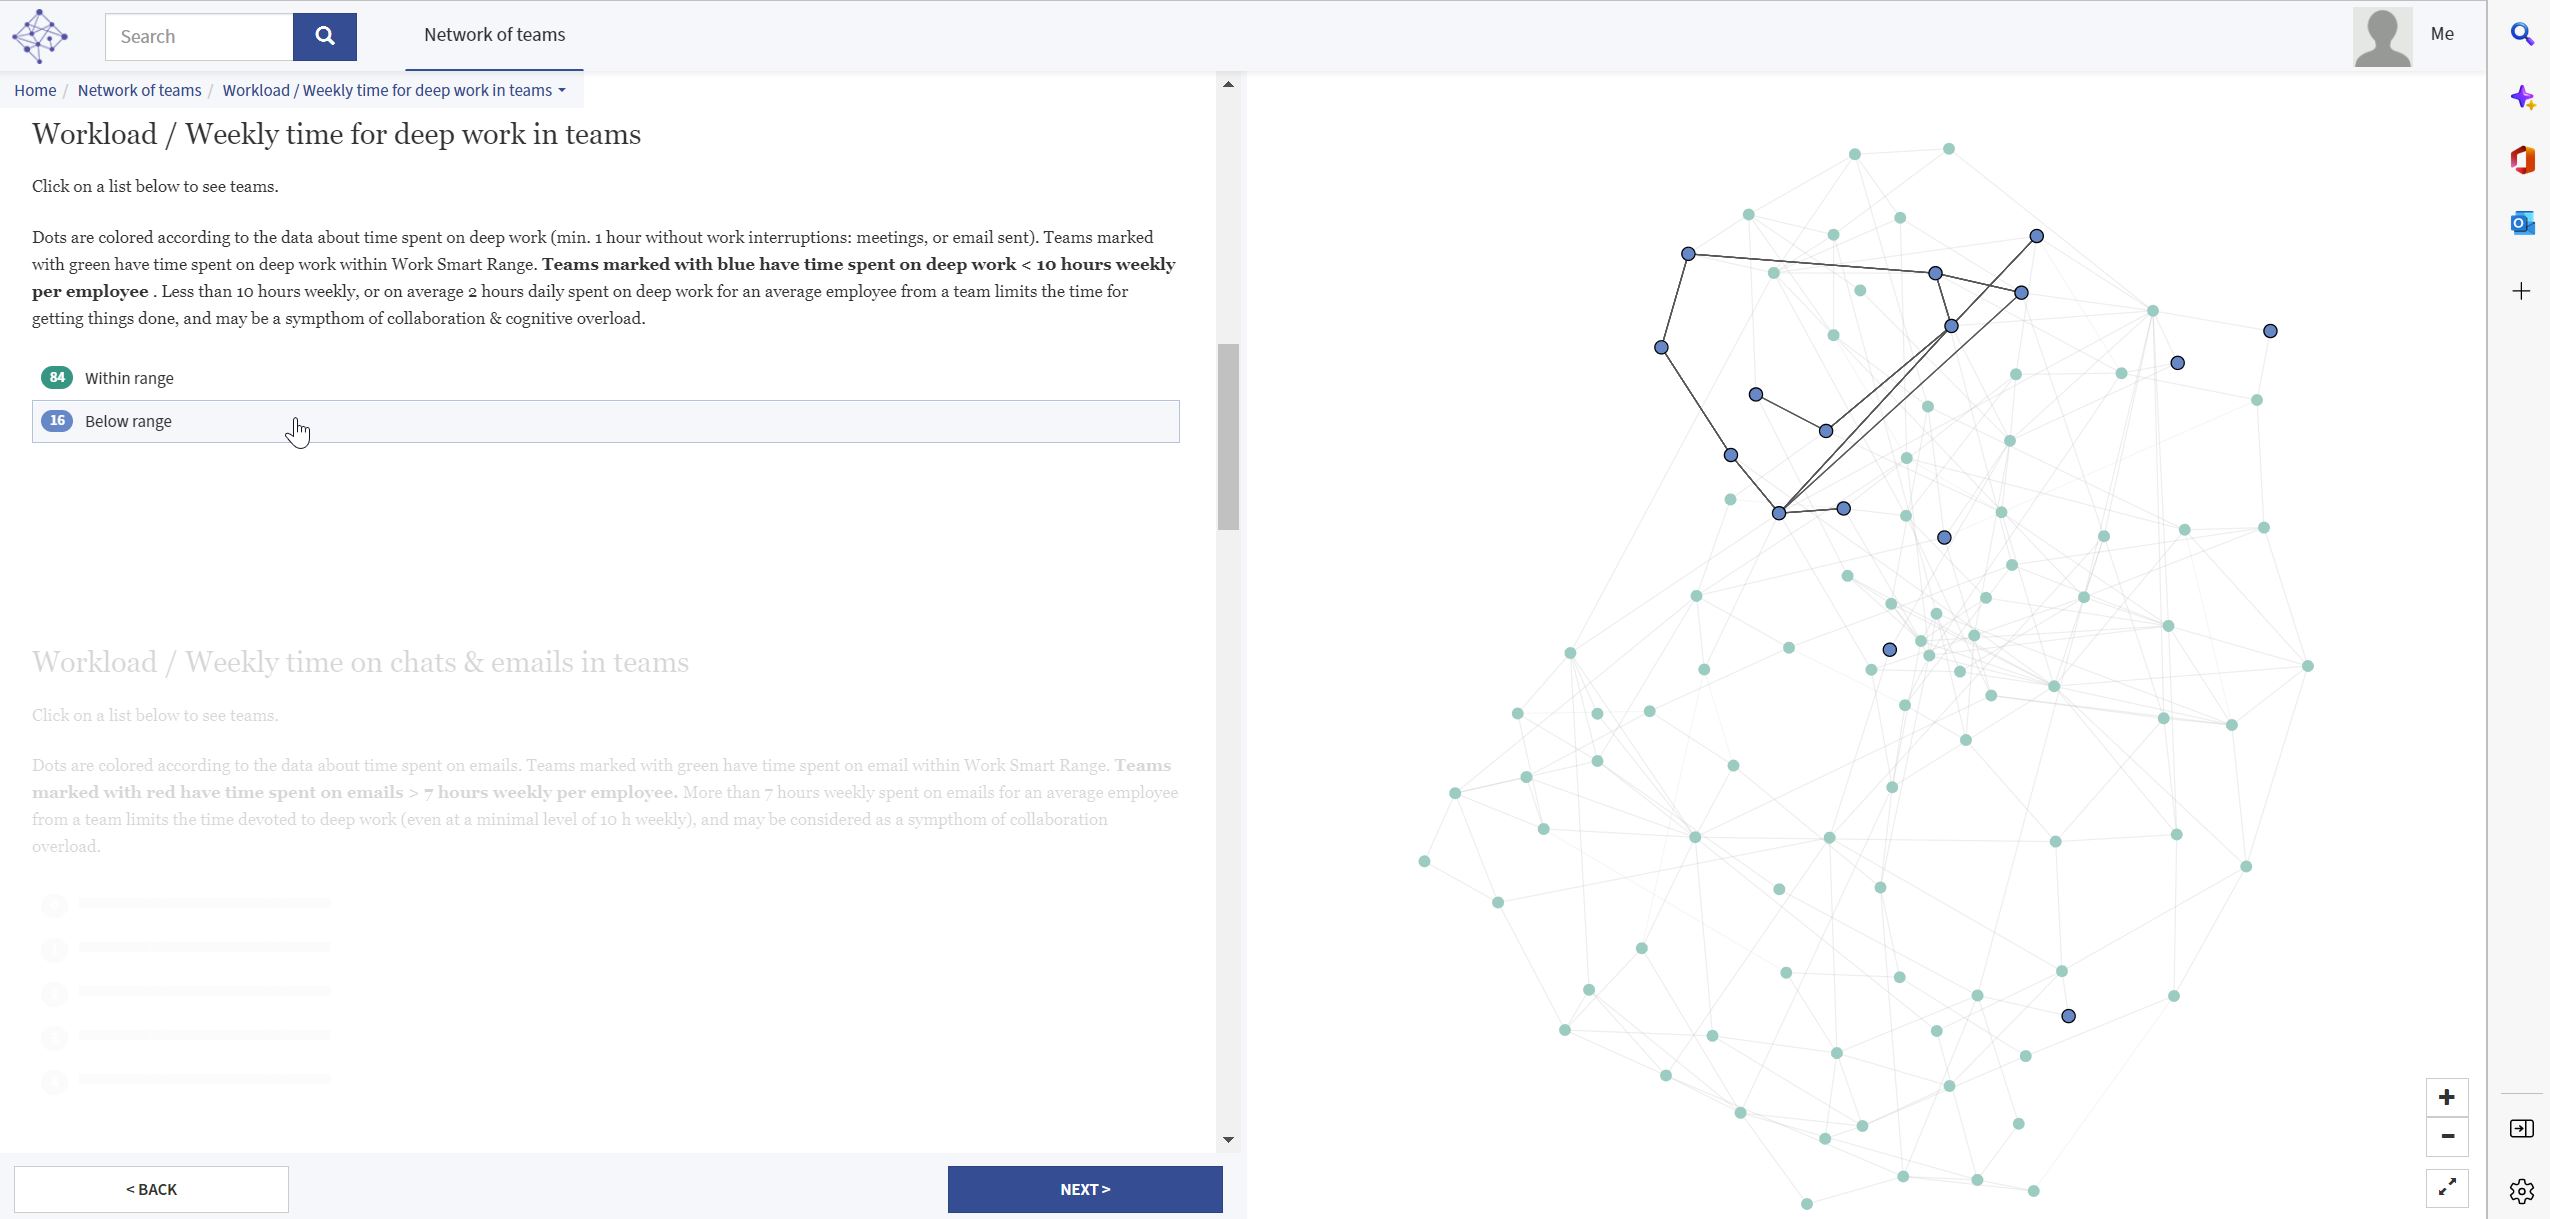 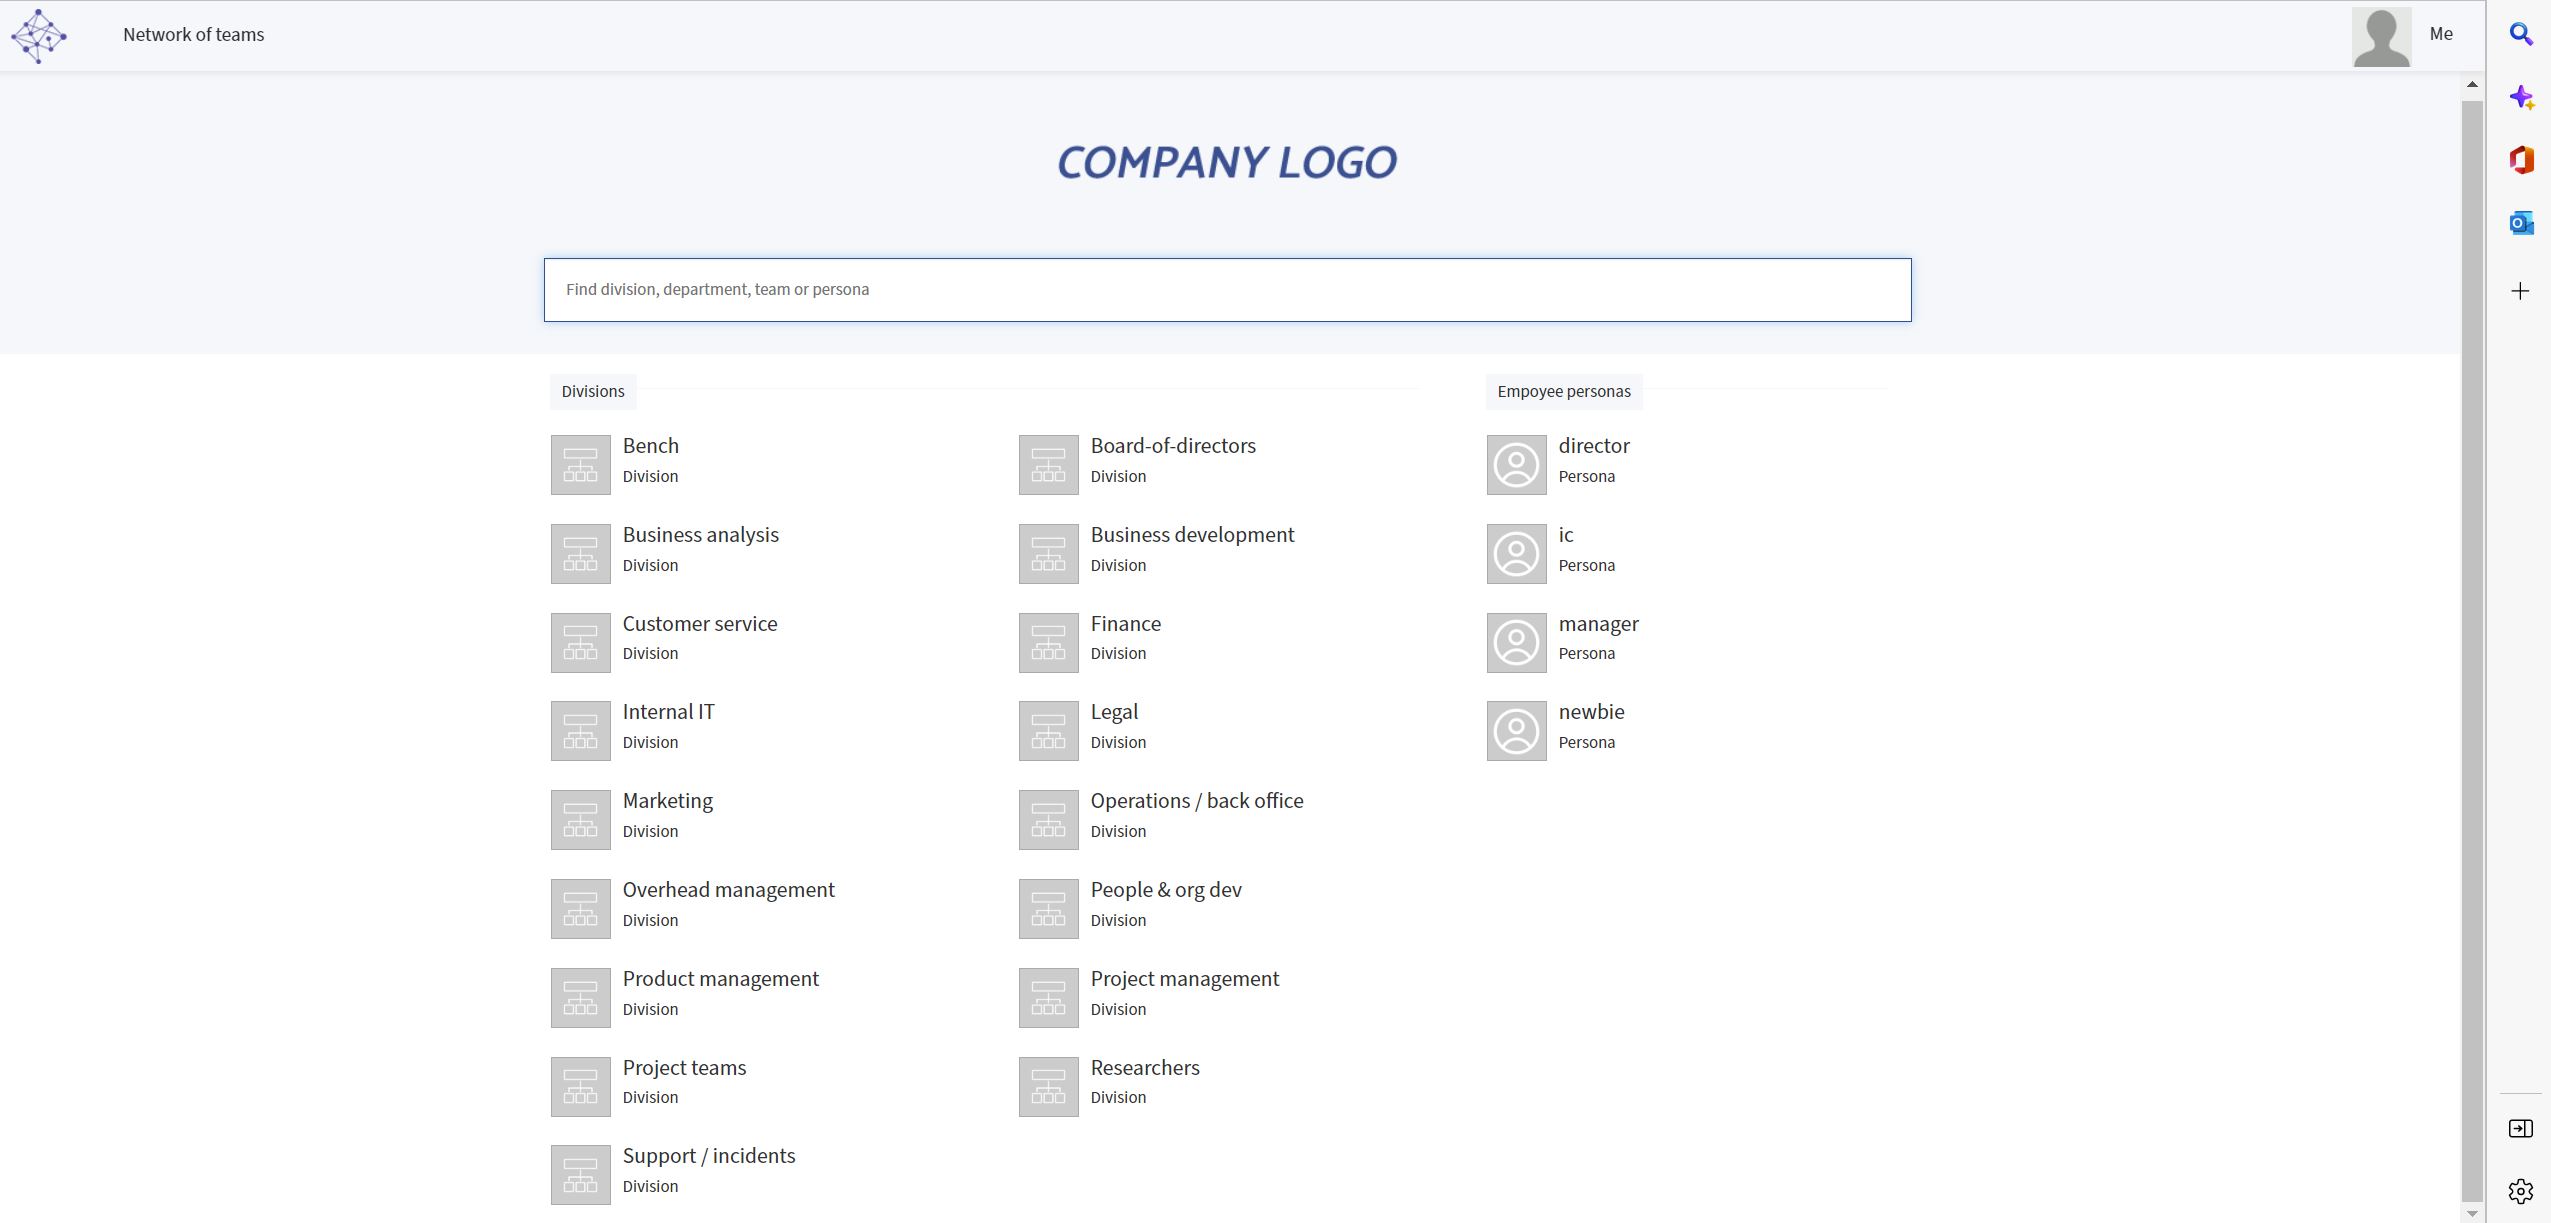 |