
Grafana vs. SAS Visual Analytics
| Product | Rating | Most Used By | Product Summary | Starting Price |
|---|---|---|---|---|
 Grafana | Score8.7 out of 10 | N/A | Grafana is a data visualization tool developed by Grafana Labs in New York. It is available open source, managed (Grafana Cloud), or via an enterprise edition with enhanced features. Grafana has pluggable data source model and comes bundled with support for popular time series databases like Graphite. It also has built-in support for cloud monitoring vendors like Amazon Cloudwatch, Microsoft Azure and SQL databases like MySQL. Grafana can combine data from many places into a single dashboard. | $0 |
 SAS Visual Analytics | Score7.6 out of 10 | Enterprise companies (1,001+ employees) | SAS Visual Analytics provides a complete platform for analytics visualization, enabling users to identify patterns and relationships in data that weren't initially evident. Interactive, self-service BI and reporting capabilities are combined with out-of-the-box advanced analytics so everyone can discover insights from any size and type of data, including text. | N/A |
| Grafana | SAS Visual Analytics | |||||||||||||||
|---|---|---|---|---|---|---|---|---|---|---|---|---|---|---|---|---|
| Editions & Modules |
|
| ||||||||||||||
| Offerings |
| |||||||||||||||
| Entry-level Setup Fee | No setup fee | No setup fee | ||||||||||||||
| Additional Details | — | SAS Visual Statistics and SAS Office Analytics are also available as add-ons. | ||||||||||||||
| More Pricing Information | ||||||||||||||||
| Grafana | SAS Visual Analytics | |
|---|---|---|
| Considered Both Products | No answer on this topic | No answer on this topic |
| Key User Insights | ||
| Would buy again | ||
100% Would buy again 6 Answers | No answers on this topic | |
| Delivers good value for the price | ||
100% Delivers good value for the price 6 Answers | No answers on this topic | |
| Happy with the feature set | ||
100% Happy with the feature set 6 Answers | No answers on this topic | |
| Lived up to sales and marketing promises | ||
No answers on this topic | No answers on this topic | |
| Implementation went as expected | ||
100% Implementation went as expected 6 Answers | No answers on this topic | |
| Grafana | SAS Visual Analytics | ||||||||||||||||||||||
|---|---|---|---|---|---|---|---|---|---|---|---|---|---|---|---|---|---|---|---|---|---|---|---|
| BI Standard Reporting |
| ||||||||||||||||||||||
| Ad-hoc Reporting |
| ||||||||||||||||||||||
| Report Output and Scheduling |
| ||||||||||||||||||||||
| Data Discovery and Visualization |
| ||||||||||||||||||||||
| Access Control and Security |
| ||||||||||||||||||||||
| Mobile Capabilities |
| ||||||||||||||||||||||
| Application Program Interfaces (APIs) / Embedding |
| ||||||||||||||||||||||
| Grafana | SAS Visual Analytics | |
|---|---|---|
| Small Businesses |  Looker Studio Score7.6 out of 10 |  Cyfe Score8.8 out of 10 |
| Medium-sized Companies |  Jet Reports Score9.5 out of 10 |  Zendesk Explore Score8.7 out of 10 |
| Enterprises |  Kibana Score7.2 out of 10 |  Jaspersoft Community Edition Score9.7 out of 10 |
| All Alternatives | View all alternatives | View all alternatives |
| Grafana | SAS Visual Analytics | |
|---|---|---|
| Likelihood to Recommend | 9.0 | 9.0 |
| Likelihood to Renew | - | 9.3 |
| Usability | 10.0 | 6.0 |
| Support Rating | - | 8.0 |
| Data Sharing and Collaboration | - | 9.6 |
| Data Sources | - | 9.8 |
| Grafana | SAS Visual Analytics | |
|---|---|---|
| Likelihood to Recommend |
|
|
| Pros |
|
|
| Cons |
|
|
| Likelihood to Renew | No answers on this topic |
|
| Usability |
|
|
| Support Rating | No answers on this topic |
|
| Alternatives Considered |
|
|
| Return on Investment |
|
|
| ScreenShots | SAS Visual Analytics Screenshots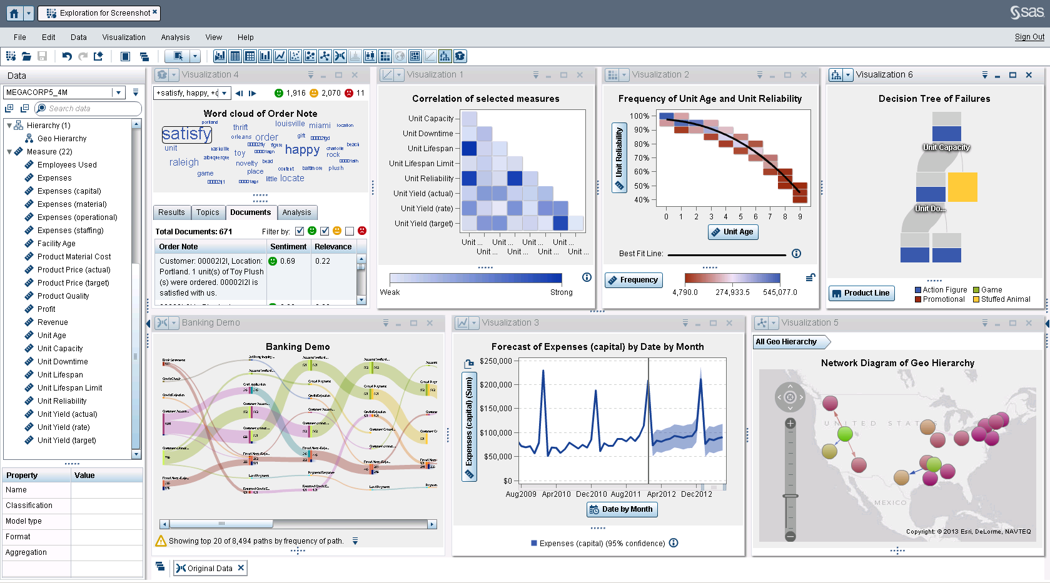 |


