TrustRadius: an HG Insights company

Save this comparison

Save this comparison

Add Product

Recommended Comparisons

    Overview
    ProductRatingMost Used ByProduct SummaryStarting Price

    Google Charts

    Score7 out of 10
    N/AGoogle Charts provides a way to visualize data on your website - for free. From simple line charts to complex hierarchical tree maps, the chart gallery provides a large number of ready-to-use chart types. The most common way to use Google Charts is with simple JavaScript that you embed in your web page.N/A

    Yurbi

    Score8 out of 10
    N/AYurbi is a business intelligence solution that is designed to bridge the gap between business users and intelligent data. It provides the business user with the ability to connect, secure, and collaborate with data to make better business decisions. According to the vendor, Yurbi brings the powerful reporting and analytical capabilities of traditional BI, but takes out the coding jargon – so that people can actually use it themselves. As a 100% HTML5 application, Yurbi gives users and…

    $24,000

    per year

    Pricing
    Google ChartsYurbi
    Editions & Modules
    No answers on this topic
    Yurbi
    24,000
    per year
    Offerings
    Pricing Offerings
    Google ChartsYurbi
    Free Trial
    NoYes
    Free/Freemium Version
    YesNo
    Premium Consulting/Integration Services
    NoYes
    Entry-level Setup FeeNo setup feeNo setup fee
    Additional Details—Yurbi's pricing model is simple and predictable. User licenses start at just $495 per year and that includes all the powerful features of our platform. We offer named users, concurrent users, and public view or anonymous report licensing options. We also offer custom/hybrid pricing for vendors looking to OEM Yurbi.
    More Pricing Information
    Community Pulse
    Google ChartsYurbi
    Considered Both Products
    Google
    No answer on this topic
    5000fish
    No answer on this topic
    Key User Insights
    Would buy again
    100%
    Would buy again
    31 Answers
    No answers on this topic
    Delivers good value for the price
    100%
    Delivers good value for the price
    31 Answers
    No answers on this topic
    Happy with the feature set
    100%
    Happy with the feature set
    31 Answers
    No answers on this topic
    Lived up to sales and marketing promises
    100%
    Lived up to sales and marketing promises
    27 Answers
    No answers on this topic
    Implementation went as expected
    97%
    Implementation went as expected
    28 Answers
    No answers on this topic
    Features
    Google ChartsYurbi
    BI Standard Reporting
    Comparison of BI Standard Reporting features of Google Charts and Yurbi
    Feature
    Google Charts
    8.8
    50 Ratings
    8% above category average
    Yurbi
    -
    Ratings
    Pixel Perfect reports8.145 Ratings00 Ratings
    Customizable dashboards9.548 Ratings00 Ratings
    Report Formatting Templates8.844 Ratings00 Ratings
    Ad-hoc Reporting
    Comparison of Ad-hoc Reporting features of Google Charts and Yurbi
    Feature
    Google Charts
    9.3
    51 Ratings
    14% above category average
    Yurbi
    -
    Ratings
    Drill-down analysis8.645 Ratings00 Ratings
    Formatting capabilities9.551 Ratings00 Ratings
    Integration with R or other statistical packages9.537 Ratings00 Ratings
    Report sharing and collaboration9.646 Ratings00 Ratings
    Report Output and Scheduling
    Comparison of Report Output and Scheduling features of Google Charts and Yurbi
    Feature
    Google Charts
    9.0
    51 Ratings
    8% above category average
    Yurbi
    -
    Ratings
    Publish to Web9.549 Ratings00 Ratings
    Publish to PDF9.646 Ratings00 Ratings
    Report Versioning8.643 Ratings00 Ratings
    Report Delivery Scheduling8.737 Ratings00 Ratings
    Delivery to Remote Servers8.830 Ratings00 Ratings
    Data Discovery and Visualization
    Comparison of Data Discovery and Visualization features of Google Charts and Yurbi
    Feature
    Google Charts
    8.8
    50 Ratings
    10% above category average
    Yurbi
    -
    Ratings
    Pre-built visualization formats (heatmaps, scatter plots etc.)8.949 Ratings00 Ratings
    Location Analytics / Geographic Visualization8.847 Ratings00 Ratings
    Predictive Analytics8.839 Ratings00 Ratings
    Access Control and Security
    Comparison of Access Control and Security features of Google Charts and Yurbi
    Feature
    Google Charts
    8.8
    45 Ratings
    4% above category average
    Yurbi
    -
    Ratings
    Multi-User Support (named login)8.844 Ratings00 Ratings
    Role-Based Security Model8.839 Ratings00 Ratings
    Multiple Access Permission Levels (Create, Read, Delete)8.841 Ratings00 Ratings
    Single Sign-On (SSO)8.831 Ratings00 Ratings
    Mobile Capabilities
    Comparison of Mobile Capabilities features of Google Charts and Yurbi
    Feature
    Google Charts
    9.0
    48 Ratings
    14% above category average
    Yurbi
    -
    Ratings
    Responsive Design for Web Access9.546 Ratings00 Ratings
    Mobile Application9.629 Ratings00 Ratings
    Dashboard / Report / Visualization Interactivity on Mobile8.744 Ratings00 Ratings
    Application Program Interfaces (APIs) / Embedding
    Comparison of Application Program Interfaces (APIs) / Embedding features of Google Charts and Yurbi
    Feature
    Google Charts
    8.8
    40 Ratings
    12% above category average
    Yurbi
    -
    Ratings
    REST API8.932 Ratings00 Ratings
    Javascript API8.839 Ratings00 Ratings
    iFrames8.826 Ratings00 Ratings
    Java API8.926 Ratings00 Ratings
    Themeable User Interface (UI)8.828 Ratings00 Ratings
    Customizable Platform (Open Source)8.828 Ratings00 Ratings
    Best Alternatives
    Google ChartsYurbi
    Small Businesses
    Cyfe
    Score8.8 out of 10
    Cyfe
    Score8.8 out of 10
    Medium-sized Companies
    Zendesk Explore
    Score8.7 out of 10
    Zendesk Explore
    Score8.7 out of 10
    Enterprises
    Jaspersoft Community Edition
    Score9.7 out of 10
    Jaspersoft Community Edition
    Score9.7 out of 10
    All AlternativesView all alternativesView all alternatives
    User Ratings
    Google ChartsYurbi
    Likelihood to Recommend
    8.9
    (61 ratings)
    10.0
    (1 ratings)
    Likelihood to Renew
    7.3
    (8 ratings)
    10.0
    (1 ratings)
    Usability
    8.9
    (33 ratings)
    10.0
    (1 ratings)
    Availability
    10.0
    (1 ratings)
    10.0
    (1 ratings)
    Performance
    5.0
    (1 ratings)
    10.0
    (1 ratings)
    Support Rating
    8.3
    (33 ratings)
    -
    (0 ratings)
    Online Training
    5.0
    (1 ratings)
    -
    (0 ratings)
    Implementation Rating
    10.0
    (1 ratings)
    10.0
    (1 ratings)
    Configurability
    8.0
    (1 ratings)
    -
    (0 ratings)
    Data Sharing and Collaboration
    9.4
    (22 ratings)
    10.0
    (1 ratings)
    Data Sources
    8.3
    (22 ratings)
    -
    (0 ratings)
    Ease of integration
    10.0
    (1 ratings)
    -
    (0 ratings)
    Product Scalability
    8.0
    (1 ratings)
    10.0
    (1 ratings)
    Vendor post-sale
    10.0
    (1 ratings)
    -
    (0 ratings)
    Vendor pre-sale
    10.0
    (1 ratings)
    -
    (0 ratings)
    User Testimonials
    Google ChartsYurbi
    Likelihood to Recommend
    Google
    We can easily recommend Google Charts to any company that needs a way to visually represent their data. Another great thing about Google Charts is that it is free to use and does not require any membership fees. Although it requires a skilled used to be able to use the charts, the results are great and can be beneficial to any company who is looking to make better decisions.
    Read full review
    5000fish
    The Yurbi Poduct is extremely well suited for organizations looking for a mature Business Intelligence and ad-hoc reporting tool. The strength of Yurbi is that it is highly customizable and can work in various environments.
    Incentivized
    Read full review
    Pros
    Google
    • they're free with Google suite and they have backing in terms of powerful Google apps which can be plugged in to perform multiple actions like using Google sheets to import raw data into Google Charts
    • they're the most simple app to use when it comes to creating charts and visual dashboards
    • ease of customization
    • ease of using custom APIs from developers side to help make any types of charts and dashboards you want
    Incentivized
    Read full review
    5000fish
    • Yurbi allows us to build customized Dashboards for specific users. Once the initial Dashboard is created, the user themselves have permissions to customize the Dashboard to suit their needs. The flexibility is there for a wide set of users.
    • Yurbi product is highly customizable. We looked for a Business Intelligence product for quite some time that could be customized to work with different types of data sets. When we started considering Yurbi, it was evident from the beginning that the product could be customized very quickly to work within our environment and our specific data types.
    • The Yurbi product stays a step ahead with the changing market being focused more for the tablet and smart phone user population. As our customers first started to use iPADs and iPhones, it was great to see that an upgraded Yurbi product was readily available for use for the iPAD/iPhone set of users.
    Incentivized
    Read full review
    Cons
    Google
    • I would like a couple more introductory videos or a live chat option for when you run into an issue. I think this is a Google-wide problem, not only linked to Google Charts.
    • I have run into some issues with the Dynamic Data but also admittedly could potentially dive in deeper and investigate.
    • It would be great if Google Charts made it possible to integrate Google Chat into the platform.
    Incentivized
    Read full review
    5000fish
    • While the Yurbi Developer tool is highly mature, there have been cases where building specific complex reports within Yurbi required extensive support directly from the vendor (and even some Yurbi product customizations). It would be great if the Yurbi Developer tool could be slightly refreshed to make it easier for more non-technical users to build more complex reports within Yurbi.
    • Over years of usage of the Yurbi product with growing set of available reports to run for users, it's easy to get unorganized in terms of being able to find the correct report to run. It's highly adviseable if future releases of Yurbi began offering features to organize all reports a little better within the product (including an audit trail of reports that users typically run to make it easier for them to go back to the right reports).
    • We heavily use the SMTP configuration within Yurbi to set up auto-email notifications to specific set of users with requested reports. At times, the SMTP service becomes unavailable and Yurbi product is unable to send these emails to the users. Besides not receiving the email, it's easily evident that the SMTP service connection failed. It would be great if future versions of the Yurbi product would alert the user of the failed SMTP connection on initial Yurbi login so the administrator becomes aware of the issue and can take action to resolve the problem.
    Incentivized
    Read full review
    Likelihood to Renew
    Google
    Google Charts is a good product. It's widely supported with deep documentation and a large community. But for me, it wasn't customizable enough. When we started with simple charts, it was great, but as we got deeper and more complex, our needs outgrew the library. If I was going forward, I would choose a more barebones library with more freedom and extensibility.
    Incentivized
    Read full review
    5000fish
    The Yurbi product has been perceived very well by our customers. They have continued to use it for years and the user population has only expanded. Customers love the flexibility and large set of Dashboards and reports that can be made available within the product quickly and efficiently.
    Incentivized
    Read full review
    Usability
    Google
    Google Charts is about as easy to use as the rest of their applications. The UI is very well thought out, allowing you to add what you need, and customize it to your exact liking. The default theme is actually really nice, which helps as most of the time, customizing is not needed.
    Incentivized
    Read full review
    5000fish
    The Yurbi product is incredibly easy to use and very intuitive for the user. The environment is highly customizable to the user's own preferences which is the best part.
    Incentivized
    Read full review
    Reliability and Availability
    Google
    Google charts is always available and provides fast output.
    Read full review
    5000fish
    No answers on this topic
    Performance
    Google
    Connectivity is occasionally very slow.
    Read full review
    5000fish
    No answers on this topic
    Support Rating
    Google
    As a free tool with massively powerful, infinitely customisable charts that can be dynamically updated - Google Charts is my favourite data visualisation tool. However, my hatred of JavaScript does jade my view on it. This is the price of the tool though, and I'm glad it's available for me.
    Incentivized
    Read full review
    5000fish
    No answers on this topic
    Online Training
    Google
    The online training was solely done through self training on google's guide to charts.
    Read full review
    5000fish
    No answers on this topic
    Implementation Rating
    Google
    Easy to implement
    Read full review
    5000fish
    Yurbi was very simple to implement and the software prerequisites and server requirements were very basic.
    Incentivized
    Read full review
    Alternatives Considered
    Google
    Google Charts stacks up better since it is free and does not have the constant pressure for cost overruns, add-ons, annual maintenance and implementation services. The speed of using Google Charts is quick, saving users potentially weeks in getting up and going. For the readers of websites with limited resources, the application shows up nicely is look and feel with charts. Great way of showing data visually.
    Incentivized
    Read full review
    5000fish
    Yurbi was overall a better product, highly customizable, more user friendly, and lower priced.
    Incentivized
    Read full review
    Scalability
    Google
    Google Charts is essential for quick, easy, reporting. There are opportunities for advanced features.
    Read full review
    5000fish
    No answers on this topic
    Return on Investment
    Google
    • teams were easily able to create charts and find out progress on our learning courses and thus take actionable insights to their managers, professors
    • students could also know their progress on various courses from one single view, same for instructors in terms of imparting education
    • sales team could learn which kind of courses sold more to focus more on those areas
    Incentivized
    Read full review
    5000fish
    No answers on this topic
    ScreenShots

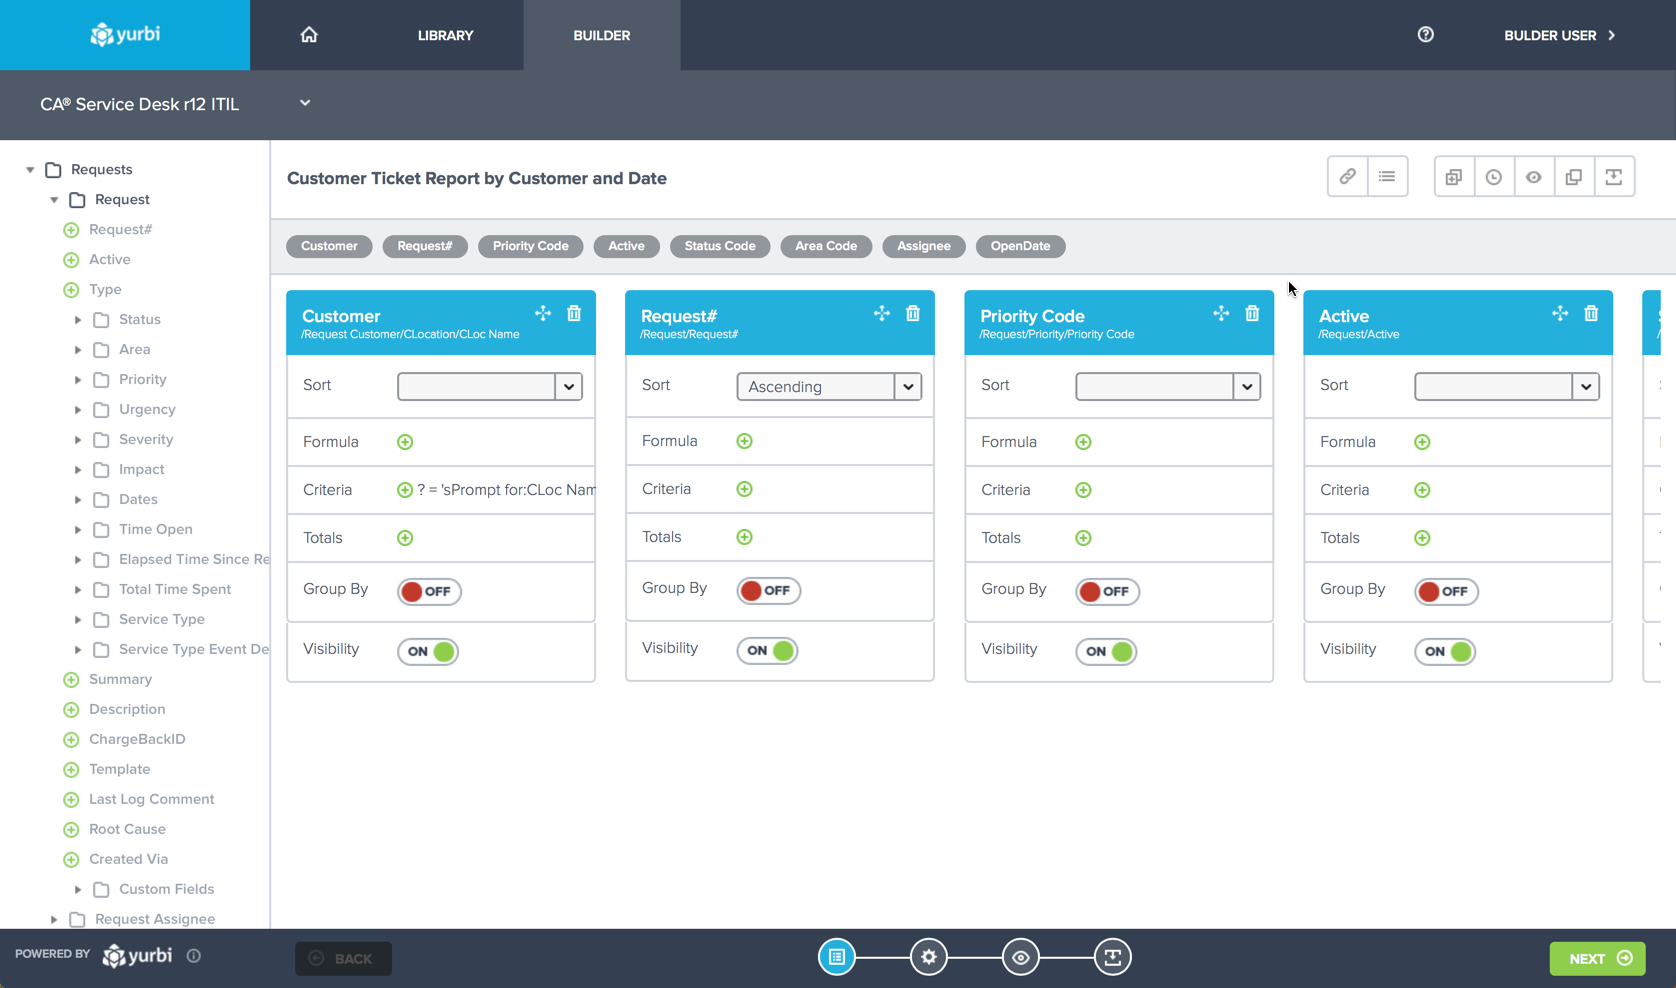
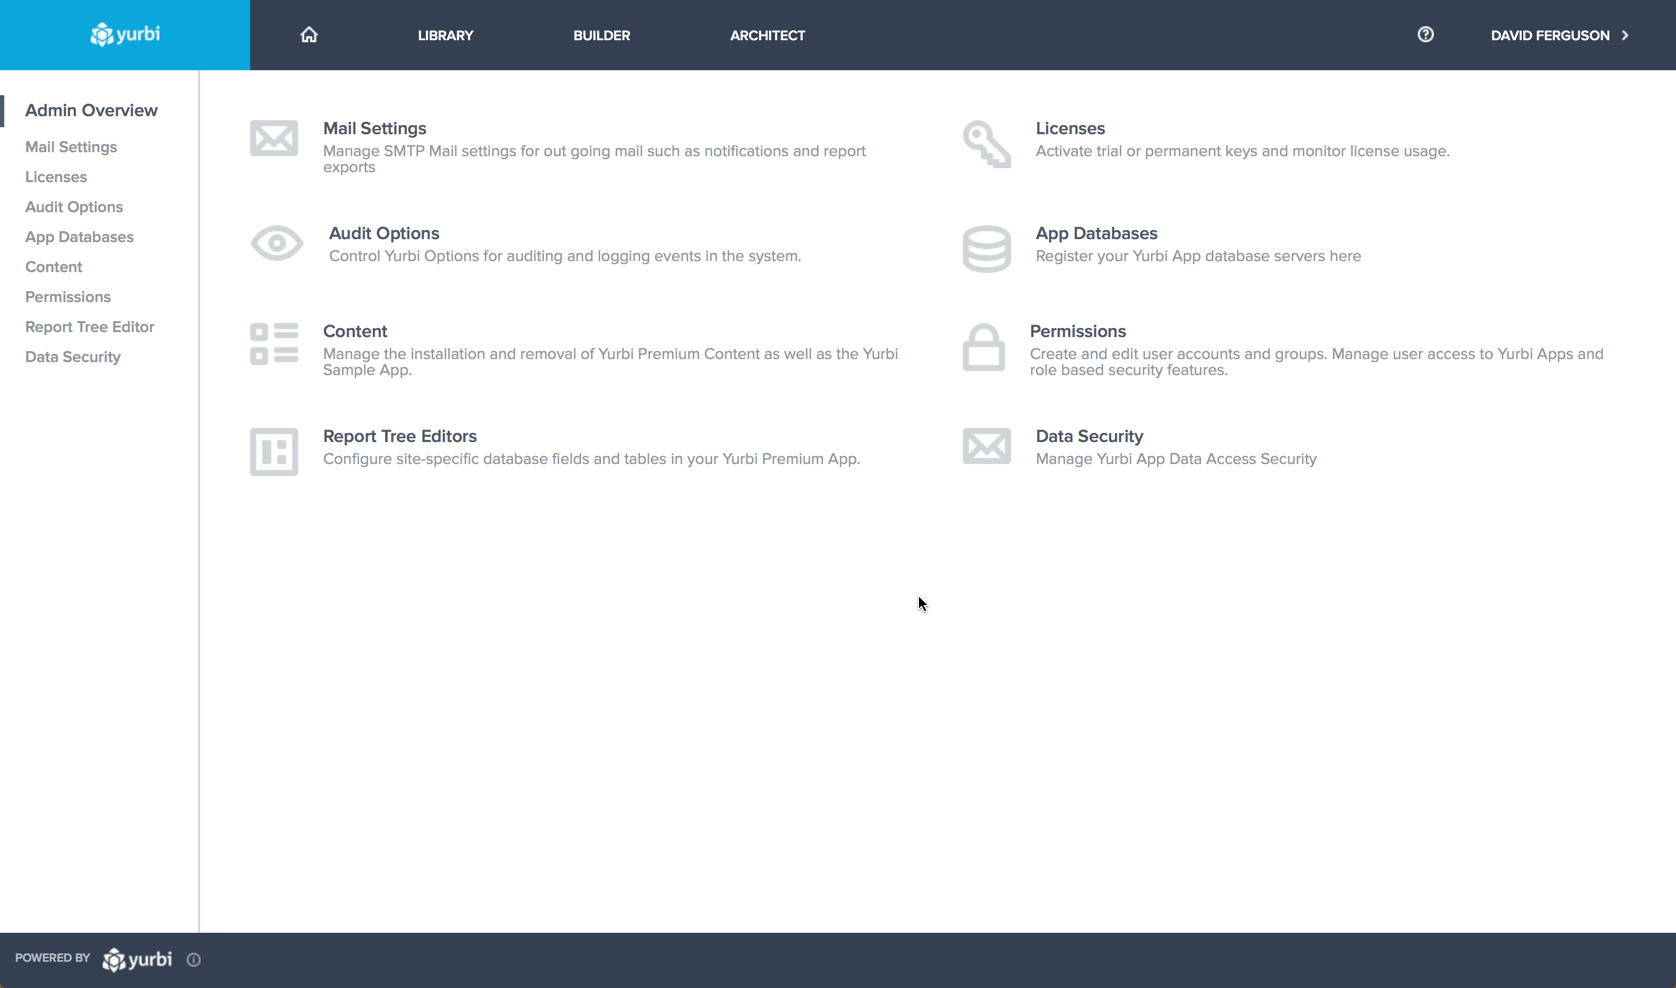
    Yurbi Screenshots

    Screenshot of Login Page (Fully Customizable).Screenshot of Real-Time Dashboards w/ prompts, drilldowns, and personalizations.Screenshot of Secure Library for Running reports, scheduling, embedding, and editting.Screenshot of Drag and Drop, Wizard Approach to complex report building.    Yurbi builds all the SQL code but experts can do advanced SQL as well.Screenshot of More than read-only,  users can alter charts, export, and slice and dice data.Screenshot of Administration of Yurbi is just as easy as the rest of the solution.  Multiple levels of security and auditing included in the platform.