Google Charts provides a way to visualize data on your website - for free. From simple line charts to complex hierarchical tree maps, the chart gallery provides a large number of ready-to-use chart types. The most common way to use Google Charts is with simple JavaScript that you embed in your web page.
N/A
SAP Lumira Discovery
Score 4.4 out of 10
N/A
SAP Lumira Discovery is SAP’s data visualization and discovery application. It facilitates data discovery, visualization, and analysis by assisting users with creation of dashboards, infographics, presentations, data facets, tag clouds, and more.
$185
per user
Pricing
Google Charts
SAP Lumira Discovery
Editions & Modules
No answers on this topic
SAP Lumira, standard edition
$185
per user
Offerings
Pricing Offerings
Google Charts
SAP Lumira Discovery
Free Trial
No
Yes
Free/Freemium Version
Yes
No
Premium Consulting/Integration Services
No
No
Entry-level Setup Fee
No setup fee
No setup fee
Additional Details
—
—
More Pricing Information
Community Pulse
Google Charts
SAP Lumira Discovery
Features
Google Charts
SAP Lumira Discovery
BI Standard Reporting
Comparison of BI Standard Reporting features of Product A and Product B
Google Charts
8.8
Ratings
8% above category average
SAP Lumira Discovery
8.0
Ratings
2% below category average
Pixel Perfect reports
8.10 Ratings
00 Ratings
Customizable dashboards
9.50 Ratings
8.00 Ratings
Report Formatting Templates
8.80 Ratings
00 Ratings
Ad-hoc Reporting
Comparison of Ad-hoc Reporting features of Product A and Product B
Google Charts
9.3
Ratings
14% above category average
SAP Lumira Discovery
7.3
Ratings
10% below category average
Drill-down analysis
8.60 Ratings
10.00 Ratings
Formatting capabilities
9.50 Ratings
7.00 Ratings
Integration with R or other statistical packages
9.50 Ratings
00 Ratings
Report sharing and collaboration
9.60 Ratings
5.00 Ratings
Report Output and Scheduling
Comparison of Report Output and Scheduling features of Product A and Product B
Google Charts
9.0
Ratings
8% above category average
SAP Lumira Discovery
6.1
Ratings
31% below category average
Publish to Web
9.50 Ratings
7.00 Ratings
Publish to PDF
9.60 Ratings
5.00 Ratings
Report Versioning
8.60 Ratings
00 Ratings
Report Delivery Scheduling
8.70 Ratings
6.30 Ratings
Delivery to Remote Servers
8.80 Ratings
00 Ratings
Data Discovery and Visualization
Comparison of Data Discovery and Visualization features of Product A and Product B
Google Charts is perfectly suited for most presentations that are data oriented. There's not much of a limit on the type of table or chart you can create, and being able to integrate with Google Sheets just makes things even easier if you've already got the data stored somewhere. It works well on desktop browsers, Iphones, and Android phones. The only drawback I've been able to find is for those that prefer to have a desktop application.
SAP Lumira helped to create intuitive and real-time dashboards in a story format to the organization. However with new capabilities of SAP, like SAP Analytics Cloud (SAC) providing more planning and analytical capabilities. Thus the identification of the use cases with the available products should be done. SAC is more integrated and the go to product in SAP roadmap.
I would like a couple more introductory videos or a live chat option for when you run into an issue. I think this is a Google-wide problem, not only linked to Google Charts.
I have run into some issues with the Dynamic Data but also admittedly could potentially dive in deeper and investigate.
It would be great if Google Charts made it possible to integrate Google Chat into the platform.
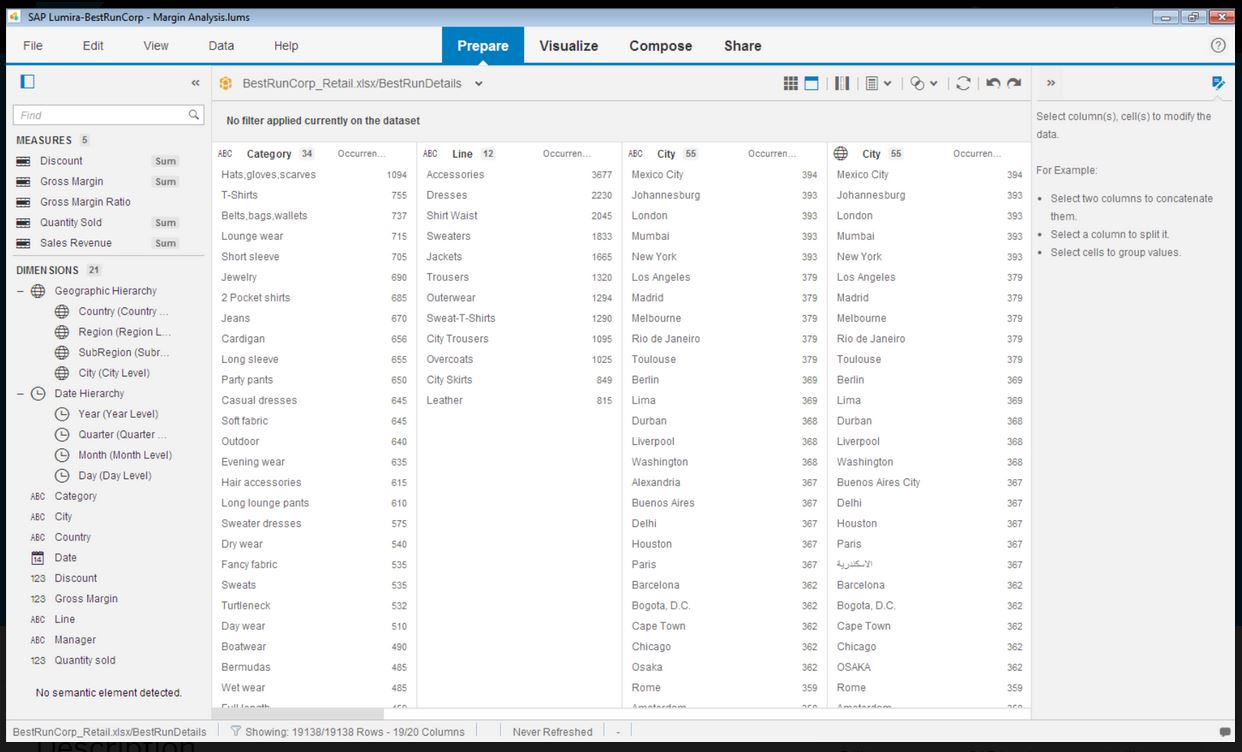
Control over data import formatting - for example where amount and currency values are imported there is not enough control over the transformation and formatting and this has caused us data import difficulties where values read have been truncated due to punctuation in the amount fields.
The user interface is simplified, but the terminology and screen layout do not always make it obvious how to start the process for a new user - for example to add a new data source or create a new report.
Google Charts is a good product. It's widely supported with deep documentation and a large community. But for me, it wasn't customizable enough. When we started with simple charts, it was great, but as we got deeper and more complex, our needs outgrew the library. If I was going forward, I would choose a more barebones library with more freedom and extensibility.
Requires knowledge of Javascript, which can be difficult for a beginner. A business analyst often isn't as technically minded as a developer so collaboration is often required to produce a correct chart for the purpose required. However, the customisation capable due to this creates much better looking charts compared to other tools.
It has good features, the data connectivity and merging is really good, and it has helped our IT team. Nevertheless, it can sometimes be hard to use and some of the features can be found outdated. As we don't have a lot of data, it is a decent tool for our data analytics, but I wouldn't recommend for bigger or more complex businesses with large amounts of data.
Lumira is a desktop application runs in its own JVM. It installs its own java runtime libraries to avoid any core java version conflicts. The availability of the application is completely relies on individual machine hardware configuration. On a decent desktop, it performs well and always launches in either 32 or 64 bit environment based on the hosts system's OS
The performance is linear with amount of data that is being explored. We have done some benchmarks acquiring 10million data cells without having any performance problems. We need to make proper adjustments to jvm run time properties to start with higher heap size and other parameters that optimizes the run time performance
Google Charts has a very good documentation that we can just go in there and find the stuff we need to implement our solutions on Google Charts. Plus, if we get stuck, we can also email the support and they are very responsive. So overall, the support is very satisfying.
It does not have many bugs or issues since not a lot of new features are being added. The customer support for SAP Lumira Discovery is good and anyone considering this as a self-service tool would be happy. It integrates well in the SAP BI suite of products and the overall experience is positive.
Most of the user guides are pretty comprehensive and very easy to understand. The product itself is designed to be self-serve tool, did not need much of the end-user training. Most of the training we had is to how to read the data, how to explore the data, how to acquire the data etc.
Installing the desktop software on end-user machines is always challenging. The machine specifications are the biggest factor when running Lumira and be able to handle large datasets during data exploration. This often demands beefy machines at least for power-users. Although Lumira software licensing is not a big problem but managing partner's extensions and keeping track of their individual licenses may be an issue. If there is a way to bundle the more popular extensions such as vSQL or vOLAP should be bundled in core product and offer them as part of Lumira license instead of a separate license which causer operational burden.
In comparison to Microsoft Power BI, Google Charts has more ease of use for businesses who simply need a way to visually display their data from their reports. Although Power BI may be more robust in more complicated data compilation, Google Charts can still be able to do some of the basics that Power BI delivers.
I have evaluated products such a Tableau Desktop and Splunk and the biggest difference I realized was the ability to include interactive controls in the output. For instance if I wanted to include the ability to filter by a category or filter by a date range, the controls can easily be embedded in other products.
Enterprise wide implementation is a challenge with data security and trustedness. No easy installation can be done across the enterprise. no upgrade paths also available from SAP. They have so much of experience with desktop implementation, there it could be a controlled environment with a capital budget. These may be resolved in the upcoming releases