Google Analytics is perhaps the best-known web analytics product and, as a free product, it has massive adoption. Although it lacks some enterprise-level features compared to its competitors in the space, the launch of the paid Google Analytics Premium edition seems likely to close the gap.
$0
per month
Optimizely Web Experimentation
Score8.7 out of 10
N/A
Whether launching a first test or scaling a sophisticated experimentation program, Optimizely Web Experimentation aims to deliver the insights needed to craft high-performing digital experiences that drive engagement, increase conversions, and accelerate growth.
N/A
Pricing
Google Analytics
Optimizely Web Experimentation
Editions & Modules
Google Analytics 360
150,000
per year
Google Analytics
Free
No answers on this topic
Offerings
Pricing Offerings
Google Analytics
Optimizely Web Experimentation
Free Trial
No
Yes
Free/Freemium Version
Yes
No
Premium Consulting/Integration Services
No
Yes
Entry-level Setup Fee
No setup fee
Optional
Additional Details
—
—
More Pricing Information
Community Pulse
Google Analytics
Optimizely Web Experimentation
Considered Both Products
Google
Verified User
Chose Google Analytics
I've spoken pretty extensively already about how Adobe Analytics and Google Analytics compare, but again it's not really close between the two tools. Again, there may be some use cases where GA makes more sense (primarily if you are trying to cut down on the expenses of the …
A de minimis incentive was given to thank the reviewer for their time. The incentive was not used to bias or drive a particular response, nor was the incentive contingent on a positive endorsement. More Info
Chief Technology Officer, Co-Founder in Information Technology at Patheer (Computer Software, 11-50 employees)
Chose Google Analytics
Google Analytics provided all the tools that we needed. We found that the other tools were a little more difficult to use and create reports. Additionally, the integrations that Google Analytics provided was a lot more efficient in terms of what we were looking for. Very …
A de minimis incentive was given to thank the reviewer for their time. The incentive was not used to bias or drive a particular response, nor was the incentive contingent on a positive endorsement. More Info
Optimizely
Verified User
Chose Optimizely Web Experimentation
The ability to do A/B testing in Optimizely along with the associated statistical modelling and audience segmentation means it is a much better solution than using something like Google Analytics were a lot more effort is required to identify and isolate the specific data you …
A de minimis incentive was given to thank the reviewer for their time. The incentive was not used to bias or drive a particular response, nor was the incentive contingent on a positive endorsement. More Info
Senior Analsyt in Information Technology at PetSmart (Consumer Goods, 10,001+ employees)
Chose Optimizely Web Experimentation
It's a lot more, well, site stacked, it's way better than that. Adobe Target. I think the UI is easier to use on Optimizely. The one thing that I would say comparatively is our analytics talking to each other. Obviously Adobe, we use Adobe Analytics and Adobe Target, so they …
A de minimis incentive was given to thank the reviewer for their time. The incentive was not used to bias or drive a particular response, nor was the incentive contingent on a positive endorsement. TR verified that a representative sample of customers was invited. More Info
Manager, Experience Optimization in Marketing at Zillow (Real Estate, 5001-10,000 employees)
Chose Optimizely Web Experimentation
Google Optimize was much less flexible for our program needs and requires Google Analytics for analysis and metrics tracking. Optimizely Web Experimentation lets you build any number of metrics which can be much more complex than standard GA goals. Optimizely Web …
A de minimis incentive was given to thank the reviewer for their time. The incentive was not used to bias or drive a particular response, nor was the incentive contingent on a positive endorsement. TR verified that a representative sample of customers was invited. More Info
Verified User
Chose Optimizely Web Experimentation
This is a platform that was already implemented when I started with my current company.
A de minimis incentive was given to thank the reviewer for their time. The incentive was not used to bias or drive a particular response, nor was the incentive contingent on a positive endorsement. TR verified that a representative sample of customers was invited. More Info
Verified User
Chose Optimizely Web Experimentation
None of them have a best in class stats engine and live within an ecosystem of marketing technology products the way that Optimizely does, so the scalability of using any one of those tools is limited as compared to using Optimizely Web Experimentation.
A de minimis incentive was given to thank the reviewer for their time. The incentive was not used to bias or drive a particular response, nor was the incentive contingent on a positive endorsement. TR verified that a representative sample of customers was invited. More Info
Verified User
Chose Optimizely Web Experimentation
Optimizely is more user-friendly and cost-effective, ideal for experimentation-focused teams, while Adobe Target excels in advanced personalization and seamless integration within the Adobe ecosystem, making it better suited for large enterprises.
A de minimis incentive was given to thank the reviewer for their time. The incentive was not used to bias or drive a particular response, nor was the incentive contingent on a positive endorsement. TR verified that a representative sample of customers was invited. More Info
A de minimis incentive was given to thank the reviewer for their time. The incentive was not used to bias or drive a particular response, nor was the incentive contingent on a positive endorsement. TR verified that a representative sample of customers was invited. More Info
Verified User
Chose Optimizely Web Experimentation
Optimizely Web Experimentation has more robust product for experimentation specialists than VWO
A de minimis incentive was given to thank the reviewer for their time. The incentive was not used to bias or drive a particular response, nor was the incentive contingent on a positive endorsement. TR verified that a representative sample of customers was invited. More Info
A de minimis incentive was given to thank the reviewer for their time. The incentive was not used to bias or drive a particular response, nor was the incentive contingent on a positive endorsement. TR verified that a representative sample of customers was invited. More Info
Verified User
Chose Optimizely Web Experimentation
Marketing mostly focuses on small changes to static sites, which is well suited to Optimizely.
A de minimis incentive was given to thank the reviewer for their time. The incentive was not used to bias or drive a particular response, nor was the incentive contingent on a positive endorsement. TR verified that a representative sample of customers was invited. More Info
A de minimis incentive was given to thank the reviewer for their time. The incentive was not used to bias or drive a particular response, nor was the incentive contingent on a positive endorsement. TR verified that a representative sample of customers was invited. More Info
Verified User
Chose Optimizely Web Experimentation
It's slightly more complicated to use, but in my experience, it has more capabilities. Also, Google Optimize was depreciated, so this is definitely the next best platform.
A de minimis incentive was given to thank the reviewer for their time. The incentive was not used to bias or drive a particular response, nor was the incentive contingent on a positive endorsement. TR verified that a representative sample of customers was invited. More Info
A de minimis incentive was given to thank the reviewer for their time. The incentive was not used to bias or drive a particular response, nor was the incentive contingent on a positive endorsement. TR verified that a representative sample of customers was invited. More Info
Verified User
Chose Optimizely Web Experimentation
Less development required once the tool is fully implemented and easier to scale
A de minimis incentive was given to thank the reviewer for their time. The incentive was not used to bias or drive a particular response, nor was the incentive contingent on a positive endorsement. TR verified that a representative sample of customers was invited. More Info
Verified User
Chose Optimizely Web Experimentation
Optimizely has better customer service if you need to talk to a person and a great library of documentation if you run into issues and want to troubleshoot yourself. Web Experimentation has allowed for our testing capabilities to grow as our research program develops. …
A de minimis incentive was given to thank the reviewer for their time. The incentive was not used to bias or drive a particular response, nor was the incentive contingent on a positive endorsement. TR verified that a representative sample of customers was invited. More Info
Digital Marketing Manager in Marketing at Cox Automotive (Automotive, 10,001+ employees)
Chose Optimizely Web Experimentation
Google Optimize was great, but our organization already had contracts with Optimizely Web Experimentation for their other tools. unbounce wasn't really an option either mainly because it was only a landing page testing tool and had to use their platform to host the tests. We …
A de minimis incentive was given to thank the reviewer for their time. The incentive was not used to bias or drive a particular response, nor was the incentive contingent on a positive endorsement. More Info
Verified User
Chose Optimizely Web Experimentation
Optimizely is an integrated solution that supports all the performance areas and does the analytics while working on all other areas. The products I use were a lot more simple, they helped me but in a limited way so I came to search for software and tool which fitted really well.
A de minimis incentive was given to thank the reviewer for their time. The incentive was not used to bias or drive a particular response, nor was the incentive contingent on a positive endorsement. More Info
Verified User
Chose Optimizely Web Experimentation
Optimizely is ok and cost effective compared to other tools. In general the industry keeps lowering the value of tools as they broaden the audience.
A de minimis incentive was given to thank the reviewer for their time. The incentive was not used to bias or drive a particular response, nor was the incentive contingent on a positive endorsement. More Info
Verified User
Chose Optimizely Web Experimentation
We have evaluated Optimize every year against Optimizely. I am a google fan, but their product is not up to the level of Optimizely. They do not offer multi-page tests, and a lot of our changes sometimes span the whole funnel. For that reason alone, it's currently unusable.
A de minimis incentive was given to thank the reviewer for their time. The incentive was not used to bias or drive a particular response, nor was the incentive contingent on a positive endorsement. More Info
A de minimis incentive was given to thank the reviewer for their time. The incentive was not used to bias or drive a particular response, nor was the incentive contingent on a positive endorsement. More Info
Verified User
Chose Optimizely Web Experimentation
Optimizely is the leader but Google Optimize and Adobe Target are up and coming given their ability to integrate with those marketing stacks.
A de minimis incentive was given to thank the reviewer for their time. The incentive was not used to bias or drive a particular response, nor was the incentive contingent on a positive endorsement. More Info
Verified User
Chose Optimizely Web Experimentation
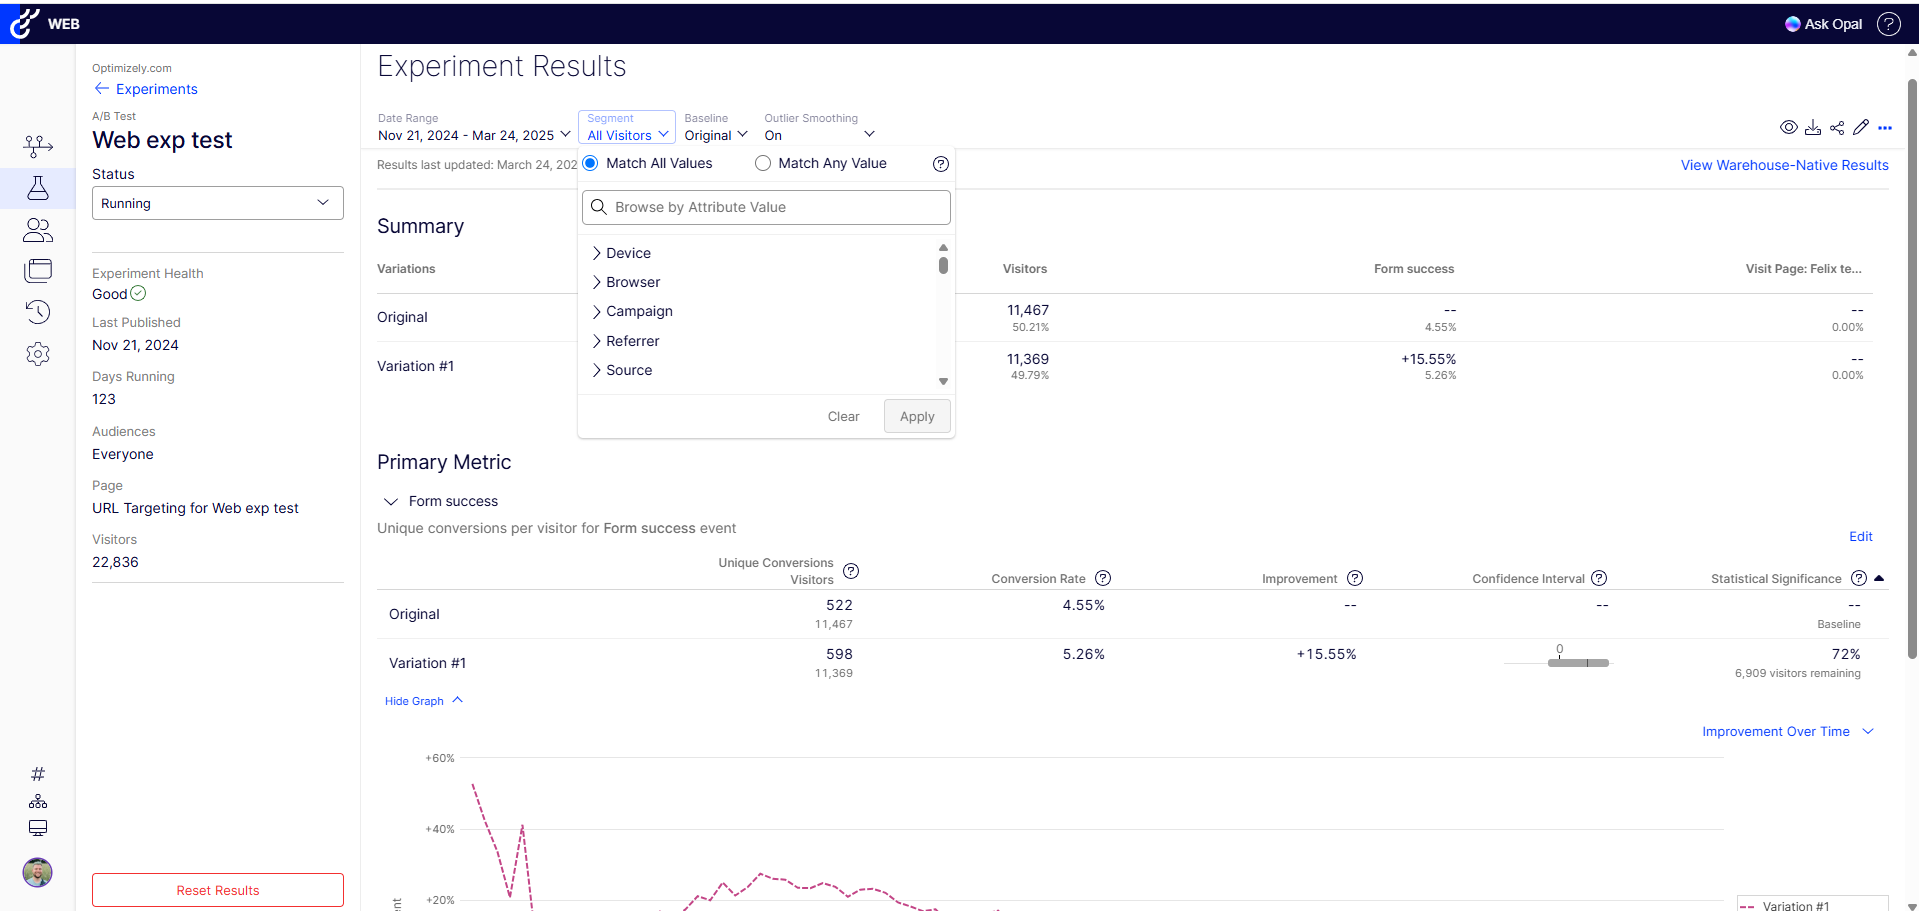
We chose Optimizely specifically for its split testing and advanced audience segmentation capabilities. It makes it way easier to see which option objectively performs better.
A de minimis incentive was given to thank the reviewer for their time. The incentive was not used to bias or drive a particular response, nor was the incentive contingent on a positive endorsement. More Info
Verified User
Chose Optimizely Web Experimentation
Optimizely is a far more comprehensive solution. While it's true there are competitors to X Web, there's nothing to touch Optimizely's Full Stack product. Their customer support is based out of the USA, which cuts down wait times if we have questions/issues. This wasn't the …
A de minimis incentive was given to thank the reviewer for their time. The incentive was not used to bias or drive a particular response, nor was the incentive contingent on a positive endorsement. More Info
Google Analytics is particularly well suited for tracking and analyzing customer behavior on a grocery e-commerce platform. It provides a wealth of information about customer behavior, including what products are most popular, what pages are visited the most, and where customers are coming from. This information can help the platform optimize its website for better customer engagement and conversion rates. However, Google Analytics may not be the best tool for more advanced, granular analysis of customer behavior, such as tracking individual customer journeys or understanding customer motivations. In these cases, it may be more appropriate to use additional tools or solutions that provide deeper insights into customer behavior.
I think it can serve the whole spectrum of experiences from people who are just getting used to web experimentation. It's really easy to pick up and use. If you're more experienced then it works well because it just gets out of the way and lets you really focus on the experimentation side of things. So yeah, strongly recommend. I think it is well suited both to small businesses and large enterprises as well. I think it's got a really low barrier to entry. It's very easy to integrate on your website and get results quickly. Likewise, if you are a big business, it's incrementally adoptable, so you can start out with one component of optimizing and you can build there and start to build in things like data CMS to augment experimentation as well. So it's got a really strong a pathway to grow your MarTech platform if you're a small company or a big company.
A de minimis incentive was given to thank the reviewer for their time. The incentive was not used to bias or drive a particular response, nor was the incentive contingent on a positive endorsement. More Info
A de minimis incentive was given to thank the reviewer for their time. The incentive was not used to bias or drive a particular response, nor was the incentive contingent on a positive endorsement. More Info
The Platform contains drag-and-drop editor options for creating variations, which ease the A/B tests process, as it does not require any coding or development resources.
Establishing it is so simple that even a non-technical person can do it perfectly.
It provides real-time results and analytics with robust dashboard access through which you can quickly analyze how different variations perform. With this, your team can easily make data-driven decisions Fastly.
A de minimis incentive was given to thank the reviewer for their time. The incentive was not used to bias or drive a particular response, nor was the incentive contingent on a positive endorsement. TR verified that a representative sample of customers was invited. More Info
A de minimis incentive was given to thank the reviewer for their time. The incentive was not used to bias or drive a particular response, nor was the incentive contingent on a positive endorsement. More Info
A de minimis incentive was given to thank the reviewer for their time. The incentive was not used to bias or drive a particular response, nor was the incentive contingent on a positive endorsement. More Info
We will continue to use Google Analytics for several reasons. It is free, which is a huge selling point. It houses all of our ecommerce stores' data, and though it can't account for refunds or fraud orders, gives us and our clients directional, real time information on individual and group store performance.
A de minimis incentive was given to thank the reviewer for their time. The incentive was not used to bias or drive a particular response, nor was the incentive contingent on a positive endorsement. More Info
I rated this question because at this stage, Optimizely does most everything we need so I don't foresee a need to migrate to a new tool. We have the infrastructure already in place and it is a sizeable lift to pivot to another tool with no guarantee that it will work as good or even better than Optimizely
A de minimis incentive was given to thank the reviewer for their time. The incentive was not used to bias or drive a particular response, nor was the incentive contingent on a positive endorsement. TR verified that a representative sample of customers was invited. More Info
Google Analytics provides a wealth of data, down to minute levels. That is it's greatest detriment: find the right information when you need it can be a cumbersome task. You are able to create shortcuts, however, so it can mitigate some of this problem. Google is continually refining Analytics, so I do not doubt there will be improvements
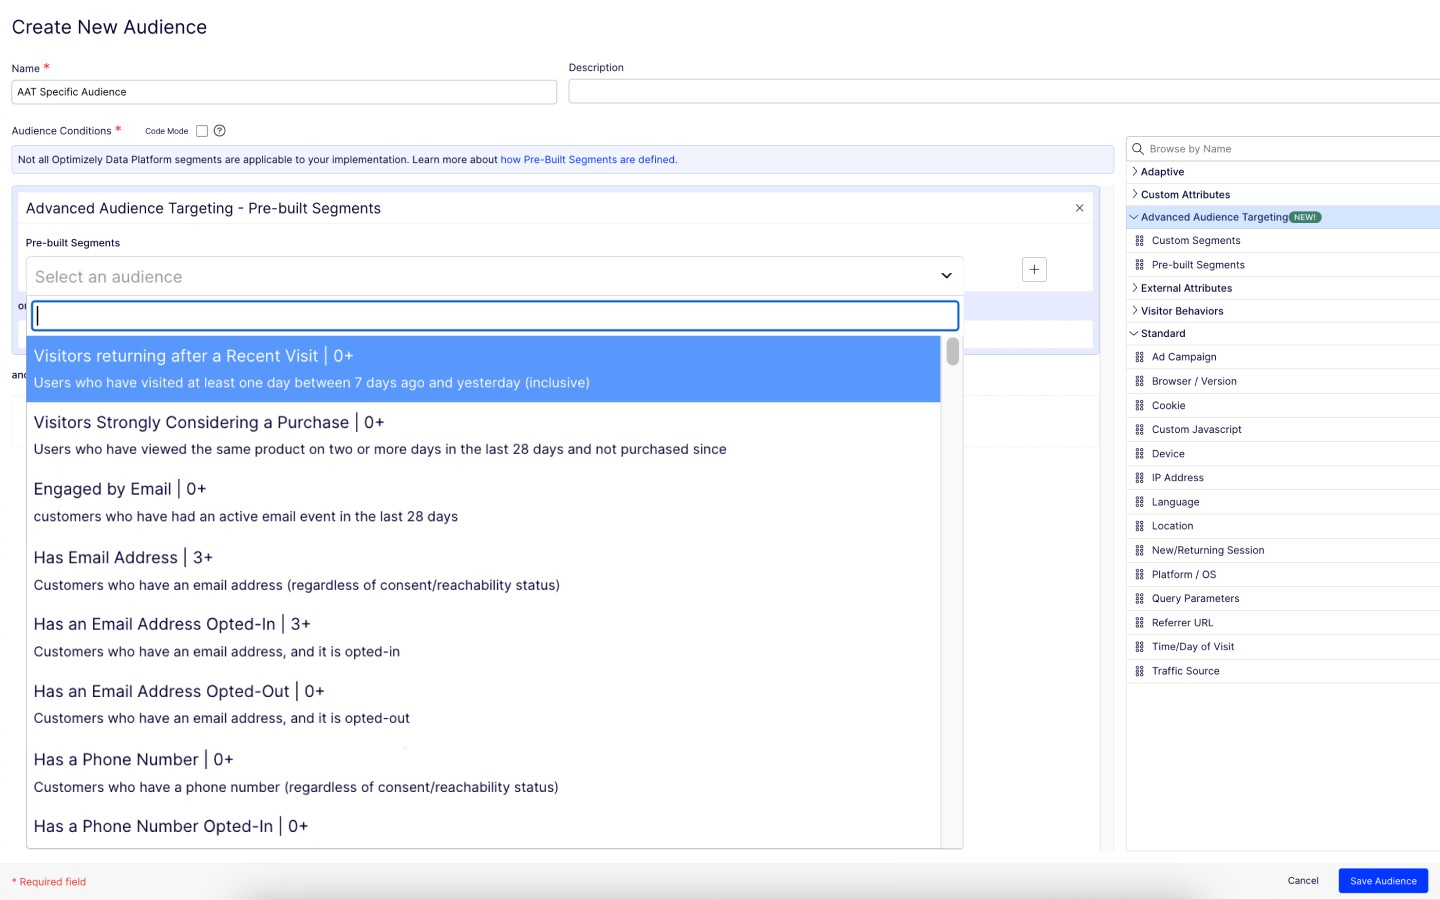
Optimizely Web Experimentation's visual editor is handy for non-technical or quick iterative testing. When it comes to content changes it's as easy as going into wordpress, clicking around, and then seeing your changes live--what you see is what you get. The preview and approval process for sharing built experiments is also handy for sharing experiments across teams for QA purposes or otherwise.
A de minimis incentive was given to thank the reviewer for their time. The incentive was not used to bias or drive a particular response, nor was the incentive contingent on a positive endorsement. More Info
We all know Google is at top when it comes to availability. We have never faced any such instances where I can suggest otherwise. All you need is a Google account, a device and internet connection to use this super powerful tool for reporting and visualising your site data, traffic, events, etc. that too in real time.
I would rate Optimizely Web Experimentation's availability as a 10 out of 10. The software is reliable and does not experience any application errors or unplanned outages. Additionally, the customer service and technical support teams are always available to help with any issues or questions.
A de minimis incentive was given to thank the reviewer for their time. The incentive was not used to bias or drive a particular response, nor was the incentive contingent on a positive endorsement. More Info
This has been a catalyst for improving our site's traffic handling capabilities. We were able to identify exit% from our sites through it and we used recommendations to handle and implement the same in our sites. We have been increasing the usage of Google Analytics in our sites and never had any performance related issues if we used Analytics
I would rate Optimizely Web Experimentation's performance as a 9 out of 10. Pages load quickly, reports are complete in a reasonable time frame, and the software does not slow down any other software or systems that it integrates with. Additionally, the customer service and technical support teams are always available to help with any issues or questions.
A de minimis incentive was given to thank the reviewer for their time. The incentive was not used to bias or drive a particular response, nor was the incentive contingent on a positive endorsement. More Info
The Google reps respond very quickly. However, sometimes they can overly call you to set up an apportionment. I'm very proficient and sometimes when I talk to reps, they give beginner tutorials and insights that are a waste of time. I wish Google would understand my level of expertise and assign me to a rep (long-term) that doesn't have to walk me through the basics.
A de minimis incentive was given to thank the reviewer for their time. The incentive was not used to bias or drive a particular response, nor was the incentive contingent on a positive endorsement. More Info
They always are quick to respond, and are so friendly and helpful. They always answer the phone right away. And [they are] always willing to not only help you with your problem, but if you need ideas they have suggestions as well.
love the product and training they provide for businesses of all sizes. The following list of links will help you get started with Google Analytics from setup to understanding what data is being presented by Google Analytics.
The tool itself is not very difficult to use so training was not very useful in my opinion. It did not also account for success events more complex than a click (which my company being ecommerce is looking to examine more than a mere click).
I think my biggest take away from the Google Analytics implementation was that there needs to be a clear understanding of what you want to achieve and how you want to achieve it before you start. Originally the analytics were added to track visitors, but as we became more savvy with the product, we began adding more and more functionality, and defining guidelines as we went along. While not detrimental to our success, this lack of an overarching goal resulted in some minor setbacks in implementation and the collection of some messy data that is unusable.
In retrospect: - I think I should have stressed more demo's / workshopping with the Optimizely team at the start. I felt too confident during demo stages, and when came time to actually start, I was a bit lost. (The answer is likely I should have had them on-hand for our first install.. they offered but I thought I was OK.) - Really getting an understanding / asking them prior to install of how to make it really work for checkout pages / one that uses dynamic content or user interaction to determine what the UI does. Could have saved some time by addressing this at the beginning, as some things we needed to create on our site for Optimizely to "use" as a trigger for the variation test. - Having a number of planned/hoped-for tests already in-hand before working with Optimizely team. Sharing those thoughts with them would likely have started conversations on additional things we needed to do to make them work (rather than figuring that out during the actual builds). Since I had development time available, I could have added more things to the baseline installation since my developers were already "looking under the hood" of the site.
I have not used Adobe Analytics as much, but I know they offer something called customer journey analytics, which we are evaluating now. I have used Semrush, and I find them much better than Google Analytics. I feel a fairly nontechnical person could learn Semrush in about a month. They also offer features like competitive analysis (on content, keywords, traffic, etc.), which is very useful. If you have to choose one among Semrush and Google Analytics, I would say go for Semrush.
A de minimis incentive was given to thank the reviewer for their time. The incentive was not used to bias or drive a particular response, nor was the incentive contingent on a positive endorsement. More Info
The ability to do A/B testing in Optimizely along with the associated statistical modelling and audience segmentation means it is a much better solution than using something like Google Analytics were a lot more effort is required to identify and isolate the specific data you need to confidently make changes
A de minimis incentive was given to thank the reviewer for their time. The incentive was not used to bias or drive a particular response, nor was the incentive contingent on a positive endorsement. More Info
Google Analytics is currently handling the reporting and tracking of near about 80 sites in our project. And I am not talking about the sites from different projects. They may have way more accounts than that. Never ever felt a performance issue from Google's end while generating or customising reports or tracking custom events or creating custom dimensions
We can use it flexibly across lines of business and have it in use across two departments. We have different use cases and slightly different outcomes, but can unify our results based on impact to the bottom line. Finally, we can generate value from anywhere in the org for any stakeholders as needed.
A de minimis incentive was given to thank the reviewer for their time. The incentive was not used to bias or drive a particular response, nor was the incentive contingent on a positive endorsement. TR verified that a representative sample of customers was invited. More Info
A de minimis incentive was given to thank the reviewer for their time. The incentive was not used to bias or drive a particular response, nor was the incentive contingent on a positive endorsement. More Info
We're able to share definitive annualized revenue projections with our team, showing what would happen if we put a test into Production
Showing the results of a test on a new page or feature prior to full implementation on a site saves developer time (if a test proves the new element doesn't deliver a significant improvement.
Making a change via the WYSIWYG interface allows us to see multiple changes without developer intervention.
A de minimis incentive was given to thank the reviewer for their time. The incentive was not used to bias or drive a particular response, nor was the incentive contingent on a positive endorsement. TR verified that a representative sample of customers was invited. More Info