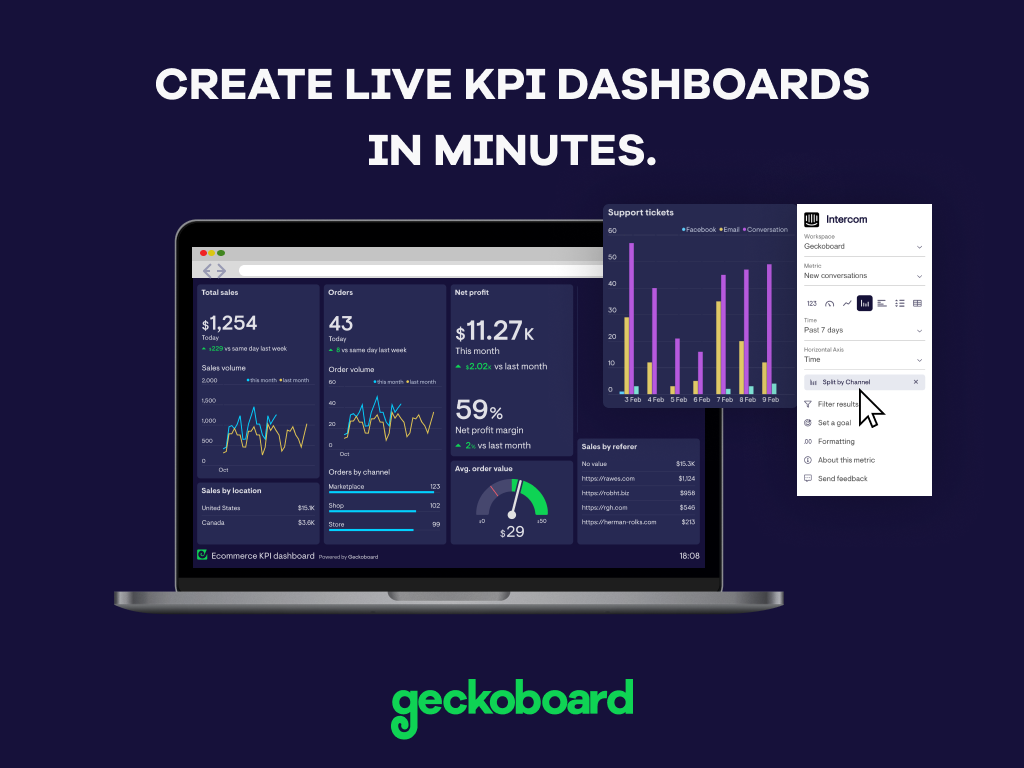
Geckoboard enables users to create real time dashboards using data from over 80 cloud services. It integrates with other products such as: AWeber, Basecamp, Campaign Monitor and HubSpot.
$35
per month
Zendesk Explore
Score 8.7 out of 10
N/A
Zendesk offers Explore, a business intelligence and customer analytics tool which integrates with the Zendesk suite featuring ticket analytics, custom fields, dashboards, and other features. Zendesk is migrating customers of the BIME analytics product, which is approaching end of support, to Zendesk Explore in 2019.
N/A
Pricing
Geckoboard
Zendesk Explore
Editions & Modules
Starter
$35
per month
Team
$159
per month
Team Plus
$275
per month
Company
$599
per month
No answers on this topic
Offerings
Pricing Offerings
Geckoboard
Zendesk Explore
Free Trial
Yes
No
Free/Freemium Version
Yes
No
Premium Consulting/Integration Services
No
No
Entry-level Setup Fee
No setup fee
No setup fee
Additional Details
—
—
More Pricing Information
Community Pulse
Geckoboard
Zendesk Explore
Features
Geckoboard
Zendesk Explore
BI Standard Reporting
Comparison of BI Standard Reporting features of Product A and Product B
Geckoboard
9.3
5 Ratings
13% above category average
Zendesk Explore
9.0
9 Ratings
10% above category average
Pixel Perfect reports
8.03 Ratings
7.15 Ratings
Customizable dashboards
10.05 Ratings
10.09 Ratings
Report Formatting Templates
10.04 Ratings
9.97 Ratings
Ad-hoc Reporting
Comparison of Ad-hoc Reporting features of Product A and Product B
Geckoboard
7.7
5 Ratings
5% below category average
Zendesk Explore
8.3
9 Ratings
3% above category average
Drill-down analysis
8.04 Ratings
9.59 Ratings
Formatting capabilities
8.03 Ratings
9.09 Ratings
Integration with R or other statistical packages
7.02 Ratings
4.85 Ratings
Report sharing and collaboration
8.05 Ratings
10.09 Ratings
Report Output and Scheduling
Comparison of Report Output and Scheduling features of Product A and Product B
Geckoboard
9.0
5 Ratings
8% above category average
Zendesk Explore
8.4
9 Ratings
1% above category average
Publish to Web
10.05 Ratings
6.96 Ratings
Publish to PDF
9.01 Ratings
9.07 Ratings
Report Versioning
9.02 Ratings
9.03 Ratings
Report Delivery Scheduling
8.03 Ratings
8.97 Ratings
Delivery to Remote Servers
9.03 Ratings
8.04 Ratings
Data Discovery and Visualization
Comparison of Data Discovery and Visualization features of Product A and Product B
Great value for the money. Excellent for smaller agencies with multiple projects and teams in a smaller space. We can quickly roll out mobile displays to help with a particular deployment push or monitoring a clients website engagement. It's also useful for showing live data without requiring analytics to run reports from a CRM, etc.
Zendesk Explore is well suited for tracking ticket flow, agent performance, and customer satisfaction providing valuable insights into response and resolution time, workload and support quality. Particularly useful for monitoring ticket handling for different teams. Helps ensure accountability by tracking how long tickets remain assigned before being reassigned to another group. Drill down capability helps identify support bottlenecks. However, it is less appropriate for real time monitoring as it lacks real time data updates making it unsuitable for instant decision making.
Some aspects of Zendesk, in general, are not super intuitive. The same goes for Zendesk Explore. And, while you can google answers and hope you find something helpful, there isn't a great way to learn to get the full potential out of the product unless you want to pay for someone from your team to take a class (which costs several hundred dollars).
To piggyback off the last point, if you would prefer to get help from a Zendesk expert, you'll find that there is almost no customer support available to you. For a company that aims to help other companies help their customers, this has always struck me as odd. Again, Google is your friend and beyond that, you're mostly out of luck.
With a simple interface and available templates, creating basic dashboards is easy. Obviously depending on the data you want to visualize, there may be higher learning curves. That being said, they have a huge amount of integrations and extensible frameworks. If you are using anything made in the past ten years there is an API function or integration that can get it talking to the platform. As such, it's pretty easy to hit the main data points you want and get it on a cheap display in front of your team.
I rate Zendesk Explore 8 out of 10 for it's overall usability because it offers powerful reporting and analytics with an easy to navigate interface and intuitive dashboards. It helps improve customer satisfaction by providing valuable insights into ticket handling, agent performance and customer satisfaction. Though the complex query builder can be challenging for non technical users.
The support levels vary based on the level of plan that you have but that's to be expected. Virtually everything except the Enterprise plan has basic chat/email support. While they are responsive they are not going to be much assistance in helping you figure out API calls or implementing 3rd party integrations. That is to be expected and the support community can pretty much get you in the right direction if you look.
Support for all of Zendesk has exceeding my expectations. This company will always get a 10 out of 10 in my book. Any question you have they make sure you have the answer plus a step-by-step guide on how to do each step so you are set up for success!
I selected Zendesk Explore only to provide an easy and quick access for my managers and supervisors regading metrics and volume trends. Is not the most flexible nor complete data visualization tool, but works well for day-to-day follow ups. You need to use another tool if you want to see long-term patterns (e.g. month over month volume trends) and you need another platform if you want your interaction metrics to interact with other important factors of the business
While we originally used this as an internal IS tool, we eventually have expanded it to be used by nearly every department.
Because pricing is monthly, we can grow or decrease our usage based on our current client needs.
Because it is low cost and easy to deploy, we can utilize it in place of considerable resources in analytics and reporting by delivering snapshots of data without pulling reports.