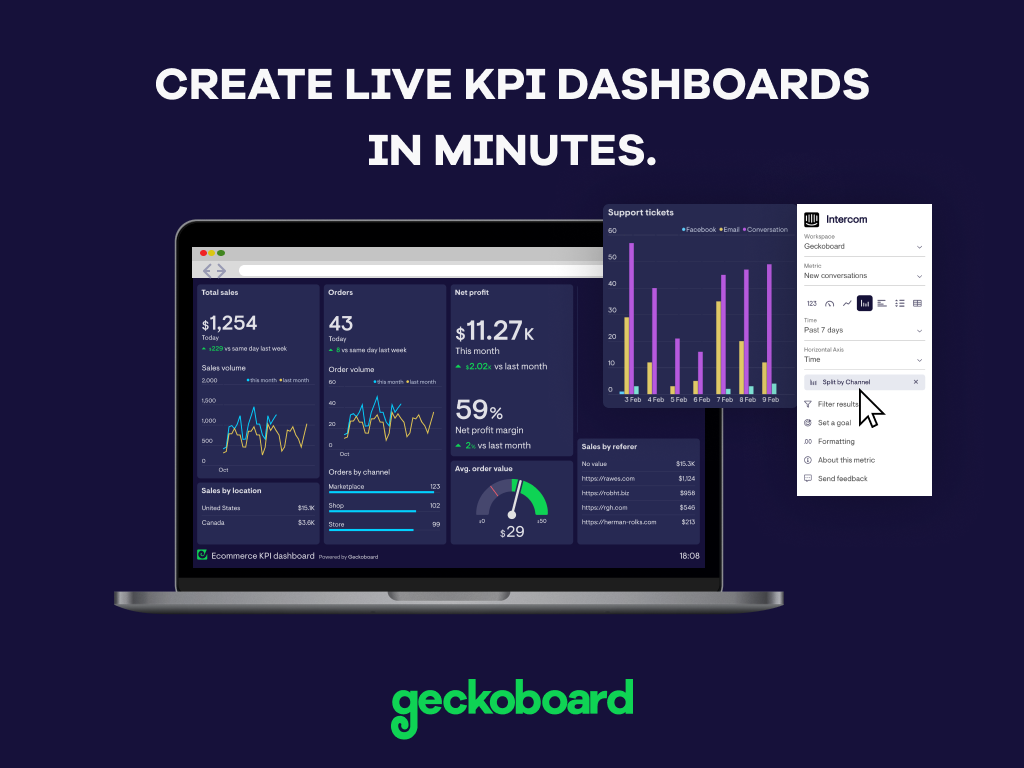
Geckoboard enables users to create real time dashboards using data from over 80 cloud services. It integrates with other products such as: AWeber, Basecamp, Campaign Monitor and HubSpot.
$35
per month
Cyfe
Score 8.8 out of 10
N/A
Cyfe is all-in-one dashboard software for analyzing data from online services like Google Analytics, Salesforce, AdSense, MailChimp, Amazon, Facebook, etc, from Traject.
Great value for the money. Excellent for smaller agencies with multiple projects and teams in a smaller space. We can quickly roll out mobile displays to help with a particular deployment push or monitoring a clients website engagement. It's also useful for showing live data without requiring analytics to run reports from a CRM, etc.
Cyfe might be for you if you are looking for a cost-effective way to display all of your marketing metrics in one place. If you are looking for a detailed, fine-tuned, niche, or extremely specific metrics, this might not be the best solution. Cyfe is good for a general health check-up of marketing, but not a finely tuned examination.
I'd love to see additional functionality to customize colors. The light/dark option is very nice, but a little more flexibility in the colors would go a long way, especially if it was possible at the dashboard level rather than just the account level. Along the same lines, being able to customize the charts a little more, for example being able to show an x-axis on single data type graphs, could make them easier to read in some cases.
Being able to choose to report on converted clicks or conversions in AdWords would be helpful.
Needs the ability to show the date range on the shared URL dashboards. Would be even better if the date range was adjustable on that view, too.
It has become a part of our internal tools so unless a competitor comes out with similar functionality as a similar price point it is unlikely that we would not renew. One area that would cause us not to renew would be if a competing service came out with more third-party integrations that match our needs. Price at this point is no longer an issue as it would allow us to automate a somewhat manual process that we have now connecting Cyfe widgets to Google Sheets.
With a simple interface and available templates, creating basic dashboards is easy. Obviously depending on the data you want to visualize, there may be higher learning curves. That being said, they have a huge amount of integrations and extensible frameworks. If you are using anything made in the past ten years there is an API function or integration that can get it talking to the platform. As such, it's pretty easy to hit the main data points you want and get it on a cheap display in front of your team.
I gave it a rating of 7 because it does a good job at what it does, but there are missing that are missing which I would have benefited from. For instance, if I was able to drill down more on the specific metrics I was able to see, that would have been helpful.
The support levels vary based on the level of plan that you have but that's to be expected. Virtually everything except the Enterprise plan has basic chat/email support. While they are responsive they are not going to be much assistance in helping you figure out API calls or implementing 3rd party integrations. That is to be expected and the support community can pretty much get you in the right direction if you look.
Because I had a very minor question and I was able to speak directly to the founder through LinkedIn and through email. I know that as they grow this may not always be an option but the fact that he made himself available to answer my questions said a lot about his passion for the product.
Cyfe is a 15 minutes implementation, then some time to get your data sources created. This is an easy one person job that will not result in down time or unnecessary wasted man hours.
The Salesforce dashboard is comparably flexible and intuitive, but designed more to its internal CRM focus. SumAll shares the social media dashboard capabilities, but lacks all others. Its interesting feature is side-by-side graph analysis for cross-channel performance. Cyfe might borrow from SumAll's default weekly email summary of performance from the dashboard, but implementation could be too complex. Nuvi dashboard is exclusively for social media marketing, but lacks Cyfe's flexibility for third party integration and window customization settings.
While we originally used this as an internal IS tool, we eventually have expanded it to be used by nearly every department.
Because pricing is monthly, we can grow or decrease our usage based on our current client needs.
Because it is low cost and easy to deploy, we can utilize it in place of considerable resources in analytics and reporting by delivering snapshots of data without pulling reports.