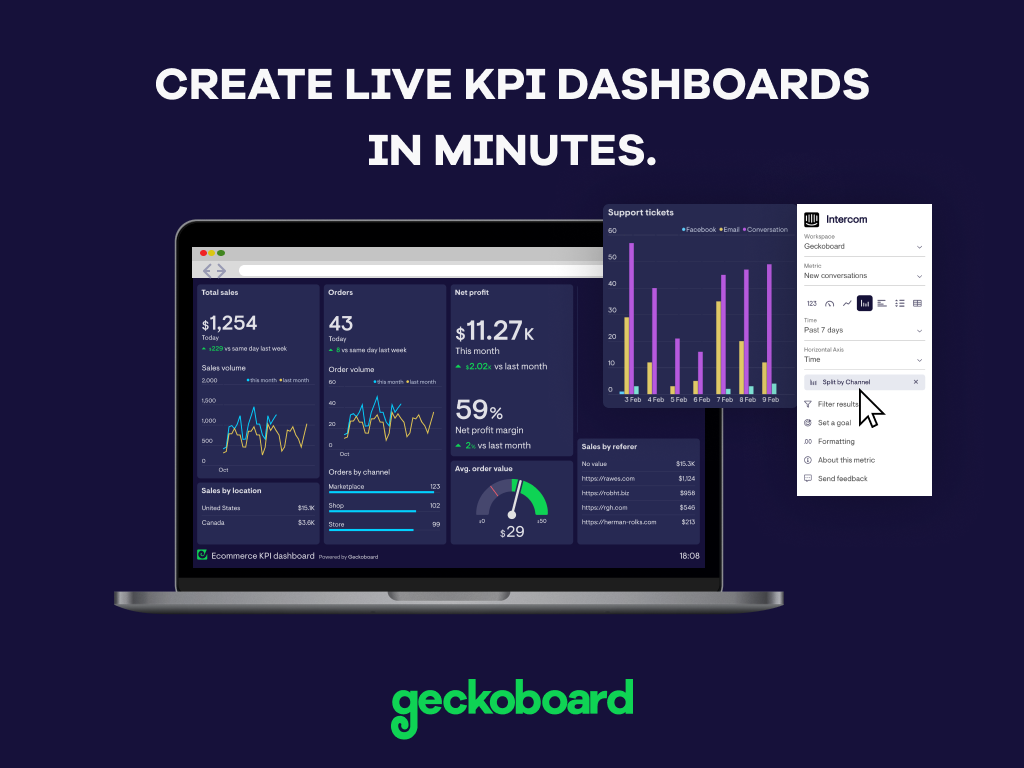
Geckoboard enables users to create real time dashboards using data from over 80 cloud services. It integrates with other products such as: AWeber, Basecamp, Campaign Monitor and HubSpot.
$35
per month
Tableau Desktop
Score 8.1 out of 10
N/A
Tableau Desktop is a data visualization product from Tableau. It connects to a variety of data sources for combining disparate data sources without coding. It provides tools for discovering patterns and insights, data calculations, forecasts, and statistical summaries and visual storytelling.
$75
per month per user
Pricing
Geckoboard
Tableau Desktop
Editions & Modules
Starter
$35
per month
Team
$159
per month
Team Plus
$275
per month
Company
$599
per month
Tableau
$75
per month per user
Tableau Enterprise
$115
per month per user
Offerings
Pricing Offerings
Geckoboard
Tableau Desktop
Free Trial
Yes
No
Free/Freemium Version
Yes
No
Premium Consulting/Integration Services
No
No
Entry-level Setup Fee
No setup fee
No setup fee
Additional Details
—
All pricing plans are billed annually.
More Pricing Information
Community Pulse
Geckoboard
Tableau Desktop
Features
Geckoboard
Tableau Desktop
BI Standard Reporting
Comparison of BI Standard Reporting features of Product A and Product B
Geckoboard
9.3
Ratings
13% above category average
Tableau Desktop
8.3
Ratings
2% above category average
Pixel Perfect reports
8.00 Ratings
8.80 Ratings
Customizable dashboards
10.00 Ratings
8.40 Ratings
Report Formatting Templates
10.00 Ratings
7.80 Ratings
Ad-hoc Reporting
Comparison of Ad-hoc Reporting features of Product A and Product B
Geckoboard
7.7
Ratings
5% below category average
Tableau Desktop
8.7
Ratings
8% above category average
Drill-down analysis
8.00 Ratings
8.60 Ratings
Formatting capabilities
8.00 Ratings
9.20 Ratings
Integration with R or other statistical packages
7.00 Ratings
7.70 Ratings
Report sharing and collaboration
8.00 Ratings
9.20 Ratings
Report Output and Scheduling
Comparison of Report Output and Scheduling features of Product A and Product B
Geckoboard
9.0
Ratings
8% above category average
Tableau Desktop
8.1
Ratings
2% below category average
Publish to Web
10.00 Ratings
7.30 Ratings
Publish to PDF
9.00 Ratings
7.90 Ratings
Report Versioning
9.00 Ratings
8.20 Ratings
Report Delivery Scheduling
8.00 Ratings
9.20 Ratings
Delivery to Remote Servers
9.00 Ratings
8.00 Ratings
Data Discovery and Visualization
Comparison of Data Discovery and Visualization features of Product A and Product B
A beautiful UI, with visuals that interest even those that hate staring at data. It's well suited for small to medium-sized businesses/corporations in which high-level sharing of data between teams is required -- the larger the distance between teams, the better as it's a great tool for level-setting on complex data. It would be less appropriate for small businesses, or those that do not need to summarize complex data to share with those not familiar with the data source
The best scenario is definitely to collect data from several sources and create dedicated dashboards for specific recipients. However, I miss the possibility of explaining these reports in more detail. Sometimes, we order a report, and after half a year, we don't remember the meaning of some data (I know it's our fault as an organization, but the tool could force better practices).
The Visualizations graphics are really good and the color options help in designing attractive charts. They help to convey more information and can be made interactive.
You can add filters with offer you to plug and play with values and understand different outcomes.
You can drag and drop options while creating charts and dashboards. also it is a very fluid layout.
Because right now its the best option out there (disclosure: I haven't used Qlikview or some of the other direct competitors of Tableau). The big investment is in Tableau Server not desktop. For the cost of the license of Tableau desktop, its a pretty good deal. You can hook it up to pretty much any data source easily. You can easily share the visualizations with your team/colleagues easily. Tableau Desktop is generally easy to use for business users. But the more advanced stuff is better suited for a analyst or someone with a IT/CS background.
With a simple interface and available templates, creating basic dashboards is easy. Obviously depending on the data you want to visualize, there may be higher learning curves. That being said, they have a huge amount of integrations and extensible frameworks. If you are using anything made in the past ten years there is an API function or integration that can get it talking to the platform. As such, it's pretty easy to hit the main data points you want and get it on a cheap display in front of your team.
Tableau Desktop has proven to be a lifesaver in many situations. Once we've completed the initial setup, it's simple to use. It has all of the features we need to quickly and efficiently synthesize our data. Tableau Desktop has advanced capabilities to improve our company's data structure and enable self-service for our employees.
When used as a stand-alone tool, Tableau Desktop has unlimited uptime, which is always nice. When used in conjunction with Tableau Server, this tool has as much uptime as your server admins are willing to give it. All in all, I've never had an issue with Tableau's availability.
Tableau Desktop's performance is solid. You can really dig into a large dataset in the form of a spreadsheet, and it exhibits similarly good performance when accessing a moderately sized Oracle database. I noticed that with Tableau Desktop 9.3, the performance using a spreadsheet started to slow around 75K rows by about 60 columns. This was easily remedied by creating an extract and pushing it to Tableau Server, where performance went to lightning fast
The support levels vary based on the level of plan that you have but that's to be expected. Virtually everything except the Enterprise plan has basic chat/email support. While they are responsive they are not going to be much assistance in helping you figure out API calls or implementing 3rd party integrations. That is to be expected and the support community can pretty much get you in the right direction if you look.
The Tableau Desktop's support team has been very helpful and tend to response very quickly. After all you have paid very premium price for the product and it goes to the services. This makes using the tool much easier for these who doesn't have such experience to get help quickly.
It is admittedly hard to train a group of people with disparate levels of ability coming in, but the software is so easy to use that this is not a huge problem; anyone who can follow simple instructions can catch up pretty quickly.
I think the training was good overall, but it was maybe stating the obvious things that a tech savvy young engineer would be able to pick up themselves too. However, the example work books were good and Tableau web community has helped me with many problems
Time needs to be spent ahead of implementation to make sure data sources are set up and ready. Consultants need to understand the data sources and the goals before setting foot on-site. Installation is easy, learning to use it takes time. The training resources available are great.
We are a Google shop and our Analytics and Reporting team have and use GDS. However, Geckoboard can output some of the same types of data (albeit maybe not as granular) and can be used by a wide swath of our users (including project managers, account execs, developers, etc.). We can also save and reuse boards for similar products and get our data in front of the eyes that need to see it quickly without a lot of fuss.
Tableau Desktop is clearly one of the best in the business. It has incredible capabilities, and many features are extremely useful. The intuitiveness of the dashboards and the graphical nature of the visualizations are widely used features and super helpful. One of the other benefits is that both programmers and non-programmers can equally explore and create their own opportunities, and seamless integration is possible.
Tableau Desktop's scaleability is really limited to the scale of your back-end data systems. If you want to pull down an extract and work quickly in-memory, in my application it scaled to a few tens of millions of rows using the in-memory engine. But it's really only limited by your back-end data store if you have or are willing to invest in an optimized SQL store or purpose-built query engine like Veritca or Netezza or something similar.
While we originally used this as an internal IS tool, we eventually have expanded it to be used by nearly every department.
Because pricing is monthly, we can grow or decrease our usage based on our current client needs.
Because it is low cost and easy to deploy, we can utilize it in place of considerable resources in analytics and reporting by delivering snapshots of data without pulling reports.