
Geckoboard vs. KronoGraph timeline visualization toolkit
| Product | Rating | Most Used By | Product Summary | Starting Price |
|---|---|---|---|---|
 Geckoboard | Score6.2 out of 10 | Mid-Size Companies (51-1,000 employees) | Geckoboard enables users to create real time dashboards using data from over 80 cloud services. It integrates with other products such as: AWeber, Basecamp, Campaign Monitor and HubSpot. | $35 per month |
 KronoGraph timeline visualization toolkit | N/A | N/A | KronoGraph is a JavaScript SDK for building browser-based, interactive, investigative timeline visualizations that reveal how events unfold. Tools built with KronoGraph give users insight into sequences of events and how they are connected. Users can scroll through time to uncover anomalies and patterns, driving investigations and revealing the hidden story in their data. Timeline visualizations transition smoothly to look good at any scale – from a single event to a… | N/A |
| Geckoboard | KronoGraph timeline visualization toolkit | |||||||||||||||
|---|---|---|---|---|---|---|---|---|---|---|---|---|---|---|---|---|
| Editions & Modules |
| No answers on this topic | ||||||||||||||
| Offerings |
| |||||||||||||||
| Entry-level Setup Fee | No setup fee | No setup fee | ||||||||||||||
| Additional Details | — | — | ||||||||||||||
| More Pricing Information | ||||||||||||||||
| Geckoboard | KronoGraph timeline visualization toolkit | ||||||||||||||||||||||
|---|---|---|---|---|---|---|---|---|---|---|---|---|---|---|---|---|---|---|---|---|---|---|---|
| BI Standard Reporting |
| ||||||||||||||||||||||
| Ad-hoc Reporting |
| ||||||||||||||||||||||
| Report Output and Scheduling |
| ||||||||||||||||||||||
| Data Discovery and Visualization |
| ||||||||||||||||||||||
| Access Control and Security |
| ||||||||||||||||||||||
| Mobile Capabilities |
| ||||||||||||||||||||||
| Application Program Interfaces (APIs) / Embedding |
| ||||||||||||||||||||||
| Geckoboard | KronoGraph timeline visualization toolkit | |
|---|---|---|
| Small Businesses |  Cyfe Score8.8 out of 10 |  Looker Studio Score7.6 out of 10 |
| Medium-sized Companies |  Zendesk Explore Score8.7 out of 10 |  Jet Reports Score9.5 out of 10 |
| Enterprises |  Jaspersoft Community Edition Score9.7 out of 10 |  Grafana Score8.7 out of 10 |
| All Alternatives | View all alternatives | View all alternatives |
| Geckoboard | KronoGraph timeline visualization toolkit | |
|---|---|---|
| Likelihood to Recommend | 9.0 | - |
| Likelihood to Renew | 8.0 | - |
| Usability | 9.0 | - |
| Support Rating | 8.0 | - |
| Data Sharing and Collaboration | 8.0 | - |
| Data Sources | 9.0 | - |
| Geckoboard | KronoGraph timeline visualization toolkit | |
|---|---|---|
| Likelihood to Recommend |
| No answers on this topic |
| Pros |
| No answers on this topic |
| Cons |
| No answers on this topic |
| Likelihood to Renew |
| No answers on this topic |
| Usability |
| No answers on this topic |
| Support Rating |
| No answers on this topic |
| Alternatives Considered |
| No answers on this topic |
| Return on Investment |
| No answers on this topic |
| ScreenShots | Geckoboard Screenshots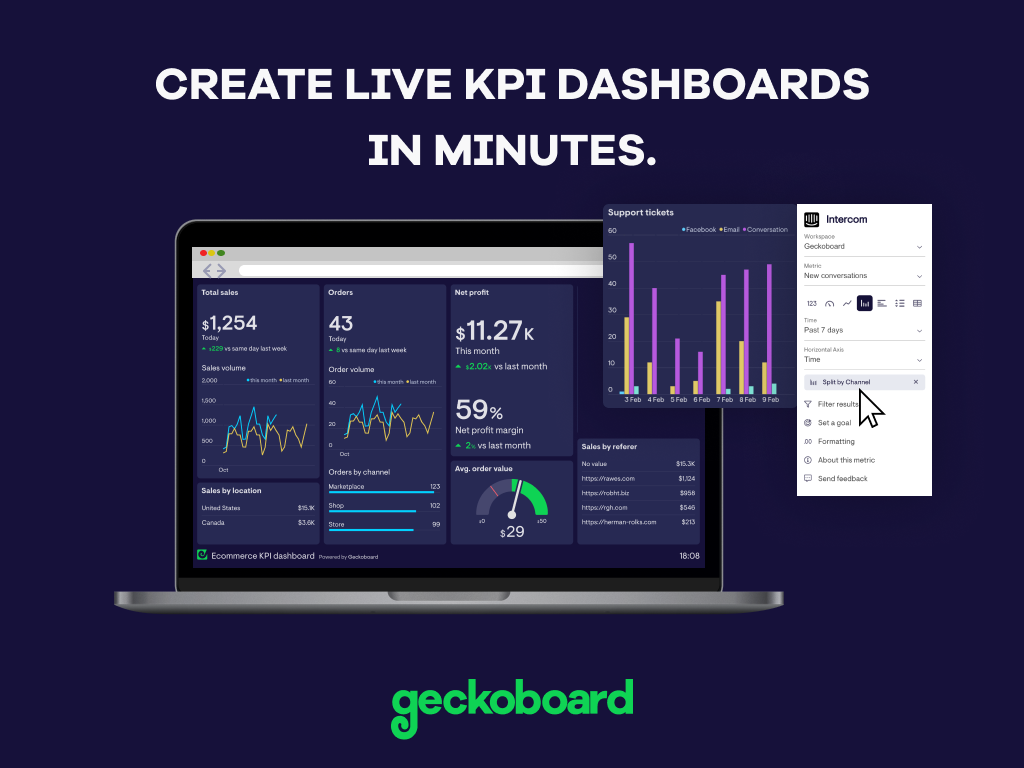     | KronoGraph timeline visualization toolkit Screenshots |


