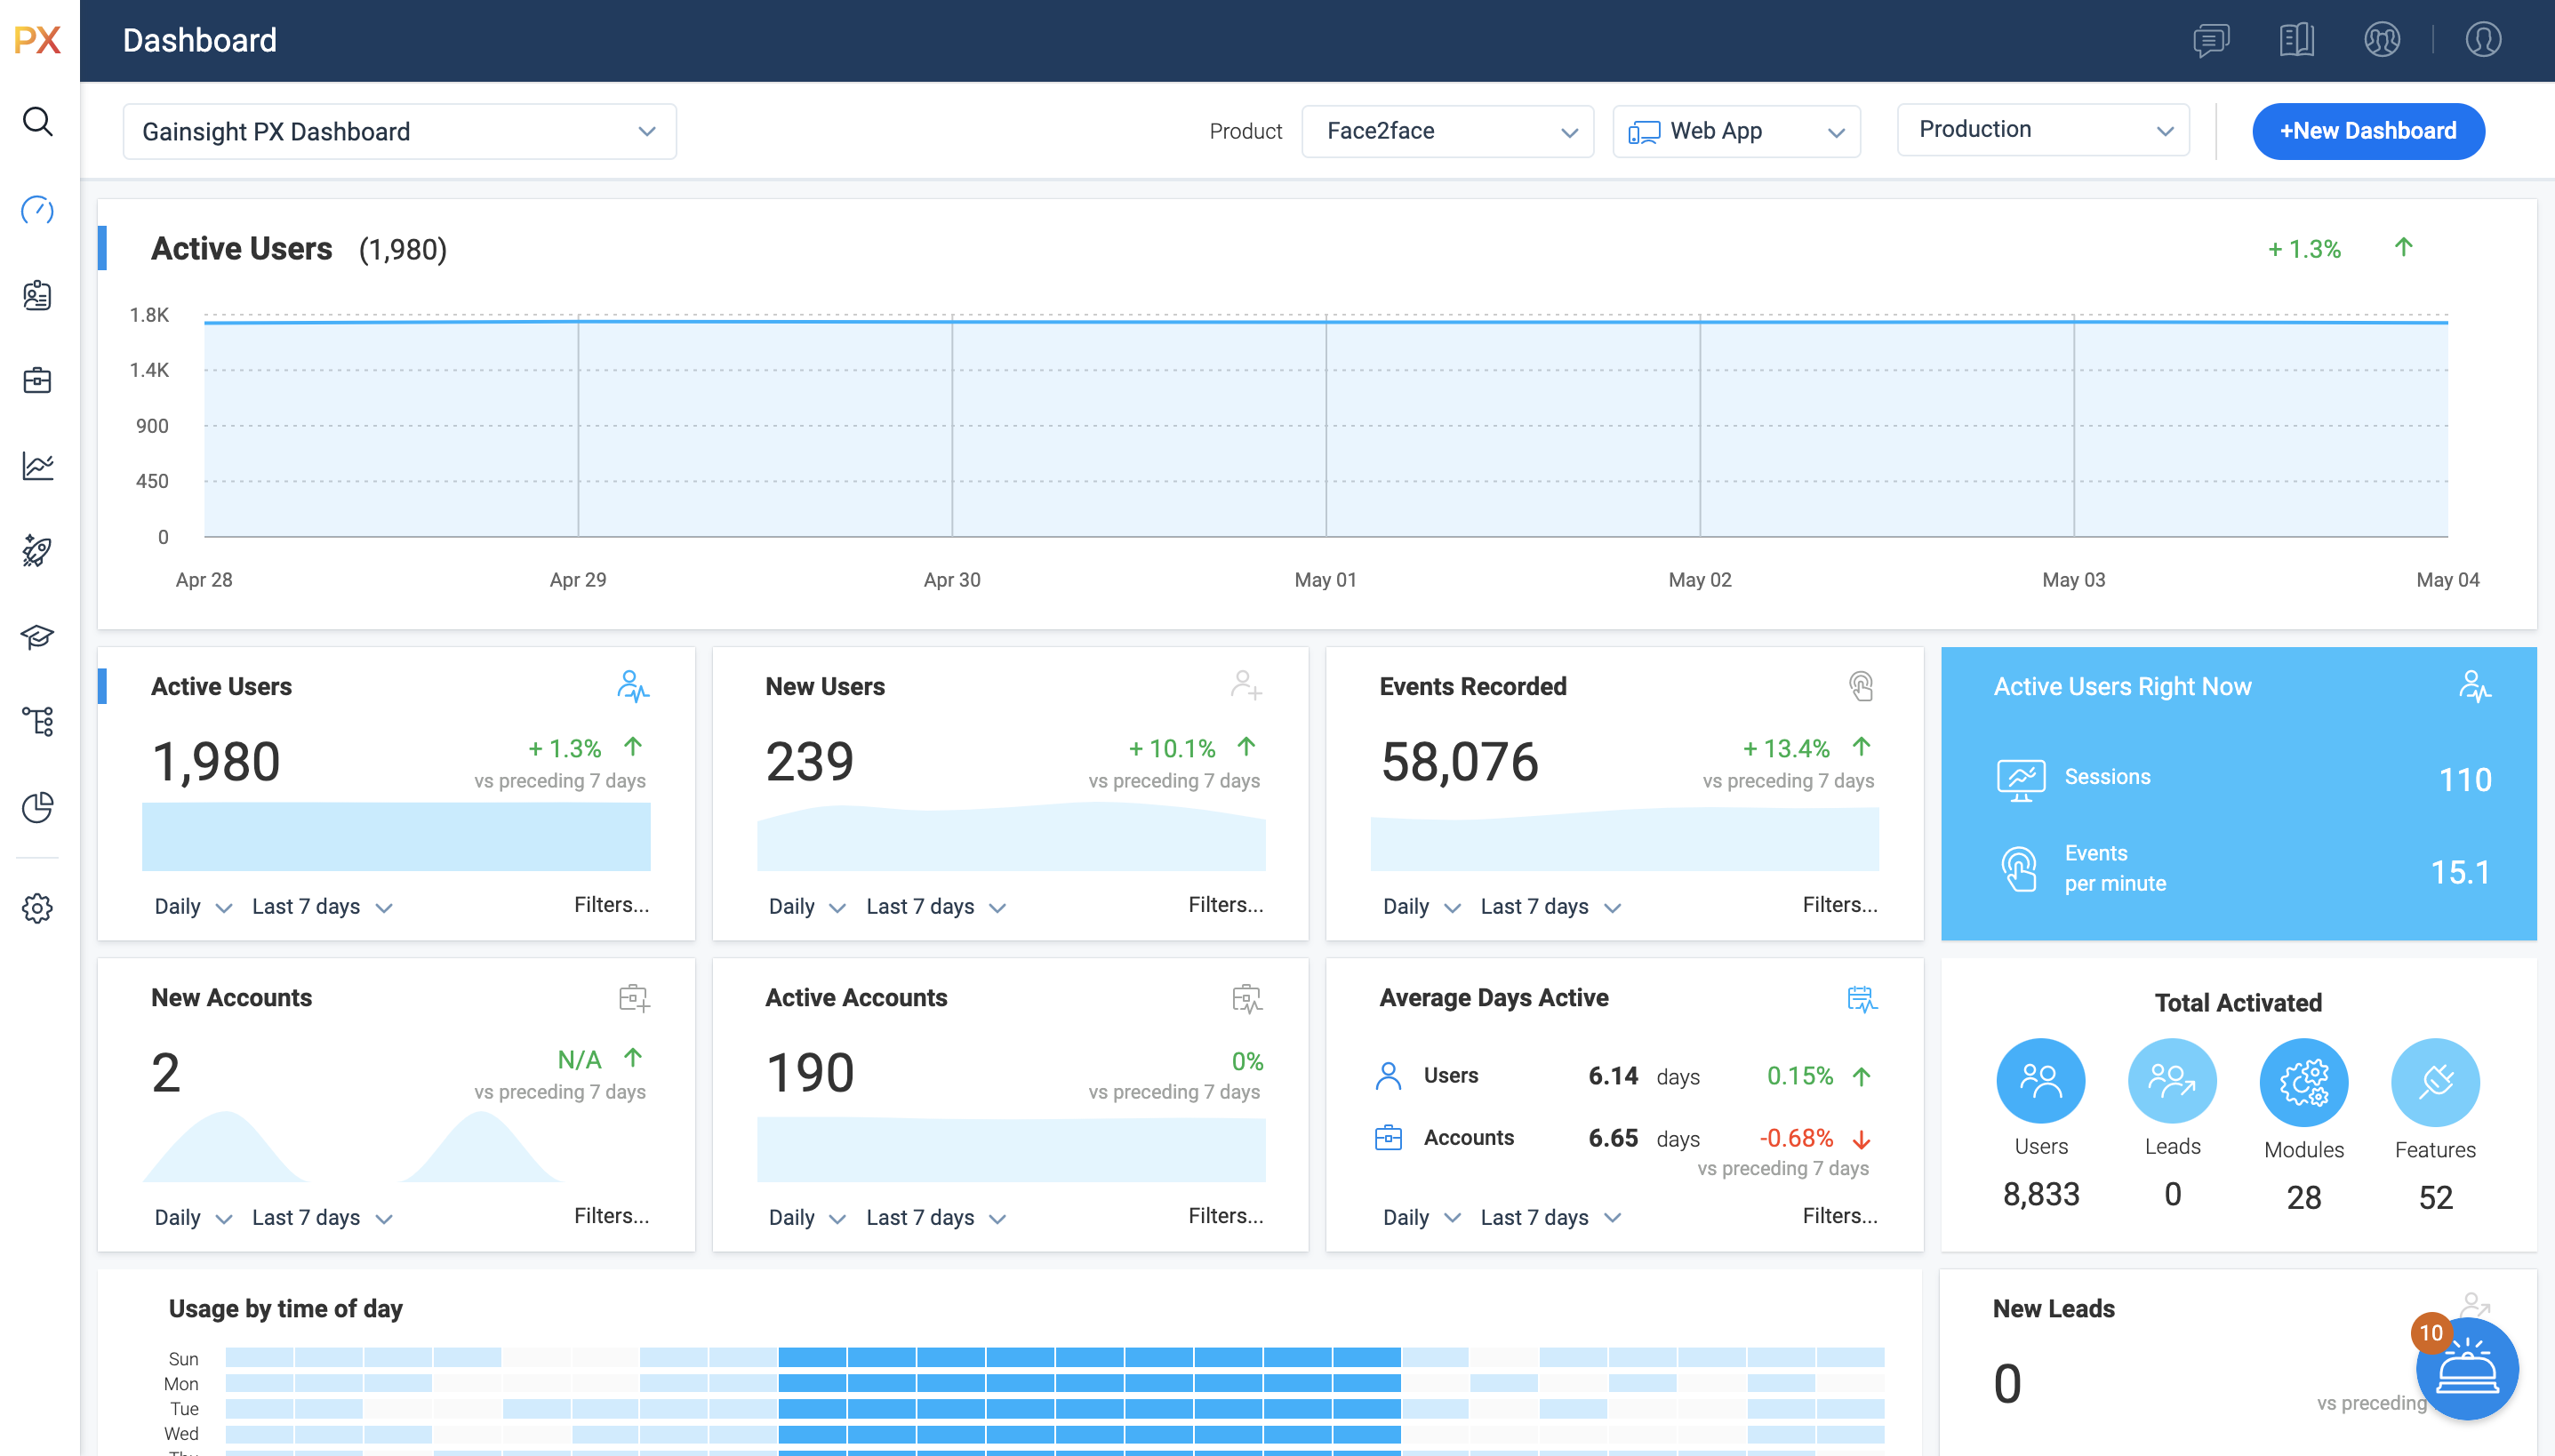
For SaaS products, Gainsight's product experience software enables companies to track every step of their user's journey and fully understand how they're interacting with a product over time.
$0
100 or less MAUs (Monthly Active Users)
Quantum Metric
Score 8.0 out of 10
Enterprise companies (1,001+ employees)
Quantum Metric is designed to help organizations build better digital products faster. Their platform for Continuous Product Design gives business and IT teams a single version of truth which the vendor describes as fast, quantified, and grounded on what customers actually experience. The solution ultimately aims to help teams agree on priorities, build products customers love, and innovate with speed and confidence.
N/A
Pricing
Gainsight PX
Quantum Metric
Editions & Modules
Starter (Free)
$0
100 or less MAUs (Monthly Active Users)
Starter
Starting at $400/M
500+ MAUs (Monthly Active Users)
Growth
Custom
Per MAUs (Monthly Active Users) and more
No answers on this topic
Offerings
Pricing Offerings
Gainsight PX
Quantum Metric
Free Trial
Yes
No
Free/Freemium Version
Yes
No
Premium Consulting/Integration Services
No
No
Entry-level Setup Fee
No setup fee
No setup fee
Additional Details
—
—
More Pricing Information
Community Pulse
Gainsight PX
Quantum Metric
Features
Gainsight PX
Quantum Metric
Mobile Capabilities
Comparison of Mobile Capabilities features of Product A and Product B
Gainsight PX
-
Ratings
Quantum Metric
8.7
Ratings
8% above category average
Responsive Design for Web Access
00 Ratings
8.40 Ratings
Mobile Application
00 Ratings
8.60 Ratings
Dashboard / Report / Visualization Interactivity on Mobile
00 Ratings
9.00 Ratings
Mobile App Analytics
00 Ratings
8.60 Ratings
Results and Analysis
Comparison of Results and Analysis features of Product A and Product B
It’s a robust tool that allows you to easily map and track key features and actions within your products. It also allows for in app communications to help guide the user through the path you want them to follow. The ability to connect with Gainsight CS also allows you to leverage that data to drive actions for the account team, incorporate it in health scoring, and use it to trigger digital programs. You do need a well thought out strategy for management of the platform, the data and how you will use it.
If you're looking to go beyond session replay and have a tool with intelligence to show you specific issues, and prioritize those, I think this is a good tool. Retailers that have had ups and downs, and are maybe seeing an increase in their online traffic/sales, who want a better view of how to improve the customer experience. You need a fairly mature digital analytics environment for this to make sense. If you have a more basic analytics environment, or you don't have the people/skills to use all the information QM can provide, it's probably not a good fit.
Mapping your product is easier with PX than with Google Analytics (mapping your product makes usage data appear as hits on mapped URLs, buttons, etc)
PX is good at showing simple messaging popups to customers.
PX Badge functionality—a persistent hover- and click-enabled popup launcher, positioned on select pages and attached to select elements—works well as a self-serve resource for users. It can be unobtrusive yet right there when needed.
PX modal content is fully editable HTML with plenty of flexibility.
Audience filters are really powerful. You can target users by many built-in and dev-configurable attributes, like device-type (which helped me work with mobile web users), browser, account, parts of the application visited/used in the last day, and many more.
Identifying user pain points and frustrations. Quantum Metrics has a data point called Rage Click which shows when a customer has clicked multiple times back to back on a particular section of the website.
Replaying a session to see everything that is loading on the front end to the customer, as well as the backed end of the website, has been critical in troubleshooting the experience.
Heatmaps are a awesome tool we have found very useful in showing engagement with different content on the page, how far user scroll & drop off and to see a split side by side view of the same page in an a/b test.
Quantum is a nice tool and is user friendly however I believe there always room for improvement. We have experienced minor issues with a few sessions which were solved by Quantum support reps in a timely manner and some of the dashboards are not as robust as other tools we use
It is a good product, but like with every product, there is room for improvement or even just things I, as a user, would prefer, such as the ability to click on a company and have it go to Salesforce instead of Insight. It can also be difficult to find certain reports.
For a new user, it's pretty intuitive to onboard and start doing the basic functionalities. But QM has a lot of functionalities which can be leveraged by more team members (especially when you don't have analysts dedicatedly using this) if further enhancements to usability are made.
I have not had to contact support frequently but when I have I used the chat and my questions were answered immediately. I've also used their knowledge center, help documentation and training videos which are all very thorough. The support we've received from our Customer Success Manager has been helpful as well.
I've been very impressed with the support Quantum Metric has provided. Our amazing Customer Success team has provided excellent service and has gone above and beyond in helping us use and understand the tool. We hold weekly calls with multiple teams and QM has been proactive in bringing things to our team's attention and making suggestions. The support has been one of the most important aspects of having QM and has allowed us to make great strides in improving how we use data and user research in our work.
I have used and evaluated a few similar products to Gainsight PX, including Appcues, WalkMe, and Pendo. I found that Gainsight PX was the most comprehensive and user-friendly platform, offering features such as customizable onboarding flows, product usage tracking, and automated customer success workflows.
Quantum Metric has unmatched support and is easy to use. The simple data visualization gave us an excellent analysis on specific pages and was a game changer. In other words, other tools may offer the same, but that's all. An easy-to-understand breakdown of how customers spent their time is provided. It makes it easier to empathize with others and understand their behaviors. Quantum Metric offers the whole package, unlike other tools.
Customer Sentiment. Customers have been excited when we can show them data around usage and where we can improve.
Deciding to remove features. We have used PX to identify features that have little to no usage which allows us to get rid of unnecessary process and maintenance.
Identifying areas of improvement. We are able to find areas of our product that we need to focus on improving where previously we would have missed or had a tough time justifying spending time and resources.