FortiMonitor vs. Splunk Observability Cloud

Overview
ProductRatingMost Used ByProduct SummaryStarting Price
FortiMonitor
Score 8.0 out of 10
N/A
FortiMonitor is a comprehensive, SaaS-based digital experience monitoring (DEM) platform that helps organizations modernize their performance-monitoring tools. It provides visibility into endpoint application performance and digital experience—no matter where the user resides or where the application is hosted. It is based on Panopta, which was acquired by Fortinet in late 2020.N/A
Splunk Observability Cloud
Score 9.0 out of 10
N/A
Splunk Observability Cloud aims to enable operational agility and better customer experience through real-time AI-driven streaming analytics allowing accurate alerts in seconds. It is designed to shorten MTTD and MTTR by providing real-time visibility into cloud infrastructure and services.
$15
per month (billed annually) per host
Pricing
FortiMonitorSplunk Observability Cloud
Editions & Modules
No answers on this topic
Infrastructure
$15
per month (billed annually) per host
App & Infra
$60
per month (billed annually) per host
End-to-End
$75
per month (billed annually) per host
Offerings
Pricing Offerings
FortiMonitorSplunk Observability Cloud
Free Trial
YesYes
Free/Freemium Version
NoNo
Premium Consulting/Integration Services
NoNo
Entry-level Setup FeeNo setup feeNo setup fee
Additional DetailsOur simple, usage-based pricing model is ideal whether you have five servers, or 500 hundred. You’ll be charged monthly per the number of instances monitored, and any additional features you’re using, such as CounterMeasures and synthetic checks. Standard Instances - $6/Instance Network Devices - $9/Device Containers - $2/Container
More Pricing Information
Community Pulse
FortiMonitorSplunk Observability Cloud
Best Alternatives
FortiMonitorSplunk Observability Cloud
Small Businesses
SolarWinds Pingdom
SolarWinds Pingdom
Score 9.7 out of 10
InfluxDB
InfluxDB
Score 8.8 out of 10
Medium-sized Companies
Cisco ThousandEyes
Cisco ThousandEyes
Score 8.9 out of 10
Sumo Logic
Sumo Logic
Score 9.4 out of 10
Enterprises
Cisco ThousandEyes
Cisco ThousandEyes
Score 8.9 out of 10
NetBrain Technologies
Score 9.2 out of 10
All AlternativesView all alternativesView all alternatives
User Ratings
FortiMonitorSplunk Observability Cloud
Likelihood to Recommend
8.0
(0 ratings)
8.6
(0 ratings)
Likelihood to Renew
-
(0 ratings)
6.4
(0 ratings)
Usability
-
(0 ratings)
7.3
(0 ratings)
User Testimonials
FortiMonitorSplunk Observability Cloud
Likelihood to Recommend
It is great for monitoring internet connections.
The agent installed on Windows works efficiently and takes up little resources. The method of settling costs is not very clear.
There should also be a table with the current list of costs visible.
Read full review
The query language is relatively easy and flexible when looking into an application's problems. These queries can then be used for alerts, reports, and dashboards. I believe Splunk is a platform that can help a system grow into its proactive application management, using incidents to add insights as needed without trying to work out every scenario in advance.
Read full review
Pros
  • Monitoring from several locations
  • Fast notification
  • Push notifications, SMS and calling
Read full review
  • The first one is its Kubernetes container monitoring.
  • I really like this features because as we know how much K8s is vast and to manually monitor each part of the Kubernetes it takes so much time but Splunk Observability Cloud makes it easier. And even once we integrate K8s with Splunk Observability Cloud it gives us some prebuilt dashboards which gives holistic view of our Cluster and its nodes, pods, etc.
  • The dashbaord feature of Splunk Observability Cloud, it gives us full flexibility to customize our dashboard with a wide range of predefined chart types.
  • Now it also supports OTEL, which is a plus point for observability. As now everyone is moving towards Otel and in current market there are only few tools who supports OTEL based integrations, Splunk Observability Cloud is one out of them.
Read full review
Cons
  • Simplifying the interface
  • Simplification of the process, e.g. notifications to Slack
  • Dark mode for panel and dashboard
  • Push notification - should contain more detailed information
  • A nicer looking dashboard
Read full review
  • An indicator for errors on the navigations pane so that we don't have to go through each tab.
  • As we go more and more cloud maybe you guys can implement a pay-as-you-use strategy so that small companies using it not frequently can also afford it.
  • That's it can't think of any and it wont let me skip to next question. Thanks
Read full review
Likelihood to Renew
No answers on this topic
Good: Stable system with low error rate Easy to use for simple use cases Bad: UI is not very clear for complex usage Mobile view (when logged in from phone) is bad No library for .net
Read full review
Usability
No answers on this topic
When there is an issue, it’s a win if one can easily identify the root cause. To do the same, it should allow the user to dig deep with multiple data points and compare the data and identify the anomaly. In this use case, it’s good to drive from Splunk 011y.
Read full review
Support Rating
No answers on this topic
Splunk support is very quick and efficient. Pre-sale specialists are very skilled and available.
Read full review
Implementation Rating
No answers on this topic
Follow a training before starting.
Read full review
Alternatives Considered
Panopta management from the cloud (remote panel).
Easy work on installation.
To monitor servers, it is enough for the server to have contact only with the Internet.

Multiple channels for sending notifications.
Read full review
We initially chose Splunk Observability Cloud because it promised full-stack visibility and tighter integration. The other tools didn't offer this as part of the core package. Their analytics and real-time dashboards looked strong during the demo but it turned out to a lot heavier and more complex than expected. If I had to decide again, I’d probably go with something more streamlined and easier to manage.
Read full review
Return on Investment
  • Provides high availability of services
Read full review
  • Significantly reduced the MTTR (Mean Time To Recovery), which in turn has improved the end-user experience tremendously.
  • Meets compliance requirements of security policies, audit, regulation, and forensics.
  • Helps us to track/manage the resource usage on our cloud instances which has a direct implication on the recurring cost.
Read full review
ScreenShots

FortiMonitor Screenshots

Screenshot of Customizable dashboards offer a wide variety of widgets so you can easily adjust them to your workflow and track the health and performance of your deployments.Screenshot of Automate diagnostics and remediation. Whether it’s running a complex synthetic test or automatically restarting a system so that it will come back online, leave those tasks to us while your team gets back to what matters.Screenshot of Incidents include metrics and meta-data so engineers can begin working on the incident as soon as they’ve received an alert.

Integrating your alerting and and incident management creates a seamless, easy-to-use experience.  

Engineers can quickly acknowledge alerts, both from Panopta and the mobile app, making it easy for their teammates to see which incidents still need to be addressed. 

With customizable alerting workflows, creating alert policies which suit your team is simple and intuitiveScreenshot of Alert Timelines automatically escalate incidents if they remain open.

Assign leads to incidents, making delegation and keeping team members in the loop easy.

By running diagnostics using CounterMeasures, teams can quickly determine whether an admin is necessary to resolve the issue
Review and approve CounterMeasures to enrich incidents with more context.Screenshot of Know which incidents are being worked on at-a-glance.

Engineers can easily escalate an incident if they need a senior team member to resolve the issue.

Integrates with popular communication and ticketing tools like Slack and JIRA.

Stay connected with your team using the mobile app, or take quick actions like acknowledging, scheduling maintenance, or approve a CounterMeasure so your team knows you’re on it.Screenshot of Incidents are enriched with diagnostics and metrics, and include streamlined views of all related events that make it easier to diagnose and resolve incidents.

Engineers are able to see the full context of an incident before logging into any systems.

CounterMeasures provide an automated way to diagnose and resolve incidents, allowing engineers to focus on more valuable activities.

Metrics and data from incidents can be elevated to the incident summary, providing an easy way for teams to reference what they’d done to fix similar problems in the past.

Splunk Observability Cloud Screenshots

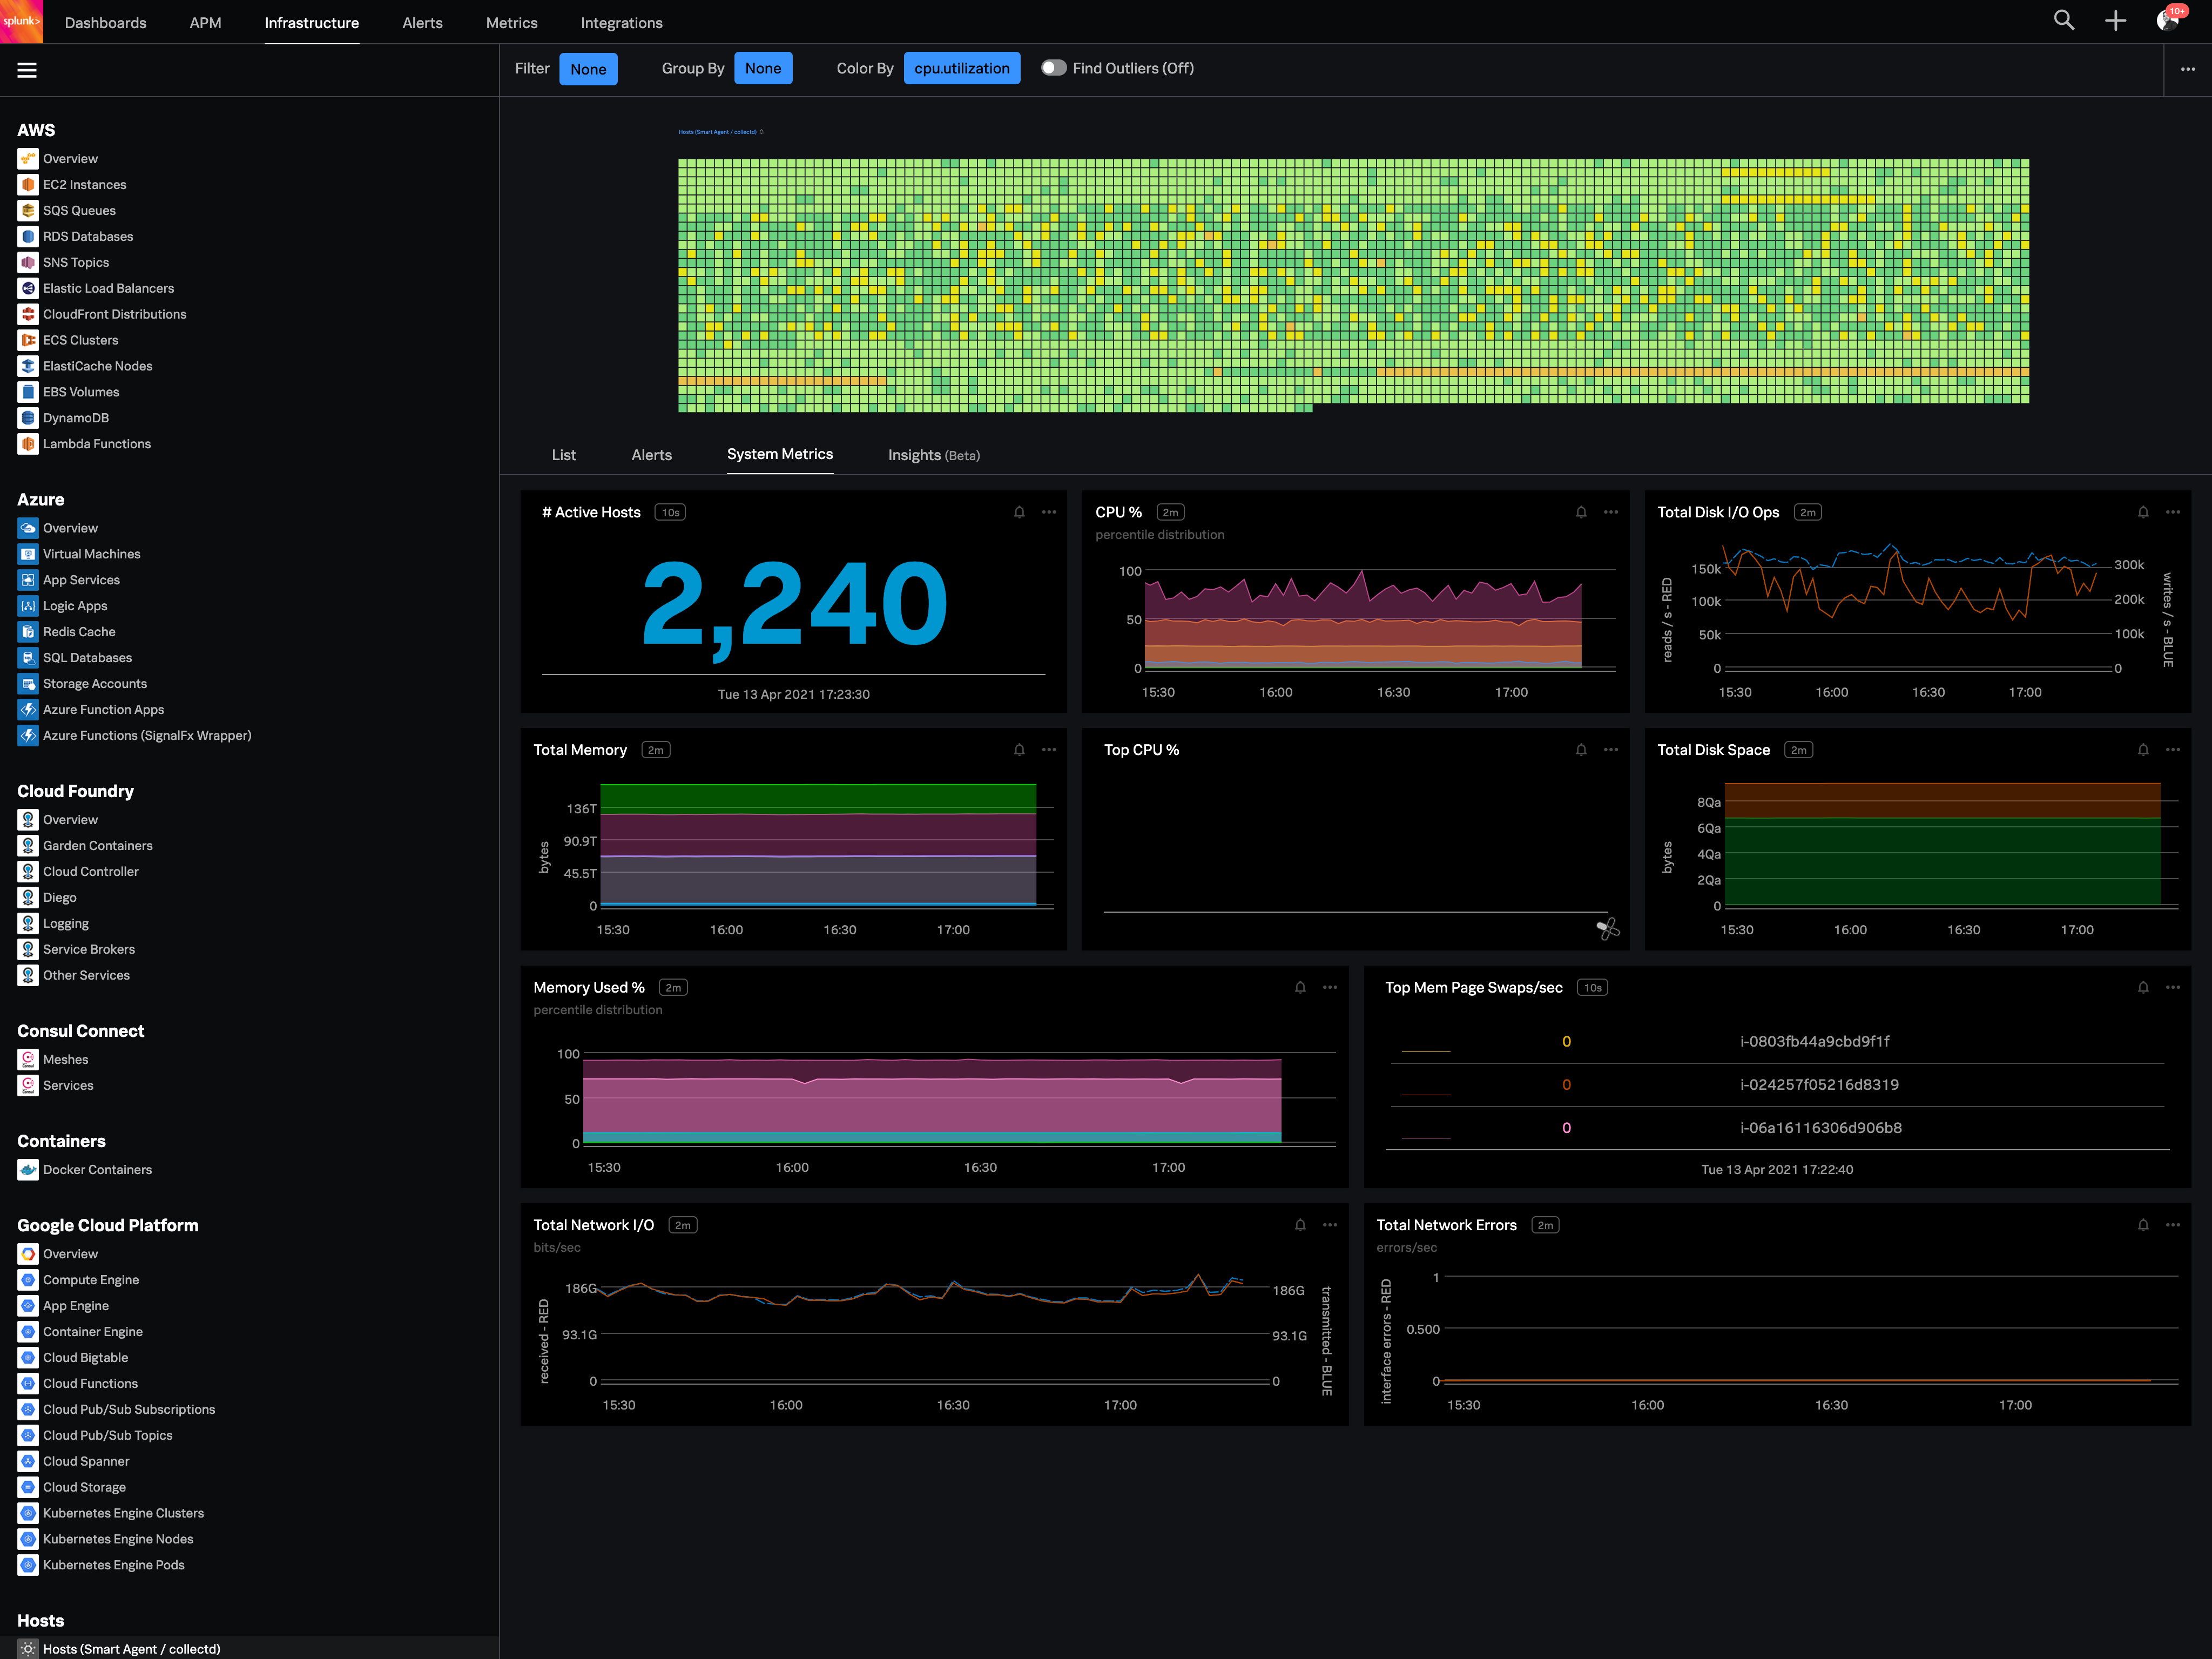
Screenshot of Real-time monitoring for public, private and hybrid cloud