
Entuity vs. PingPlotter
| Product | Rating | Most Used By | Product Summary | Starting Price |
|---|---|---|---|---|
 Entuity | Score8.9 out of 10 | N/A | The Entuity network monitoring tool from Park Place Technologies (acquired 2019) automates network discovery and uses workflows that enable users to see when something has gone wrong. Responsive dashboards allow users to take a high-level view to gauge network health or drill down to the component level to fix network problems. | N/A |
 PingPlotter | Score9.3 out of 10 | N/A | PingPlotter is a graphical traceroute and ping tool that visualizes network performance in a way that makes identifying the source of problems quicker and easier for everyone from online gamers and video streamers to VoIP admins and IT pros. Features for remote deployment, network monitoring, scripting, and a web interface are included along with several additional capabilities. | $0 per user |
| Entuity | PingPlotter | |||||||||||||||
|---|---|---|---|---|---|---|---|---|---|---|---|---|---|---|---|---|
| Editions & Modules | No answers on this topic |
| ||||||||||||||
| Offerings |
| |||||||||||||||
| Entry-level Setup Fee | No setup fee | No setup fee | ||||||||||||||
| Additional Details | — | — | ||||||||||||||
| More Pricing Information | ||||||||||||||||
| Entuity | PingPlotter | |
|---|---|---|
| Considered Both Products | No answer on this topic | No answer on this topic |
| Key User Insights | ||
| Would buy again | ||
No answers on this topic | 100% Would buy again 26 Answers | |
| Delivers good value for the price | ||
No answers on this topic | 95% Delivers good value for the price 20 Answers | |
| Happy with the feature set | ||
No answers on this topic | 100% Happy with the feature set 26 Answers | |
| Lived up to sales and marketing promises | ||
No answers on this topic | 100% Lived up to sales and marketing promises 18 Answers | |
| Implementation went as expected | ||
No answers on this topic | 100% Implementation went as expected 26 Answers | |
| Entuity | PingPlotter | ||||||||||||||||||||||||||||||||||
|---|---|---|---|---|---|---|---|---|---|---|---|---|---|---|---|---|---|---|---|---|---|---|---|---|---|---|---|---|---|---|---|---|---|---|---|
| Network Performance Monitoring |
| ||||||||||||||||||||||||||||||||||
| Entuity | PingPlotter | |
|---|---|---|
| Small Businesses |  Auvik Score9.9 out of 10 | Auvik Score9.9 out of 10 |
| Medium-sized Companies | PingPlotter Score9.3 out of 10 |  Intermapper Score8.4 out of 10 |
| Enterprises |  Nmap Score10 out of 10 | Nmap Score10 out of 10 |
| All Alternatives | View all alternatives | View all alternatives |
| Entuity | PingPlotter | |
|---|---|---|
| Likelihood to Recommend | 10.0 | 9.6 |
| Usability | - | 8.4 |
| Support Rating | 10.0 | 9.0 |
| Entuity | PingPlotter | |
|---|---|---|
| Likelihood to Recommend |
|
|
| Pros |
|
|
| Cons |
|
|
| Usability | No answers on this topic |
|
| Support Rating |
|
|
| Alternatives Considered |
|
|
| Return on Investment |
|
|
| ScreenShots | PingPlotter Screenshots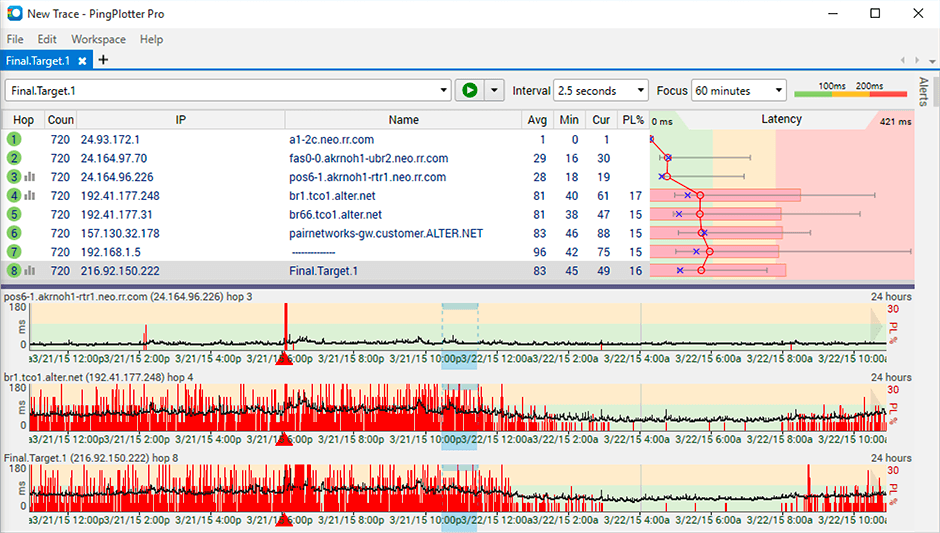   |


