Datadog vs. SolarWinds Engineer's Toolset

Overview
ProductRatingMost Used ByProduct SummaryStarting Price
Datadog
Score 8.4 out of 10
N/A
Datadog is a monitoring service for IT, Dev and Ops teams who write and run applications at scale, and want to turn the massive amounts of data produced by their apps, tools and services into actionable insight.
$1.27
per month (billed annually) per host
SolarWinds Engineer's Toolset
Score 9.4 out of 10
N/A
SolarWinds® Engineer’s Toolset (ETS) helps users monitor and troubleshoot a network with over 60 tools for network management. ETS allows users to monitor and receive alerts in real time on network availability and health, and perform network diagnostics for faster troubleshooting and resolution of complex network issues. With ETS users can deploy an array of network discovery tools including Port Scanner, Switch Port Mapper or advanced Subnet Calculator, manage Cisco® devices with specialized…
$1,585
Per Instance
Pricing
DatadogSolarWinds Engineer's Toolset
Editions & Modules
Log Management
$1.27
per month (billed annually) per host
Infrastructure
$15.00
per month (billed annually) per host
Standard
$18
per month per host
Enterprise
$27
per month per host
DevSecOps Pro
$27
per month per host
APM
$31.00
per month (billed annually) per host
DevSecOps Enterprise
$41
per month per host
One Time Price
$1,585
Per Instance
Offerings
Pricing Offerings
DatadogSolarWinds Engineer's Toolset
Free Trial
YesYes
Free/Freemium Version
YesNo
Premium Consulting/Integration Services
NoNo
Entry-level Setup FeeOptionalNo setup fee
Additional DetailsDiscount available for annual pricing. Multi-Year/Volume discounts available (500+ hosts/mo).
More Pricing Information
Community Pulse
DatadogSolarWinds Engineer's Toolset
Best Alternatives
DatadogSolarWinds Engineer's Toolset
Small Businesses
InfluxDB
InfluxDB
Score 8.8 out of 10
NinjaOne
NinjaOne
Score 9.0 out of 10
Medium-sized Companies
Sumo Logic
Sumo Logic
Score 9.4 out of 10
Intermapper
Intermapper
Score 8.4 out of 10
Enterprises
NetBrain Technologies
Score 9.2 out of 10
Cisco Meraki Dashboard
Score 9.3 out of 10
All AlternativesView all alternativesView all alternatives
User Ratings
DatadogSolarWinds Engineer's Toolset
Likelihood to Recommend
9.0
(0 ratings)
8.6
(0 ratings)
Usability
10.0
(0 ratings)
8.2
(0 ratings)
Support Rating
8.9
(0 ratings)
8.2
(0 ratings)
User Testimonials
DatadogSolarWinds Engineer's Toolset
Likelihood to Recommend
A one-stop solution for everything you need. Multiple functionalities are tailored to meet specific business needs. Logs are essential for any business, and Datadog manages logs effectively. Rum sessions are something new to me and have given us a new perspective on how to reverse engineer issues that we see for our customers.
Read full review
[SolarWinds Engineer's Toolset is] a great tool for monitoring database servers, highly recommended. The very good thing is that it keeps the history for two weeks, and you can see the time slice for all the server activities. Helps a lot to identify the memory and CPU bottlenecks, research blocking issues and kill the sessions, if necessary.
Read full review
Pros
  • Create Dashboards as per application, environments, and Custom metrics in one panel.
  • Log aggregation, one-stop Application monitoring tools for the whole infrastructure.
  • Playbooks, SLA definition, success and error quotas, request visualizations.
  • DB monitoring, Serverless stack monitoring.
  • Alerting of Production incidents so we can quickly resolve the issues on time.
Read full review
  • Debugging Tools
  • Saves Time for basic checks
  • Ping, Telnet, SSH right from the console and hence easy user management from console itself
Read full review
Cons
  • Alert windows cause lag in notifications (e.g. if the alert window is X errors in 1 hour, we won't get alerted until the end of the 1 hour range)
  • I would appreciate more supportive examples for how to filter and view metrics in the explorer
  • I would like a more clear interface for metrics that are missing in a time frame, rather than only showing tags/etc. for metrics that were collected within the currently viewed time frame
Read full review
  • The unifying component that is intended to be the initial interface to the tools seems clunky. I prefer to start the tools individually rather than using it.
  • The port scanner could use some improvements to make it easier to use.
Read full review
Usability
Datadog's user interface is quite friendly and easy to navigate. With menus clearly categorized, and ability to bookmark important dashboards, one can easily find what they're looking for. For dashboards, ability to move and resize visualizations and group them, is really helpful to organize dashboards. Automatic suggestions from Datadog for important visualizations based on the metrics and logs would provide another level of ease of use.
Read full review
Very easy to use and intuitive. Just be careful with the WAN Killer...it does what it says.
Read full review
Support Rating
The support team usually gets it right. We did have a rather complicate issue setting up monitoring on a domain controller. However, they are usually responsive and helpful over chat. The downside would be I don’t think they have any phone support. If that is important to you this might not be a good fit.
Read full review
Our organization uses it regularly. It is reliable, and we keep finding new uses for it
Read full review
Alternatives Considered
I selected Datadog because of its features and the wide range of integration support. As I already told it supports more that 600+ integrations which helps and organization to keep everything in a single place and also its AI feature which is reducing the time for root cause analysis. Its custom dashboards features which helps us to visualize the data in a more attractive way.
Read full review
These tools complement the Engineer's Toolset. They are excellent at detecting most issues and at keeping the network monitored and protected. However, when it comes time to dig into an issue, especially a hard to fix intermittent issue, these products lack the granularity of monitoring needed for these types of issues. Having said that the toolset is not made to do full time enterprise level monitoring. With these tools and the toolset I am able to have a more complete view of the network and deliver higher levels of service and quicker responses to issues.
Read full review
Return on Investment
  • Saved us (time & money) from developing our own monitoring utilities that would pale in comparison
  • Alerts allow us to remedy issues before our customers even know about them
  • Tracking resource usage over time allows us to better plan for future needs, before it becomes a pain-point.
Read full review
  • Spend less time downloading free buggy tools
  • All the tools in one spot, so you don't have to look around for tools
  • Get to the solution sooner
Read full review
ScreenShots

Datadog Screenshots

Screenshot of the out-of-the-box and customizable monitoring dashboards.Screenshot of Datadog's collaboration features, where users can discuss issues in-context with production data, annotate changes and notify their teams, see who responded to that alert before, and discover what was done to fix it.Screenshot of where Datadog unifies traces, metrics, and logs—the three pillars of observability.Screenshot of some of Datadog's 400+ built-in integrations.Screenshot of Datadog's Service Map, which decomposes an application into all its component services and draws the observed dependencies between these services in real timeScreenshot of centralized log data, pulled from any source.

SolarWinds Engineer's Toolset Screenshots

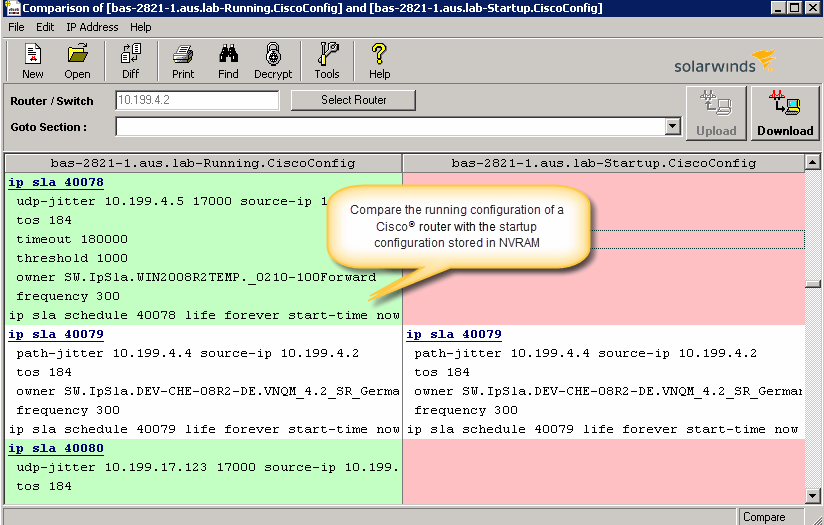
Screenshot of Perform network stress tests with Engineer's Toolset WAN Killer. You don’t need to use real traffic for studying network activities, like testing traffic and load balancing. Instead, deploy Engineer's Toolset WAN Killer to help interactively test connections and adjust the IP traffic generated to achieve the desired network load based on your requirements.Screenshot of Quickly troubleshoot your network with enhanced ping capabilities and packet route tracing, among other network bandwidth usage and monitoring tools included in ETS.Screenshot of Using ETS, you can run scans to gain insight into how routers, hubs switches, and other devices are configured by analyzing SNMP queries and viewing MIB attributes. ETS is designed to help you more easily understand whether your network and ports are using appropriate settings.Screenshot of Config Compare, a part of ETS, is built to compare the running configuration of a Cisco router with the startup configuration. With the Cisco configuration compare tool, you can easily detect the changes made to the network, switch, and router configurations that are not committed to non-volatile memory (NVRAM).Screenshot of Manage your IP network from discovery to address tracking. Discover subnets on a seed router and scan the subnet or a range of IP addresses, generate a list of subnets along with their mask, size, range, and broadcast address and actively monitor subnets to identify and track which IP addresses are in use on your network.