Datadog is a monitoring service for IT, Dev and Ops teams who write and run applications at scale, and want to turn the massive amounts of data produced by their apps, tools and services into actionable insight.
$18
per month per host
New Relic
Score7.9 out of 10
N/A
New Relic is a SaaS-based web and mobile application performance management provider for the cloud and the datacenter. They provide code-level diagnostics for dedicated infrastructures, the cloud, or hybrid environments and real time monitoring.
$0
No credit card required; 100 GB free ingest per month, 1 free full user + unlimited basic users, 8 days retention, 100 Synthetics Checks
Pricing
Datadog
New Relic
Editions & Modules
Log Management
$1.27
per month (billed annually) per host
Infrastructure
$15.00
per month (billed annually) per host
Standard
$18
per month per host
Enterprise
$27
per month per host
DevSecOps Pro
$27
per month per host
APM
$31.00
per month (billed annually) per host
DevSecOps Enterprise
$41
per month per host
Free (Forever)
$0
No credit card required; 100 GB free ingest per month, 1 free full user + unlimited basic users, 8 days retention, 100 Synthetics Checks
Telemetry Data Platform
$0.25
per month per extra GB data ingest (after first free 100GB per month)
Incident Intelligence
$0.50
per month per event (after first 1000 free events per month)
Standard
$99
per month per full user (after first free full user - unlimited free basic users)
Pro
Contact sales team
Enterprise
Contact sales team
Offerings
Pricing Offerings
Datadog
New Relic
Free Trial
Yes
No
Free/Freemium Version
Yes
Yes
Premium Consulting/Integration Services
No
No
Entry-level Setup Fee
Optional
No setup fee
Additional Details
Discount available for annual pricing. Multi-Year/Volume discounts available (500+ hosts/mo).
Datadog and New Relic both provide businesses with application monitoring tools to gauge performance and troubleshoot performance issues. Datadog is an IT infrastructure monitoring tool that gives IT and DevOps teams insight into their hardware and software stacks. New Relic is an application performance monitoring tool that offers detailed performance analytics for desktop, web, and mobile applications. Since Datadog is aimed at monitoring infrastructure at scale, it’s used primarily by mid-sized companies and large enterprises. New Relic, on the other hand, is used by businesses of all sizes, likely because its pricing tiers and functionality are relevant to a wide variety of team sizes and applications.
Features
While Datadog and New Relic both provide businesses with key information about their applications or infrastructure, they have a few unique features that set them apart from each other.
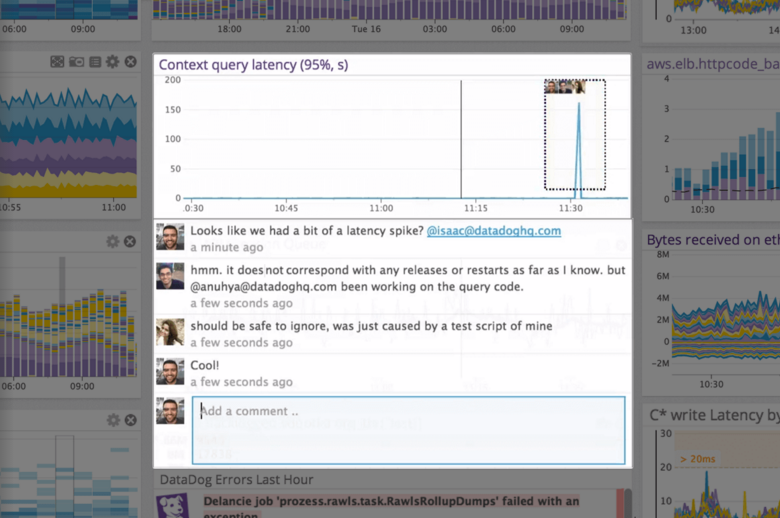
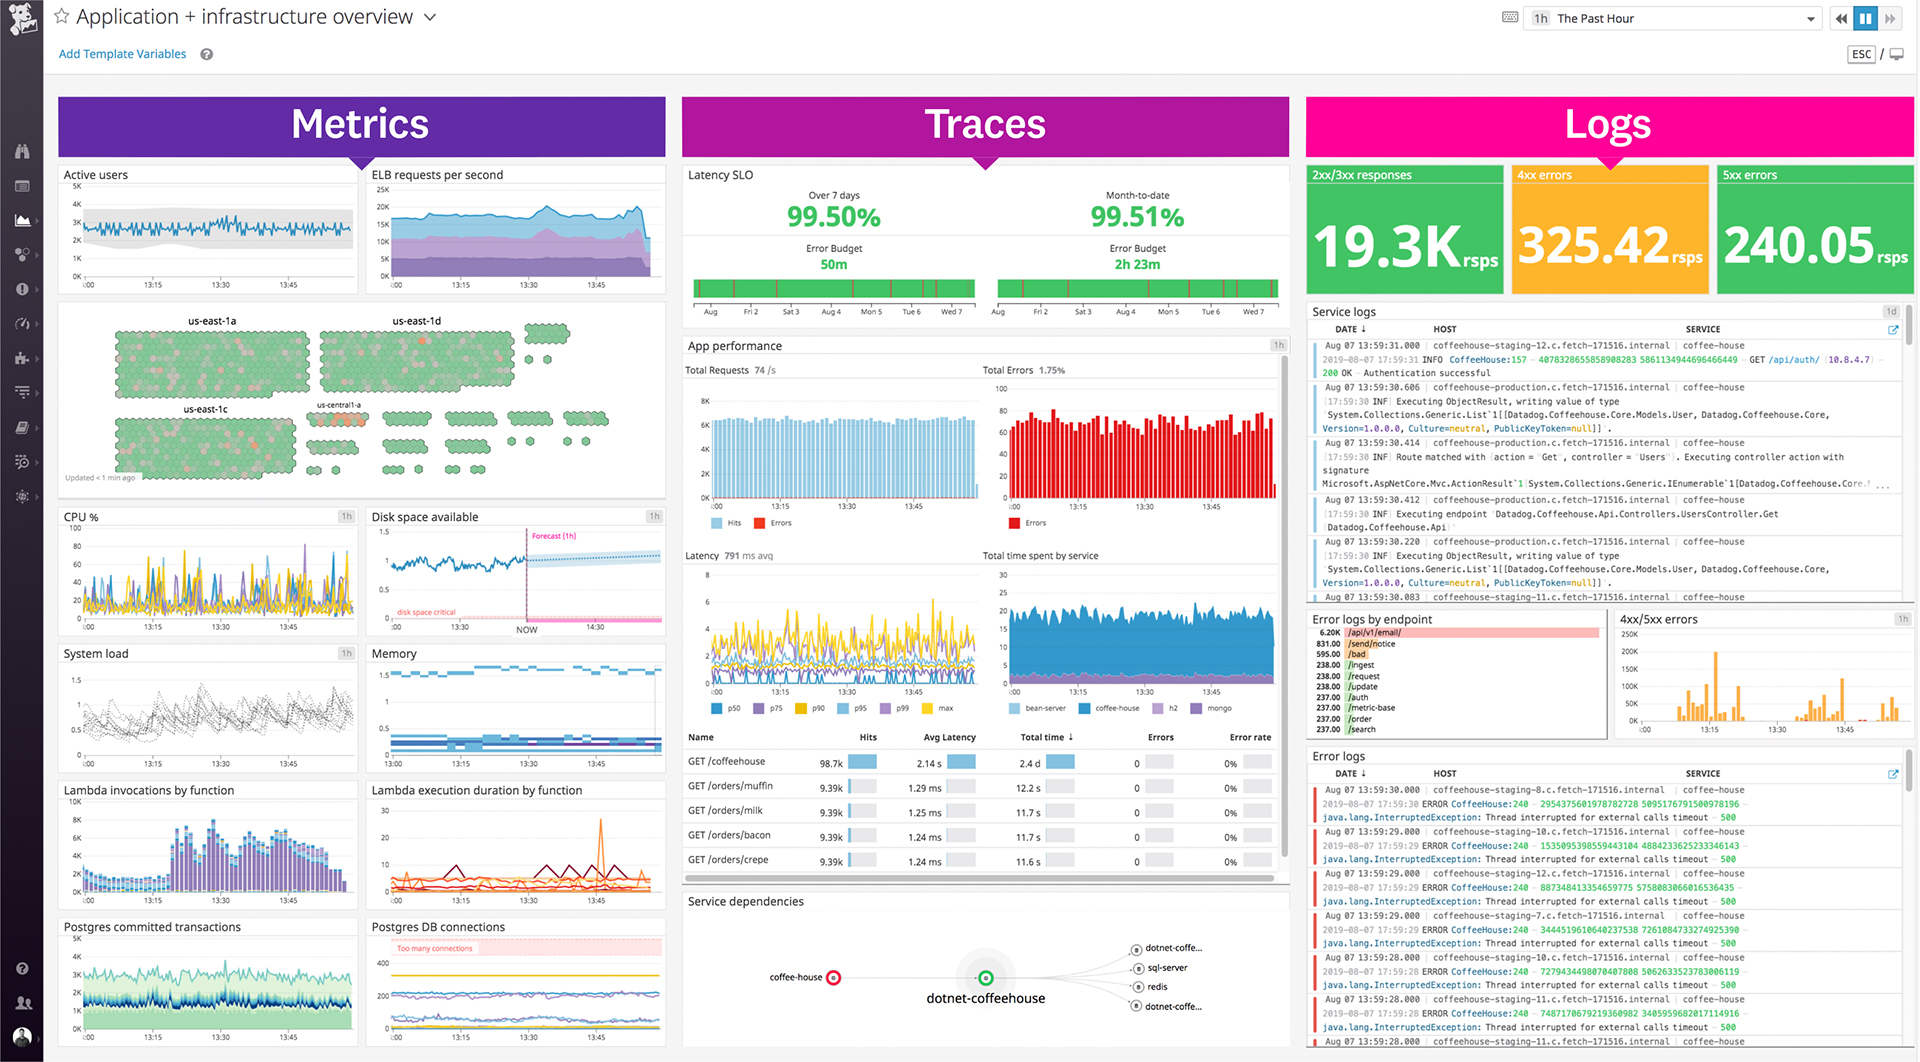
Datadog has a streamlined user interface that provides a centralized location for performance monitoring, alert management, and data analysis. Additionally, Datadog supports many community-built APIs and extensions, which are freely accessible to users of the platform. These extensions can help newcomers integrate Datadog into their existing IT infrastructure. Recent additions to the Datadog platform include a mobile app, a new UI for incident management, and out-of-the-box dashboards for investigating and analyzing infrastructure security.
New Relic is generally simple to install and implement, requiring no command-line scripting for Windows and Mac users. New Relic also includes strong data security features that ensure applications are as protected as possible from data breaches, which is particularly important for businesses monitoring applications with sensitive data. New Relic provides a wide variety of community resources for learning the application, helping users train themselves and troubleshoot issues without needing to contact support. Recently, New Relic overhauled their error dashboard, collecting stack traces and error metrics into a single overview for analysis and resolution. They’ve also added one-click permalinks for dashboards and curated views to help teams quickly share insights and analyses.
Limitations
Though Datadog and New Relic both monitor applications well, they do have a few limitations that are important to consider.
Datadog has a well-designed UI, but can be challenging for new users due to the sheer magnitude of options and data offered by the platform. Datadog can also be difficult to install, requiring command-line scripting on Windows and Mac environments, which can be a problem for businesses without technical staff. Although Datadog offers security measures, it scores worse than New Relic with most security analysts. Businesses looking for high-security monitoring may prefer New Relic.
New Relic offers simple installation and community learning resources, but its users may struggle with its interface. Additionally, while New Relic does offer many APIs, it does not support community development in the same way Datadog does. Some users may find that New Relic is missing an API they require, and will have to either develop the extension on their own or explore other options.
Pricing
Datadog offers several per-month pricing models designed to adapt to different data requirements and infrastructure scales. Their price models include per-host pricing, pricing per million events, and pricing per GB of analyzed log files. For more details on available plans and pricing, refer to the Datadog pricing page.
Similarly, New Relic offers multiple service packages with varying pricing structures. Their core offering, the Full-Stack Observability package, includes infrastructure monitoring, APM, and other services. This package is free for the first user at the Standard tier and $99 per additional user per month. For information on pricing for the Pro and Enterprise tier, as well as pricing information for their telemetry data and machine-learning services, refer to the New Relic pricing page.
Datadog works really well with complex microservices architecture like any E-commerce platform which will be having multiple services but they all are interdependent to others so in this scenario Datadog will be best to monitor these as it will show the transactions also between those microservices. If you are using multiple services in your architecture whether it will be cloud services or on prem services Datadog will be the best choice to monitor all those service with in Datadog so that you can see everything in a single place. But if you are having small architecture and few services in that then in that scenario you can use Datadog but it will be little costly as compared to other but obviously the features are very well.
A de minimis incentive was given to thank the reviewer for their time. The incentive was not used to bias or drive a particular response, nor was the incentive contingent on a positive endorsement. TR verified that a representative sample of customers was invited. More Info
I have used New Relic in different scenarios like monitoring my production infrastructure and applications which helps us to reduce the downtime of my applications and websites and also I have used the synthetic monitoring feature which helps to proactively monitor our websites availability. Along with this I have also used New Relic for cloud resources cost monitoring which helps to reduce my cloud cost. Also I have used mobile application monitoring which helps me to trace the sessions easily and I can easily reduce my RCA through the help of that.
A de minimis incentive was given to thank the reviewer for their time. The incentive was not used to bias or drive a particular response, nor was the incentive contingent on a positive endorsement. More Info
A de minimis incentive was given to thank the reviewer for their time. The incentive was not used to bias or drive a particular response, nor was the incentive contingent on a positive endorsement. More Info
New Relic APM allows us to follow up transactions across services and trace performance bottlenecks in real-time, crucial when monitoring the processing of energy loads or predictive maintenance algorithms.
It gives us deep visibility into our cloud servers, containers and IOT gateways, so we can catch CPU spikes or memory leaks which can impact the data we ingest from the field devices.
We develop custom dashboards for monitoring trends of power consumption, abnormality in sensors and API health. In conjunction with alerting, it makes sure we are fixing issues before customers even see them.
A de minimis incentive was given to thank the reviewer for their time. The incentive was not used to bias or drive a particular response, nor was the incentive contingent on a positive endorsement. More Info
Alert windows cause lag in notifications (e.g. if the alert window is X errors in 1 hour, we won't get alerted until the end of the 1 hour range)
I would appreciate more supportive examples for how to filter and view metrics in the explorer
I would like a more clear interface for metrics that are missing in a time frame, rather than only showing tags/etc. for metrics that were collected within the currently viewed time frame
A de minimis incentive was given to thank the reviewer for their time. The incentive was not used to bias or drive a particular response, nor was the incentive contingent on a positive endorsement. More Info
A de minimis incentive was given to thank the reviewer for their time. The incentive was not used to bias or drive a particular response, nor was the incentive contingent on a positive endorsement. More Info
The only issue that we have had with New Relic is that the price might be a little expensive for smaller companies. The amount of data you store in New Relic impacts the cost, and can get away from you if you don't work closely with the vendor. Overall though the application is top notch.
A de minimis incentive was given to thank the reviewer for their time. The incentive was not used to bias or drive a particular response, nor was the incentive contingent on a positive endorsement. TR verified that a representative sample of customers was invited. More Info
There is some room for improvement, but the Datadog team sends out updates frequently, and the UI is user-friendly for engineers, with no significant loading issues or region-specific problems. That was one of the key reasons we preferred Datadog; our company has employees worldwide, and it wasn't difficult to transition to the tool.
A de minimis incentive was given to thank the reviewer for their time. The incentive was not used to bias or drive a particular response, nor was the incentive contingent on a positive endorsement. More Info
New Relic helps in observability setup for the critical environments and getting known about the issues and troubleshoot the applications and services. Alerts helps in knowing the abnormal state of the system and services, Dashboards are used for visualizing the key metrics and muting the unwanted notifications and dropping the extra data from the source.
A de minimis incentive was given to thank the reviewer for their time. The incentive was not used to bias or drive a particular response, nor was the incentive contingent on a positive endorsement. More Info
A de minimis incentive was given to thank the reviewer for their time. The incentive was not used to bias or drive a particular response, nor was the incentive contingent on a positive endorsement. More Info
A de minimis incentive was given to thank the reviewer for their time. The incentive was not used to bias or drive a particular response, nor was the incentive contingent on a positive endorsement. More Info
The support team usually gets it right. We did have a rather complicate issue setting up monitoring on a domain controller. However, they are usually responsive and helpful over chat. The downside would be I don’t think they have any phone support. If that is important to you this might not be a good fit.
A de minimis incentive was given to thank the reviewer for their time. The incentive was not used to bias or drive a particular response, nor was the incentive contingent on a positive endorsement. More Info
The support team has been really helpful and resolved most of the issues on time. However, for a couple of issues, several follow-ups were needed to elicit a reasonable response. The issue was deeply technical and could have been investigated only by their Architects, and bringing them into the ticket took longer than needed
A de minimis incentive was given to thank the reviewer for their time. The incentive was not used to bias or drive a particular response, nor was the incentive contingent on a positive endorsement. TR verified that a representative sample of customers was invited. More Info
It's better to start by implementing New Relic in one project and test everything. Try to follow best recommended practices and read all the official documentation. Everything seems well tested. Then, start by installing agents to the rest of your projects and keep a close look to all logs and metrics New Relic gives you.
We are still trying other products, but people still like Datadog. After setting up a dashboard, it's great for monitoring instances on Datadog. Also, the DevOps team had a good time setting up Datadog. It means Datadog was way easier to set up compared to those others.
A de minimis incentive was given to thank the reviewer for their time. The incentive was not used to bias or drive a particular response, nor was the incentive contingent on a positive endorsement. More Info
New Relic has full stack visibility and gives us all options for observability like one stop shop. It gives you front end, backend as well synthetic monitoring capabilities. Every other feature built into one cost model (usually) which ties to data that you send, it helps you leverage all features without having to pay additional charge for feature
A de minimis incentive was given to thank the reviewer for their time. The incentive was not used to bias or drive a particular response, nor was the incentive contingent on a positive endorsement. TR verified that a representative sample of customers was invited. More Info
A de minimis incentive was given to thank the reviewer for their time. The incentive was not used to bias or drive a particular response, nor was the incentive contingent on a positive endorsement. More Info
A de minimis incentive was given to thank the reviewer for their time. The incentive was not used to bias or drive a particular response, nor was the incentive contingent on a positive endorsement. More Info
A de minimis incentive was given to thank the reviewer for their time. The incentive was not used to bias or drive a particular response, nor was the incentive contingent on a positive endorsement. More Info