Datadog is a monitoring service for IT, Dev and Ops teams who write and run applications at scale, and want to turn the massive amounts of data produced by their apps, tools and services into actionable insight.
$1.27
per month (billed annually) per host
NetApp Cloud Insights
Score 9.2 out of 10
N/A
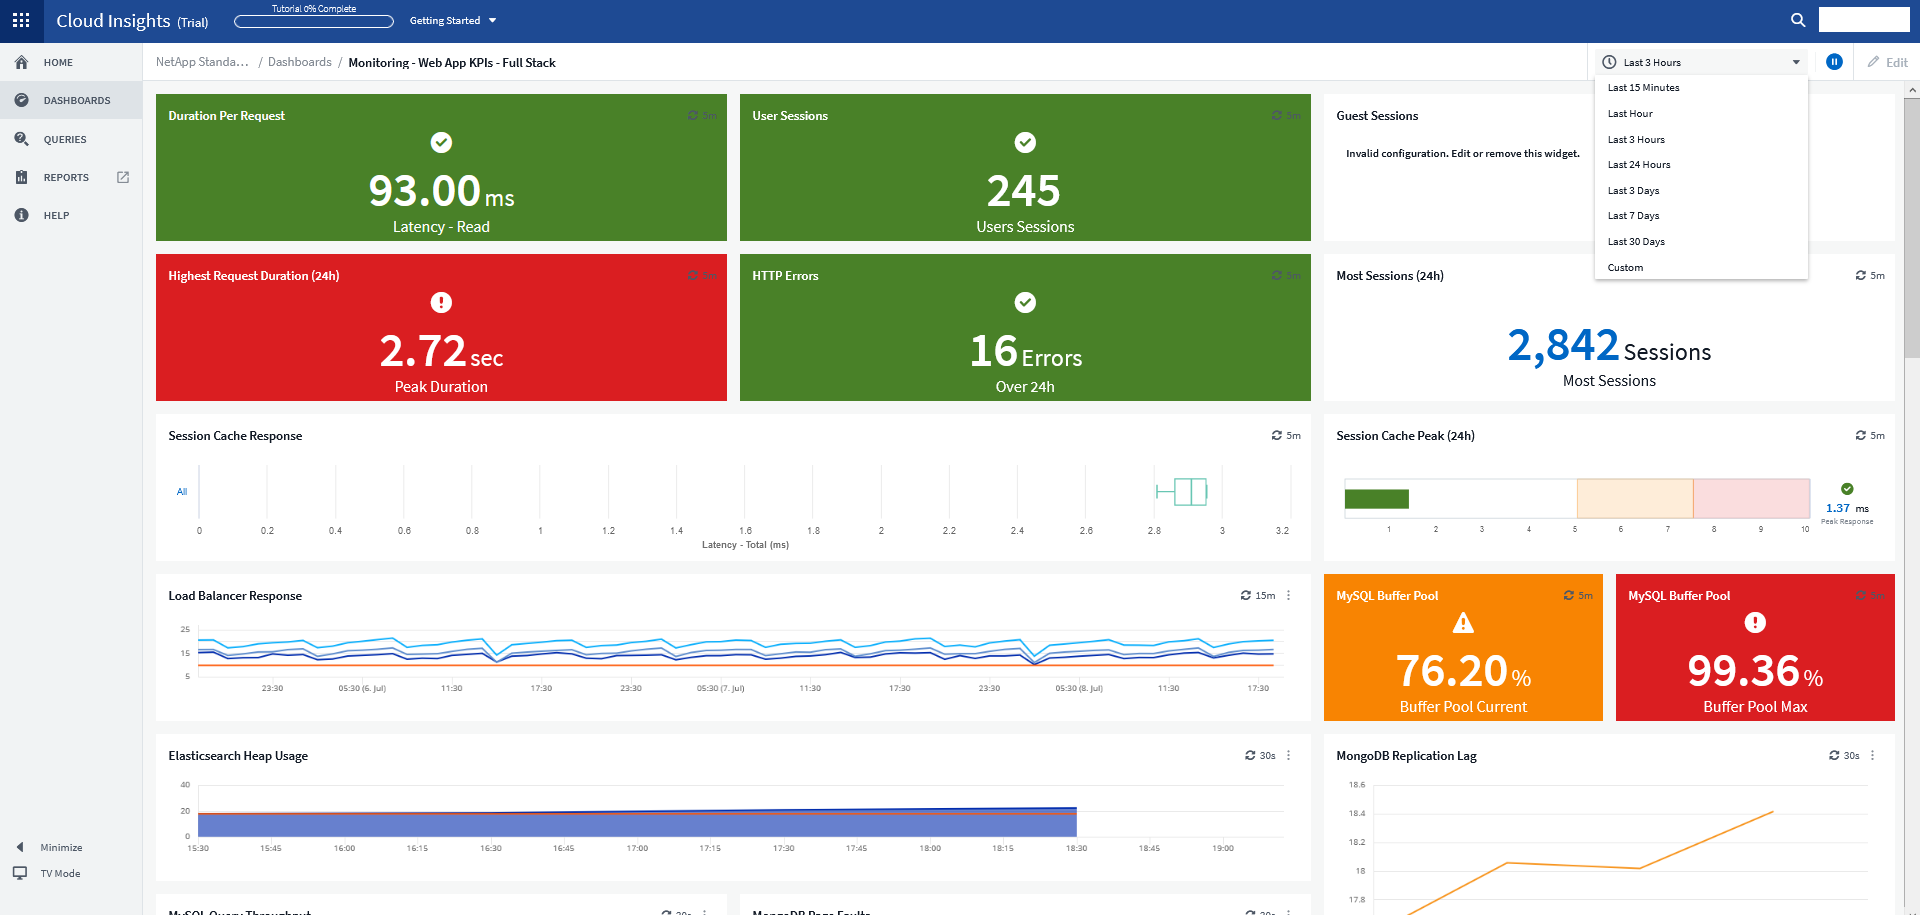
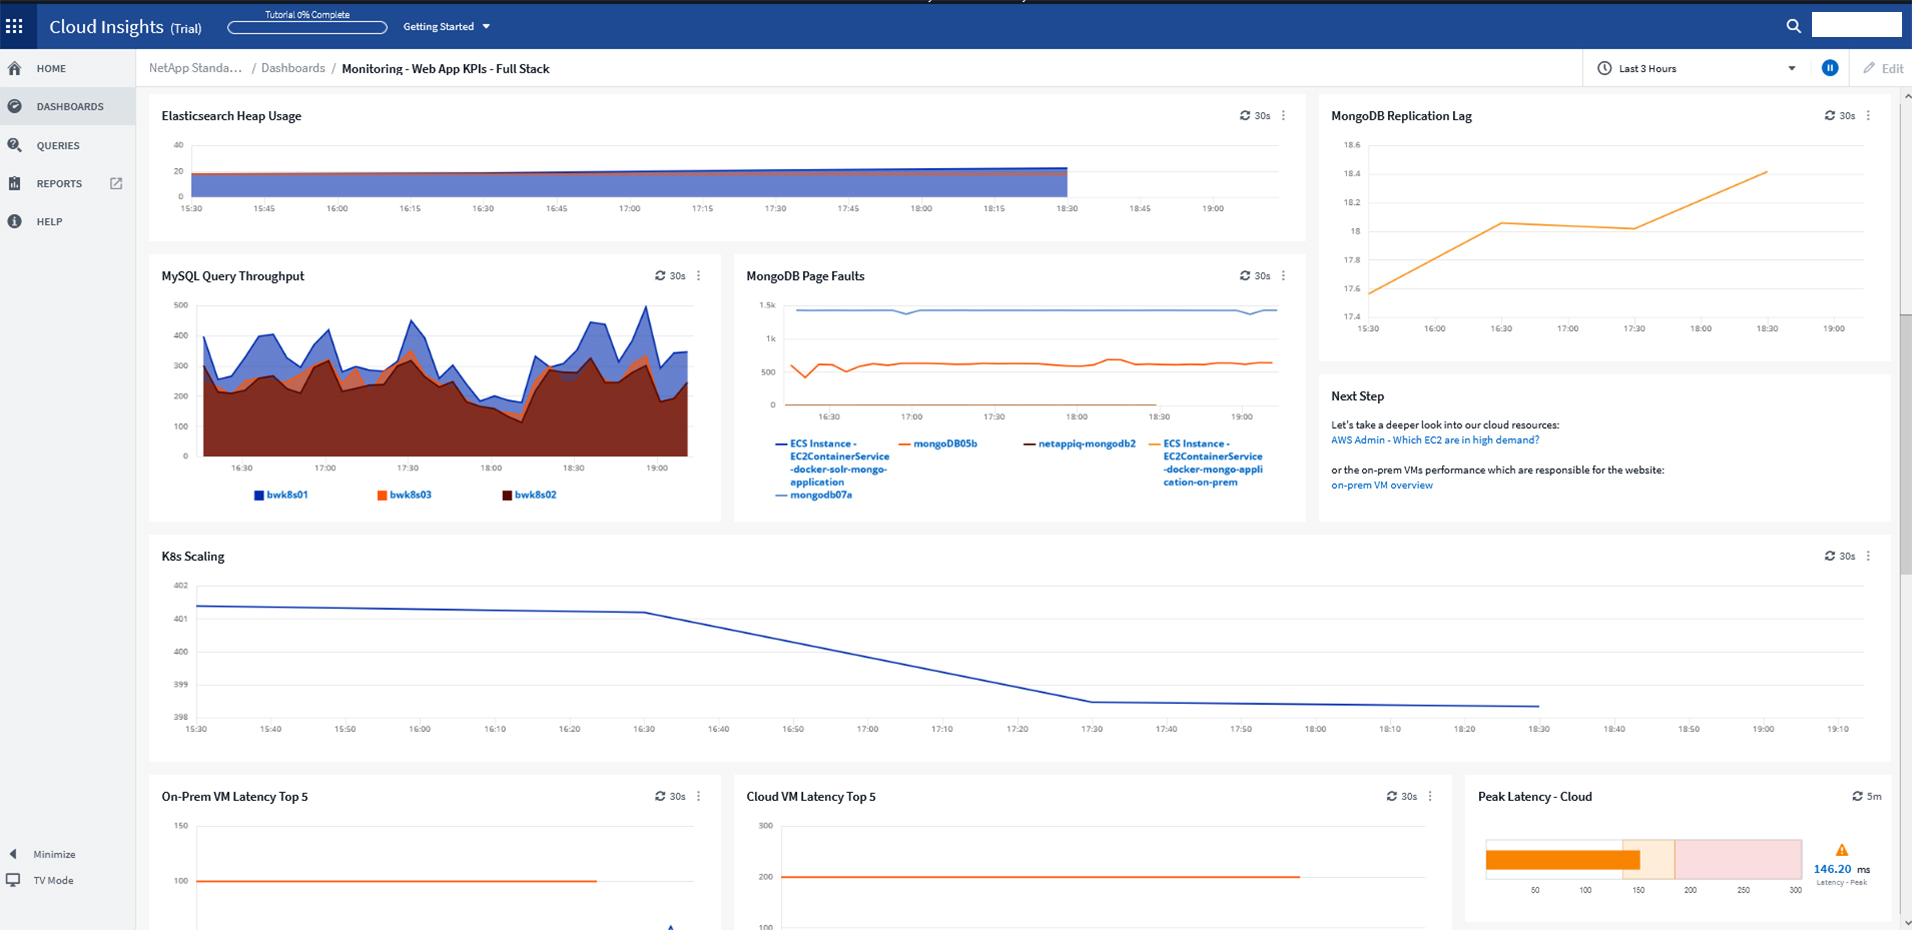
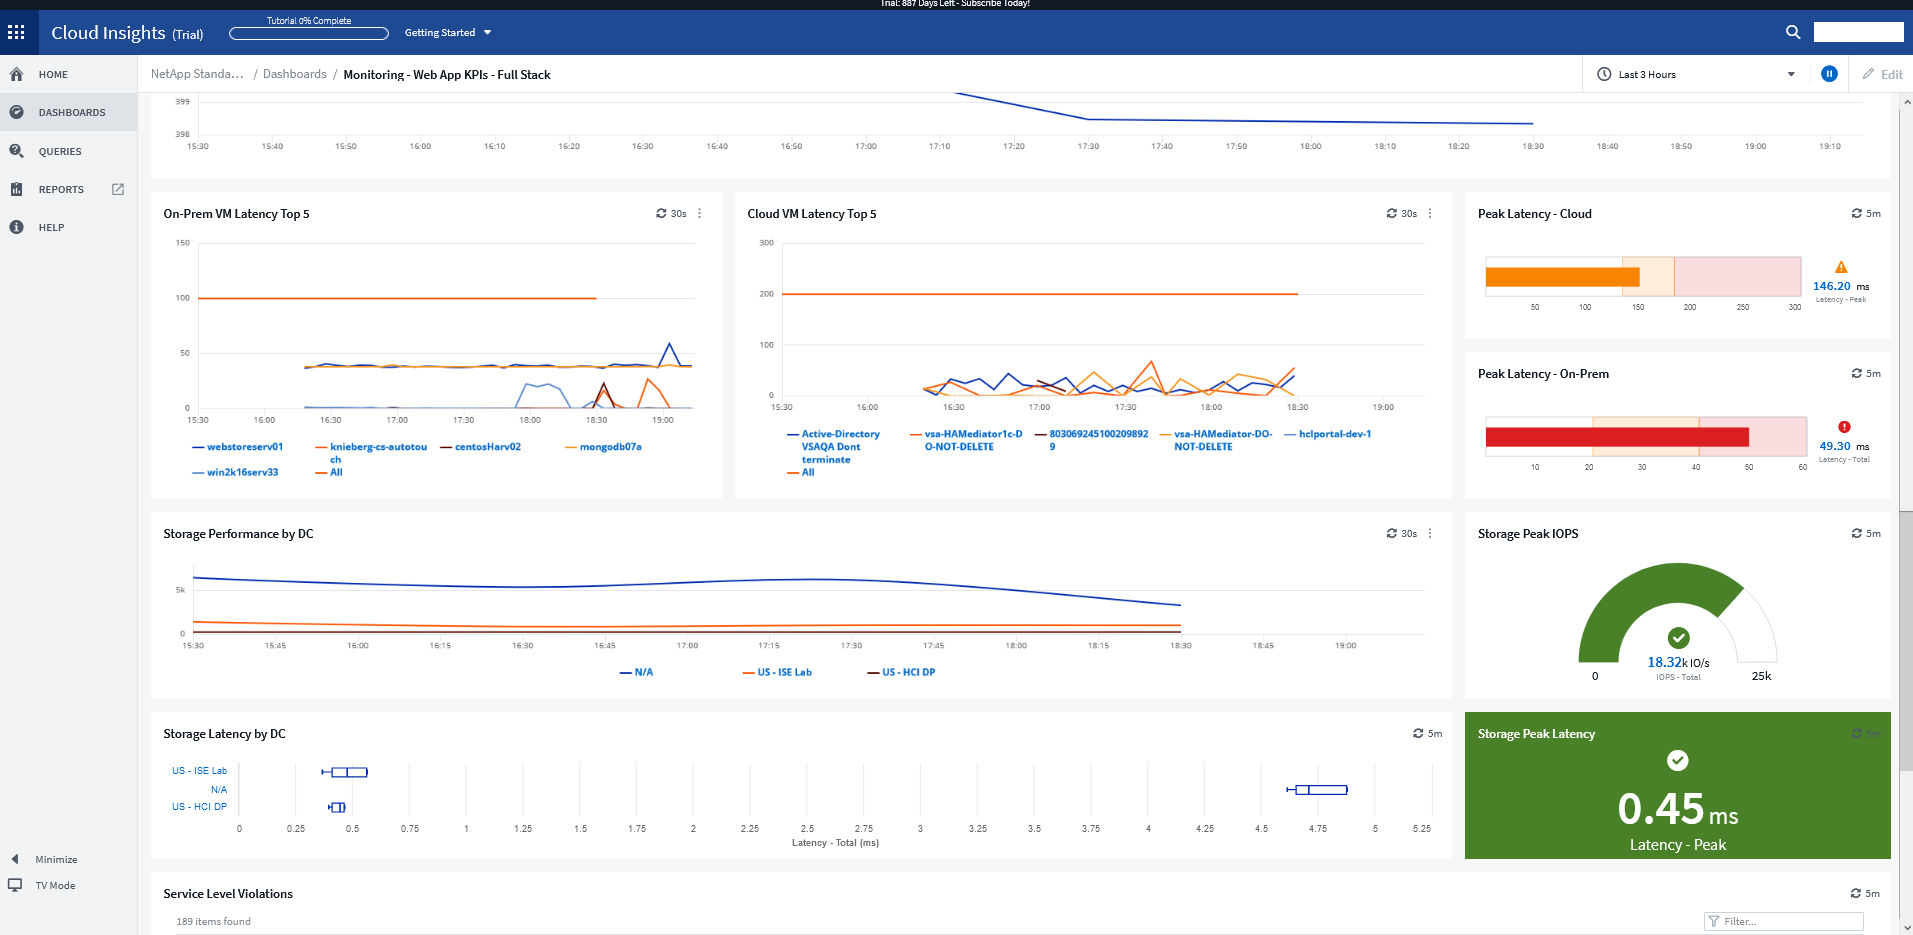
NetApp Cloud Insights is an infrastructure monitoring tool that gives
users visibility into their complete infrastructure. With Cloud Insights, users can monitor, troubleshoot and optimize all resources including
public clouds and private data centers.
N/A
Pricing
Datadog
NetApp Cloud Insights
Editions & Modules
Log Management
$1.27
per month (billed annually) per host
Infrastructure
$15.00
per month (billed annually) per host
Standard
$18
per month per host
Enterprise
$27
per month per host
DevSecOps Pro
$27
per month per host
APM
$31.00
per month (billed annually) per host
DevSecOps Enterprise
$41
per month per host
No answers on this topic
Offerings
Pricing Offerings
Datadog
NetApp Cloud Insights
Free Trial
Yes
Yes
Free/Freemium Version
Yes
Yes
Premium Consulting/Integration Services
No
No
Entry-level Setup Fee
Optional
Optional
Additional Details
Discount available for annual pricing. Multi-Year/Volume discounts available (500+ hosts/mo).
A one-stop solution for everything you need. Multiple functionalities are tailored to meet specific business needs. Logs are essential for any business, and Datadog manages logs effectively. Rum sessions are something new to me and have given us a new perspective on how to reverse engineer issues that we see for our customers.
For example, we had an application slowdown. It looked like the slowdown was storage. However, it was a malformed SQL query that no one realized was pulling data from the storage location that also housed the application. Cloud Insights saved us hours of downtime and frustration. Cloud Insights pinpointed which system was hogging resources. What makes Cloud Insights special is the way it looks at the data collected from the data sources. The insights it provides into the flow of data; sheds new light on how things work in your environment.
Alert windows cause lag in notifications (e.g. if the alert window is X errors in 1 hour, we won't get alerted until the end of the 1 hour range)
I would appreciate more supportive examples for how to filter and view metrics in the explorer
I would like a more clear interface for metrics that are missing in a time frame, rather than only showing tags/etc. for metrics that were collected within the currently viewed time frame
Datadog's user interface is quite friendly and easy to navigate. With menus clearly categorized, and ability to bookmark important dashboards, one can easily find what they're looking for. For dashboards, ability to move and resize visualizations and group them, is really helpful to organize dashboards. Automatic suggestions from Datadog for important visualizations based on the metrics and logs would provide another level of ease of use.
I have been extremely happy with its usability. You can take thins as they are out of the box and it is useful. You can carry it as far as you want to go and every step you take improves your ROI.
The support team usually gets it right. We did have a rather complicate issue setting up monitoring on a domain controller. However, they are usually responsive and helpful over chat. The downside would be I don’t think they have any phone support. If that is important to you this might not be a good fit.
Before using Cloud Insights, we quickly resolved all the issues we had by talking with the support team. The support team is eager to assist and technically well equipped. They quickly understood what we needed and helped us during the setup and the first use period so that we could adapt easily.
I selected Datadog because of its features and the wide range of integration support. As I already told it supports more that 600+ integrations which helps and organization to keep everything in a single place and also its AI feature which is reducing the time for root cause analysis. Its custom dashboards features which helps us to visualize the data in a more attractive way.
Cloud Insights allows us to create custom dashboards to monitor and trend any aspect of their infrastructure including CPU, memory, storage network utilization, IOPS, capacity utilization and more. Cloud Insights also provides visibility into the inter-connectivity of the components in our infrastructure by providing topology views of any component.