
D3.js vs. ActiveReports
D3.js vs. ActiveReports
| Product | Rating | Most Used By | Product Summary | Starting Price |
|---|---|---|---|---|
 D3.js | N/A | D3.js is a JavaScript library for manipulating documents based on data. | N/A | |
 ActiveReports | N/A | ActiveReports line of products is a complete developer reporting solution for both .NET and JavaScript. Users can deliver interactive reports with its designers and rich controls. | $849 first year ($699/Annual Maintenance) per developer |
| D3.js | ActiveReports | |||||||||||||||
|---|---|---|---|---|---|---|---|---|---|---|---|---|---|---|---|---|
| Editions & Modules | No answers on this topic |
| ||||||||||||||
| Offerings |
| |||||||||||||||
| Entry-level Setup Fee | No setup fee | No setup fee | ||||||||||||||
| Additional Details | — | — | ||||||||||||||
| More Pricing Information | ||||||||||||||||
| D3.js | ActiveReports |
|---|
| D3.js | ActiveReports | |
|---|---|---|
| Small Businesses |  Syncfusion® Essential Studio® Score 6.1 out of 10 | Syncfusion® Essential Studio® Score 6.1 out of 10 |
| Medium-sized Companies |  React Score 9.3 out of 10 | React Score 9.3 out of 10 |
| Enterprises | React Score 9.3 out of 10 | React Score 9.3 out of 10 |
| All Alternatives | View all alternatives | View all alternatives |
| D3.js | ActiveReports | |
|---|---|---|
| Likelihood to Recommend | 8.9 (0 ratings) | - (0 ratings) |
| Support Rating | 8.0 (0 ratings) | - (0 ratings) |
| D3.js | ActiveReports | |
|---|---|---|
| Likelihood to Recommend | 
 Firaz Peer Fellow |  No answers on this topic |
| Pros |
| No answers on this topic |
| Cons |
Firaz Peer Fellow | No answers on this topic |
| Support Rating |
| No answers on this topic |
| Alternatives Considered |
| No answers on this topic |
| Return on Investment |
 Sanyam Jain Freelancer in RPA | No answers on this topic |
| ScreenShots | ActiveReports Screenshots 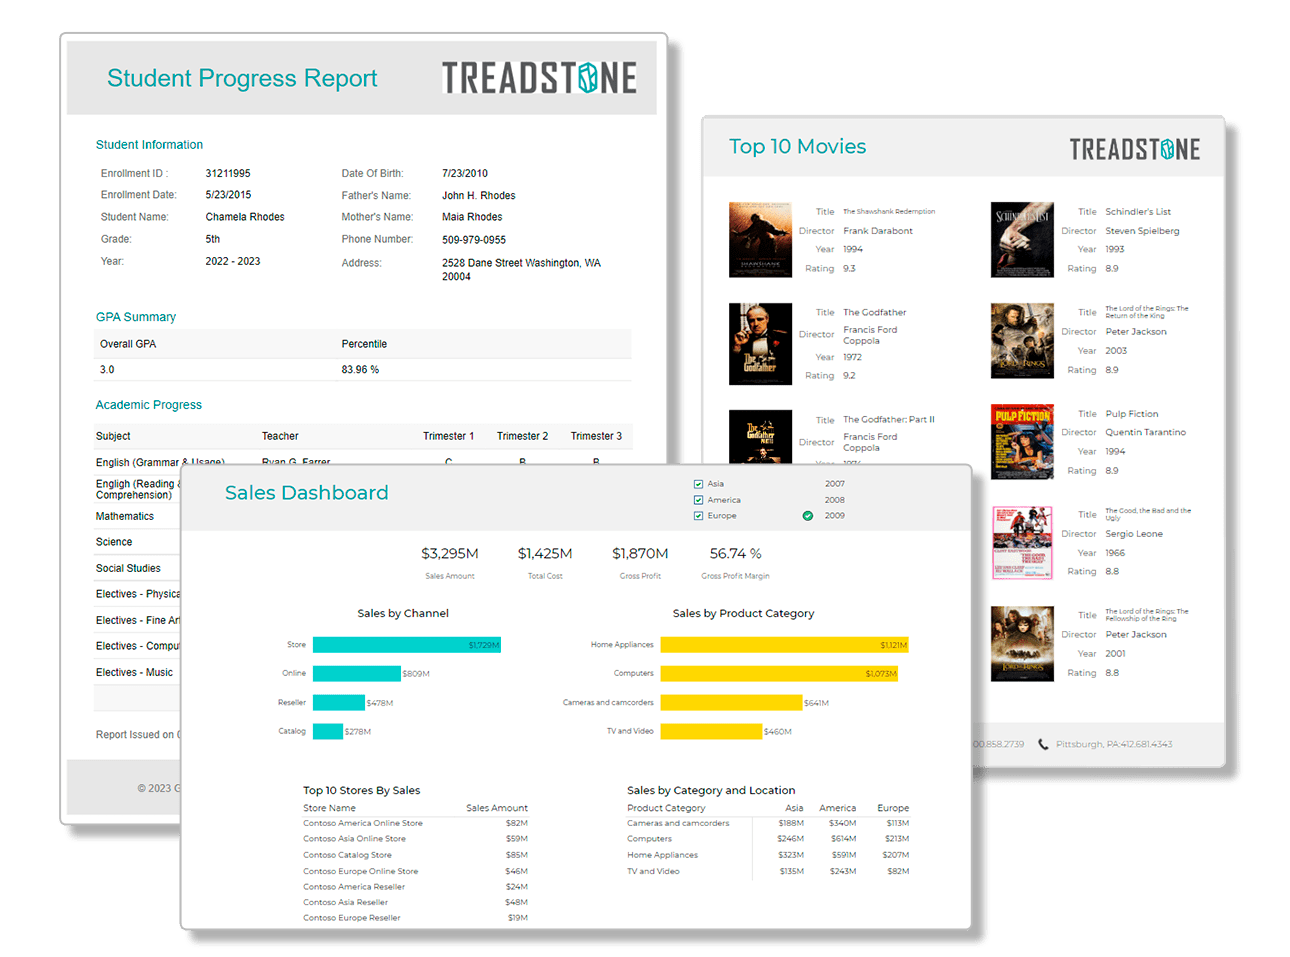 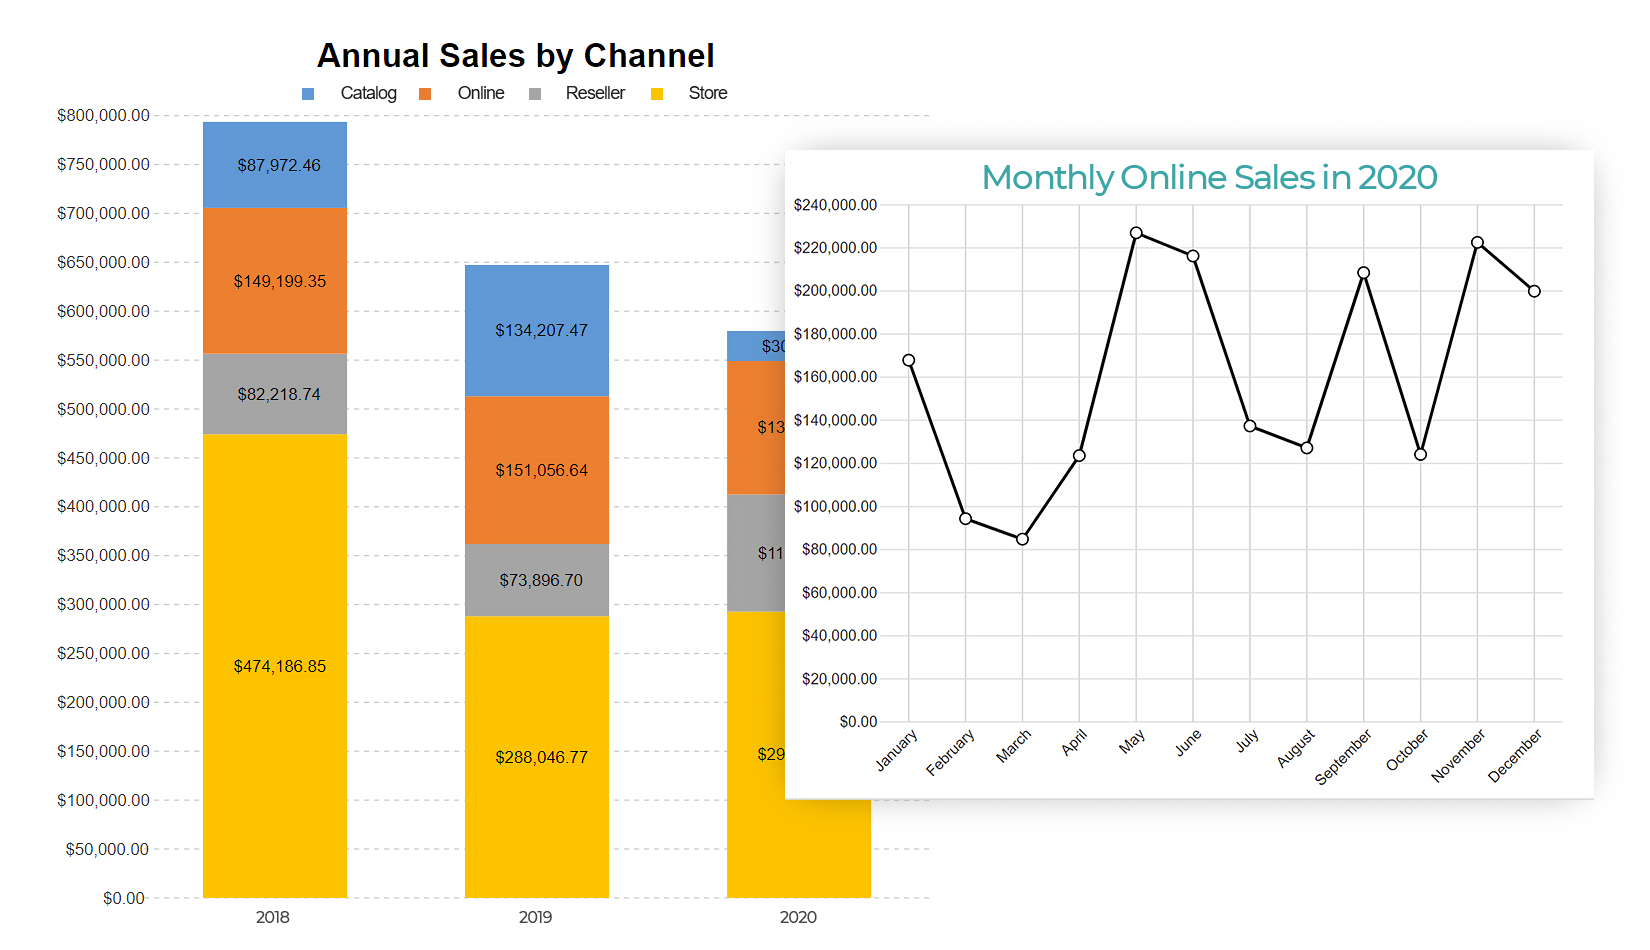  |