Clear Analytics vs. Looker

Overview
ProductRatingMost Used ByProduct SummaryStarting Price
Clear Analytics
Score 8.8 out of 10
Enterprise companies (1,001+ employees)
Clear Analytics is a business intelligence solution that enables non technical end users to perform analytics by leveraging existing knowledge of Excel coupled with a built in query builder. Some key features include: Dynamic Data Refresh, Data Share and In-Excel Collaboration.
$29
Per Seat per Month
Looker
Score 8.5 out of 10
N/A
Looker is a BI application with an analytics-oriented application server that sits on top of relational data stores. It includes an end-user interface for exploring data, a reusable development paradigm for data discovery, and an API for supporting data in other systems.N/A
Pricing
Clear AnalyticsLooker
Editions & Modules
Personal
$29
Per Seat per Month
Team
$165
upto 10 Seat per Month
Department
$265
upto 25 Seat per month
Organization
$565
Upto 100 per seat per month
No answers on this topic
Offerings
Pricing Offerings
Clear AnalyticsLooker
Free Trial
YesYes
Free/Freemium Version
NoNo
Premium Consulting/Integration Services
NoNo
Entry-level Setup Fee$800 Initial OnBoardingRequired
Additional DetailsCertain Enterprise level features can be made available to Small Business edition at additional cost. Such services include Scheduler and OLAP connectivity. Custom adapters can also be created to connect to SaaS services.Must contact sales team for pricing.
More Pricing Information
Community Pulse
Clear AnalyticsLooker
Features
Clear AnalyticsLooker
BI Standard Reporting
Comparison of BI Standard Reporting features of Product A and Product B
Clear Analytics
9.0
Ratings
10% above category average
Looker
8.3
Ratings
2% above category average
Pixel Perfect reports9.00 Ratings7.90 Ratings
Customizable dashboards9.10 Ratings8.90 Ratings
Report Formatting Templates8.70 Ratings8.30 Ratings
Ad-hoc Reporting
Comparison of Ad-hoc Reporting features of Product A and Product B
Clear Analytics
8.9
Ratings
10% above category average
Looker
8.4
Ratings
4% above category average
Drill-down analysis9.20 Ratings8.10 Ratings
Formatting capabilities8.70 Ratings7.80 Ratings
Report sharing and collaboration8.90 Ratings9.10 Ratings
Integration with R or other statistical packages00 Ratings8.70 Ratings
Report Output and Scheduling
Comparison of Report Output and Scheduling features of Product A and Product B
Clear Analytics
9.0
Ratings
8% above category average
Looker
8.7
Ratings
5% above category average
Publish to Web9.00 Ratings8.30 Ratings
Publish to PDF9.10 Ratings9.00 Ratings
Report Versioning8.90 Ratings8.50 Ratings
Report Delivery Scheduling8.80 Ratings9.10 Ratings
Data Discovery and Visualization
Comparison of Data Discovery and Visualization features of Product A and Product B
Clear Analytics
9.0
Ratings
12% above category average
Looker
6.9
Ratings
14% below category average
Pre-built visualization formats (heatmaps, scatter plots etc.)8.90 Ratings8.00 Ratings
Location Analytics / Geographic Visualization9.10 Ratings8.00 Ratings
Predictive Analytics00 Ratings4.60 Ratings
Access Control and Security
Comparison of Access Control and Security features of Product A and Product B
Clear Analytics
9.3
Ratings
9% above category average
Looker
8.2
Ratings
3% below category average
Multi-User Support (named login)9.40 Ratings8.70 Ratings
Role-Based Security Model9.00 Ratings8.10 Ratings
Multiple Access Permission Levels (Create, Read, Delete)9.40 Ratings8.00 Ratings
Report-Level Access Control00 Ratings8.10 Ratings
Mobile Capabilities
Comparison of Mobile Capabilities features of Product A and Product B
Clear Analytics
8.6
Ratings
9% above category average
Looker
6.1
Ratings
25% below category average
Mobile Application8.50 Ratings5.00 Ratings
Dashboard / Report / Visualization Interactivity on Mobile8.70 Ratings7.20 Ratings
Responsive Design for Web Access00 Ratings7.40 Ratings
Best Alternatives
Clear AnalyticsLooker
Small Businesses
BrightGauge
BrightGauge
Score 9.0 out of 10
BrightGauge
BrightGauge
Score 9.0 out of 10
Medium-sized Companies
Reveal
Reveal
Score 10.0 out of 10
Reveal
Reveal
Score 10.0 out of 10
Enterprises
Kyvos Semantic Intelligence Layer
Score 9.9 out of 10
Kyvos Semantic Intelligence Layer
Score 9.9 out of 10
All AlternativesView all alternativesView all alternatives
User Ratings
Clear AnalyticsLooker
Likelihood to Recommend
9.0
(0 ratings)
8.7
(0 ratings)
Likelihood to Renew
-
(0 ratings)
9.5
(0 ratings)
Usability
9.1
(0 ratings)
8.8
(0 ratings)
Availability
-
(0 ratings)
10.0
(0 ratings)
Performance
-
(0 ratings)
6.0
(0 ratings)
Support Rating
9.5
(0 ratings)
8.8
(0 ratings)
Implementation Rating
-
(0 ratings)
10.0
(0 ratings)
Configurability
-
(0 ratings)
10.0
(0 ratings)
Ease of integration
-
(0 ratings)
10.0
(0 ratings)
Product Scalability
-
(0 ratings)
10.0
(0 ratings)
Vendor post-sale
-
(0 ratings)
10.0
(0 ratings)
Vendor pre-sale
-
(0 ratings)
10.0
(0 ratings)
User Testimonials
Clear AnalyticsLooker
Likelihood to Recommend
Clear Analytics has almost all the features which are mostly required by the organizations for their data analytics and transformation activities. Clear Analytics is built on the support of a parallel query engine which makes it handle large volume requests and also provides optimized results. However, every solution has some limitations, Clear Analytics lacks advanced features such as Predictive Analytics which is a very demanding feature in the market as most organizations are adopting AI/ML automation for their businesses. Also, it needs to add a lot of advanced visualizations so that the user has the choice of selection. Overall a good solution to be recommended.
Read full review
When you need to create a centralised dashboard for multiple stakeholders that blends cross-channel reporting. As an SEO agency reporting for clients - Looker is a great solution. It's less appropriate depending on the intended users. For instance, in my experience Looker reports have been under-utilised because they're not accessed regularly, provide too much noise or often simple PDF reports are preferred
Read full review
Pros
  • Integrates directly with Power BI and Excel
  • Helps wrangle, filter and visualize data
  • Presentation of large data in a summarized manner
Read full review
  • It is very easy to start a new dashboard and configure what you want to display by just selecting/dragging from the list of available columns.
  • It is intuitive, mainly if you use other Google services like Google Sheets.
  • The look and feel is modern and nice.
  • It it very useful to have an immediate visual overview of the data in a spreadsheet.
Read full review
Cons
  • For Charts and Graphs , getting the Power Point Deck would be helpful. As of now we use the data from Excel Reports
Read full review
  • I wish I could get more granular in the Google ad data, such as down to the campaign type, instead of having to see only all campaigns.
  • The setup can be time-consuming if you're not using the product regularly.
  • Editing the dashboard requires a few logins; I wish it was more seamless.
Read full review
Likelihood to Renew
No answers on this topic
We are very haooy with Looker, it provides us with all the funciomalities we need for both the day to day oerformance tracking and longer periods reporting. It is easy to use for account managers, configurable and customizable for soecialists and what is most imoortant, our clinets generally really love it
Read full review
Usability
I have really enjoyed working with Clear Analytics. This platform has contributed to increased production and reliable data control processes. It has flexible user interface that can be operated by any organization member. Reports are shared on simple and transparent way in the dashboard for easy access. Data analytics from all departments have created manageable working environment that have increased production.
Read full review
Looker is relatively easy to use, even as it is set up. The customers for the front-end only have issues with the initial setup for looker ml creations. Other "looks" are relatively easy to set up, depending on the ETL and the data which is coming into Looker on a regular basis.
Read full review
Reliability and Availability
No answers on this topic
No objections
Read full review
Performance
No answers on this topic
Somehow resources heavy, both on server and client. I recommned at least 50Mbs data rate and high performance desktop comouter to be abke to run comolex tasks and configure larger amount of data. On the other hand, the client does not need to worry when viewing, the performance is usually ok
Read full review
Support Rating
Clear Analytics has very good team members in Consulting as well as in Customer Support. The support agents are capable of providing the required resolution of your queries in a timeline provides. They have a clear understanding of the product and its features, and they are friendly in nature. However, for some advanced or level 2/3-based queries, they required some more time to respond, which is ok.
Read full review
Never had to work with support for issues. Any questions we had, they would respond promptly and clearly. The one-time setup was easy, by reading documentation. If the feature is not supported, they will add a feature request. In this case, LDAP support was requested over OKTA. They are looking into it.
Read full review
Implementation Rating
No answers on this topic
Very satisfied, easy to implement
Read full review
Alternatives Considered
We didn’t choose this software because we found it didn’t adjust to what we really needed to do as a small business.
Read full review
In my opinion, Looker is no Power BI. It is good, but I think Power BI is amazing. That said, in my experience, Power BI is nowhere near as easy to setup and report on Google services as Looker is. We plan to continue using Power BI for c-suite and corporate reporting, especially for internal databases, but will gladly use Looker for our marketing information for AdWords, Analytics, Search Console, and YouTube.
Read full review
Return on Investment
  • Super useful to get started immediately
  • Didn't have to rely on migrating data
  • Easy to add members
  • Easy to learn and build charts
Read full review
  • Other than some people not liking the numbers, I don't see any negative impacts; we haven't experienced that.
  • The reports help us unravel the story of our users and how they are sifting through our pages.
  • Our clients enjoy seeing the numbers to understand better what stands out on their sites.
  • The reports have helped us see what campaigns are working and where we need to tweak things.
  • The reports have enabled us to have better conversations with stakeholders about how their web pages should be modified, edited, etc., to reflect the data.
Read full review
ScreenShots

Clear Analytics Screenshots

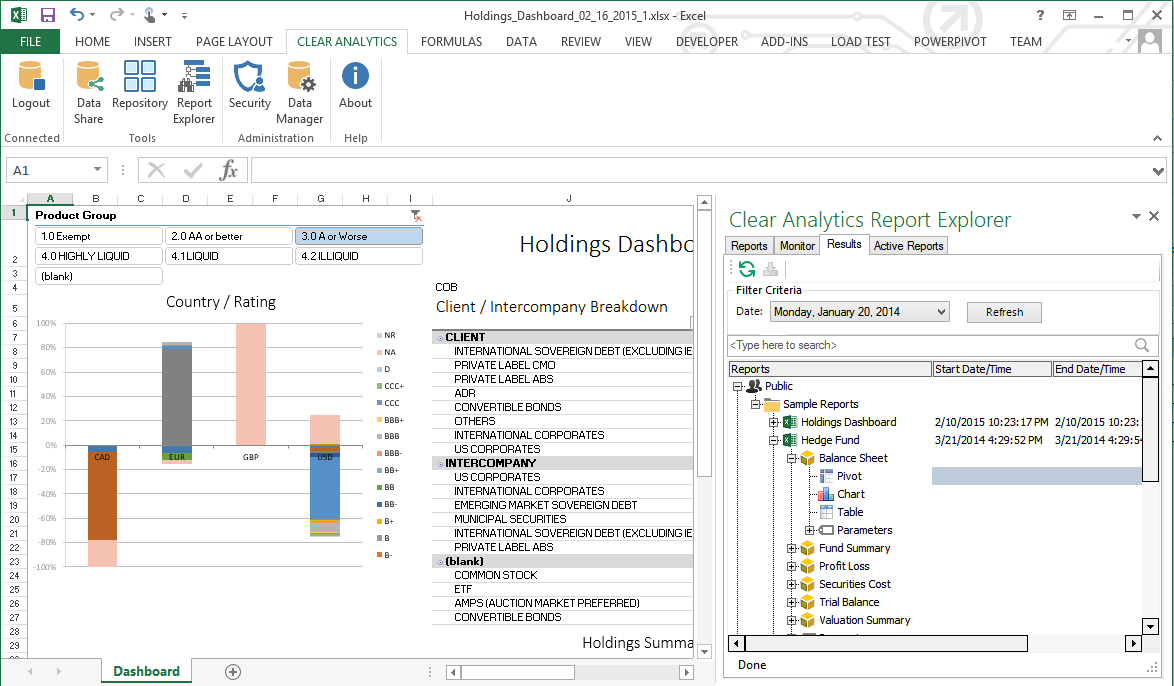
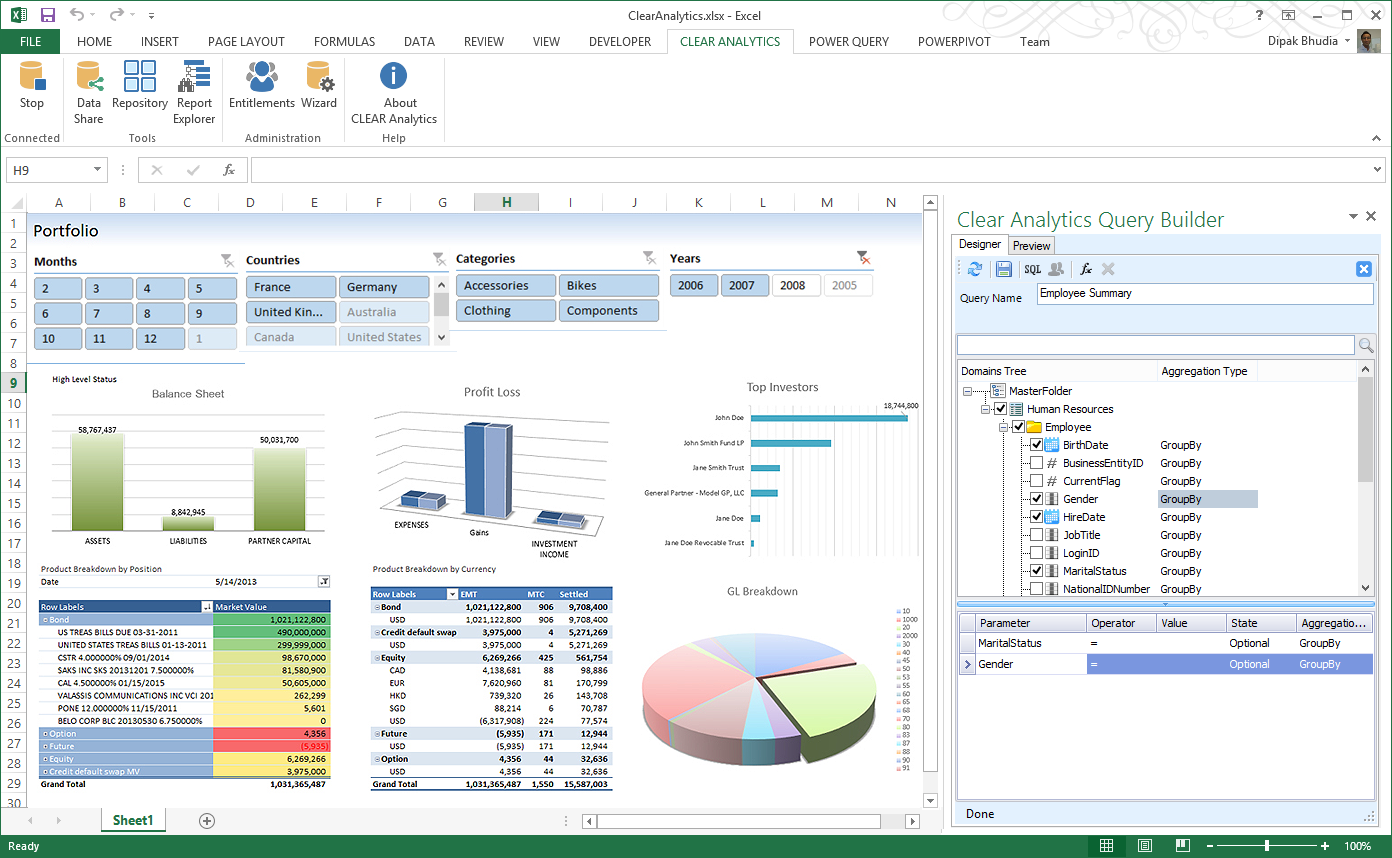
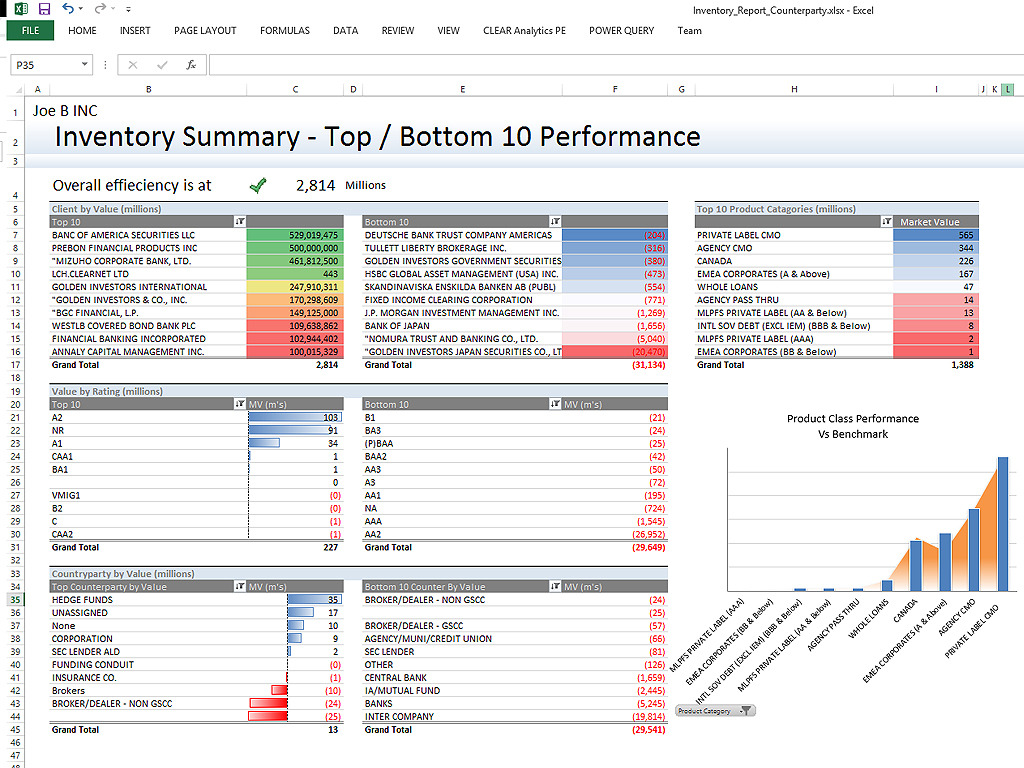
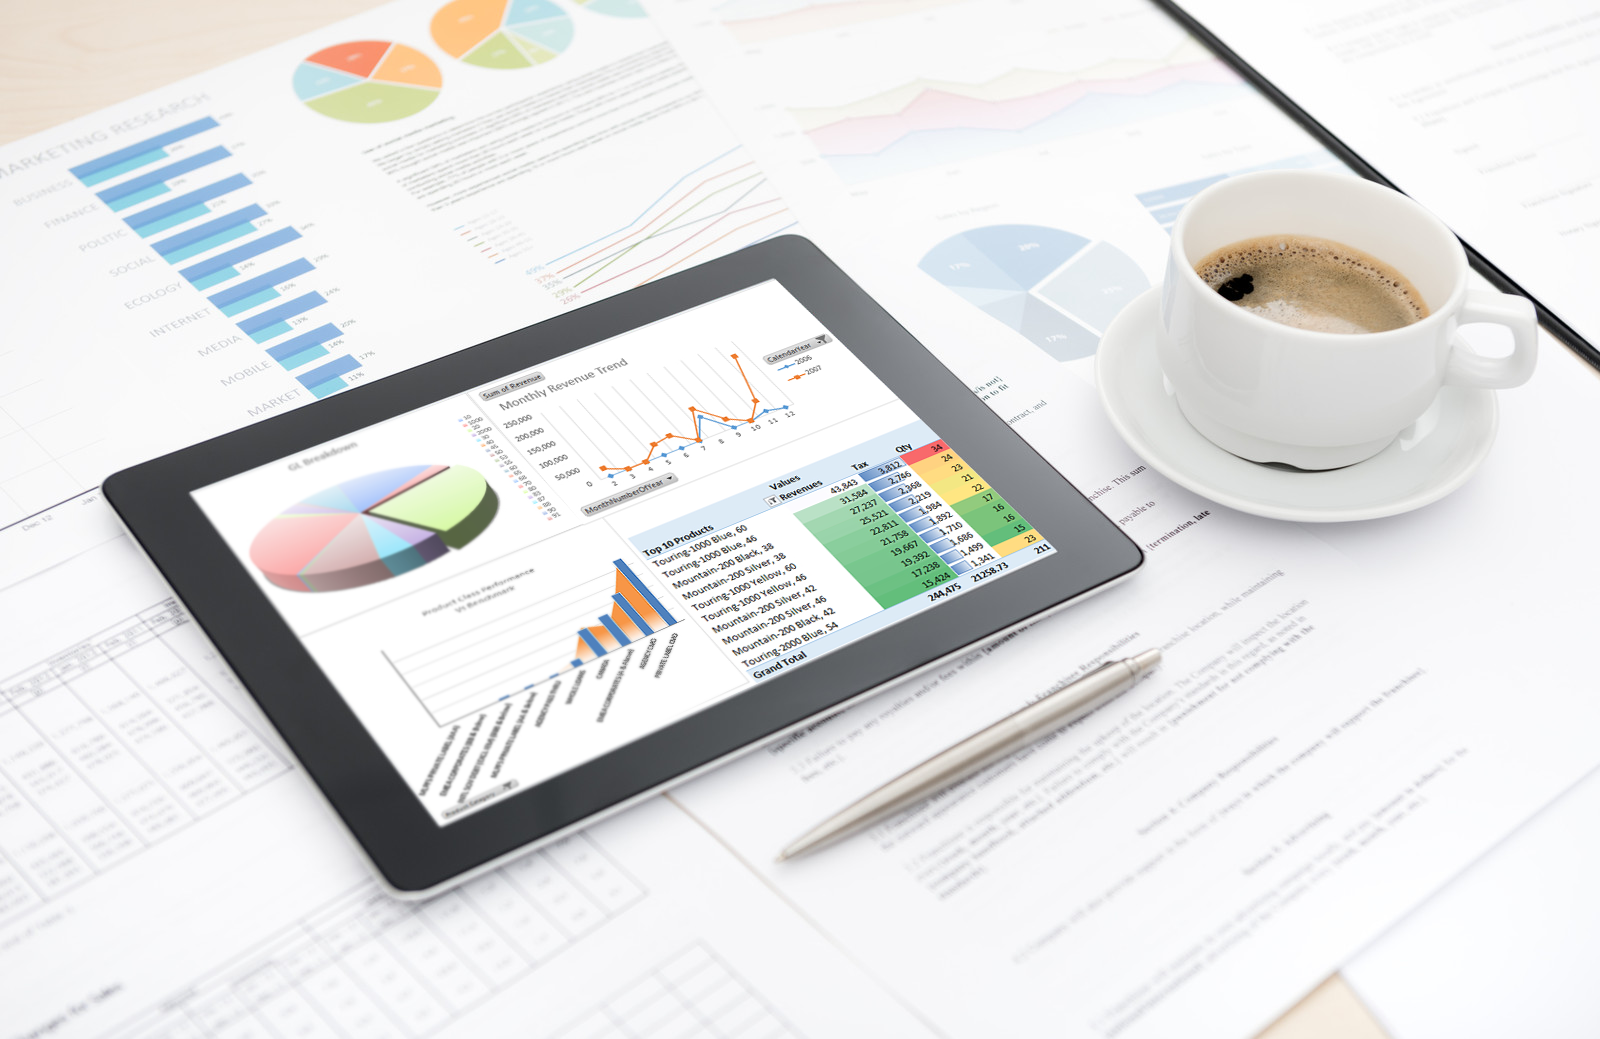
Screenshot of Clear Analytics integrated Excel panel essentially transforms standalone Excel into an enterprise strength, fully auditable, collaborative and centralized business intelligence platform.Screenshot of Users have the ability to dynamically query systems and render that data in any way they like.  No more waiting on IT to create reports.Screenshot of Your firms existing knowledge of Excel enables the firm to be product from day 1. Use the skills already present in your organization and don't pay for outside reporting consultants to create reports for you.Screenshot of Leverage the integration capability of Microsoft's Power BI to extend the reach of your data to web and mobile devices.Screenshot of Leverage all of Excels capabilities, from it's slicers to miniature spark-line charts to create incredibly informative and responsive dashboards.

Looker Screenshots

Screenshot of a Looker dashboard with a geo chart.