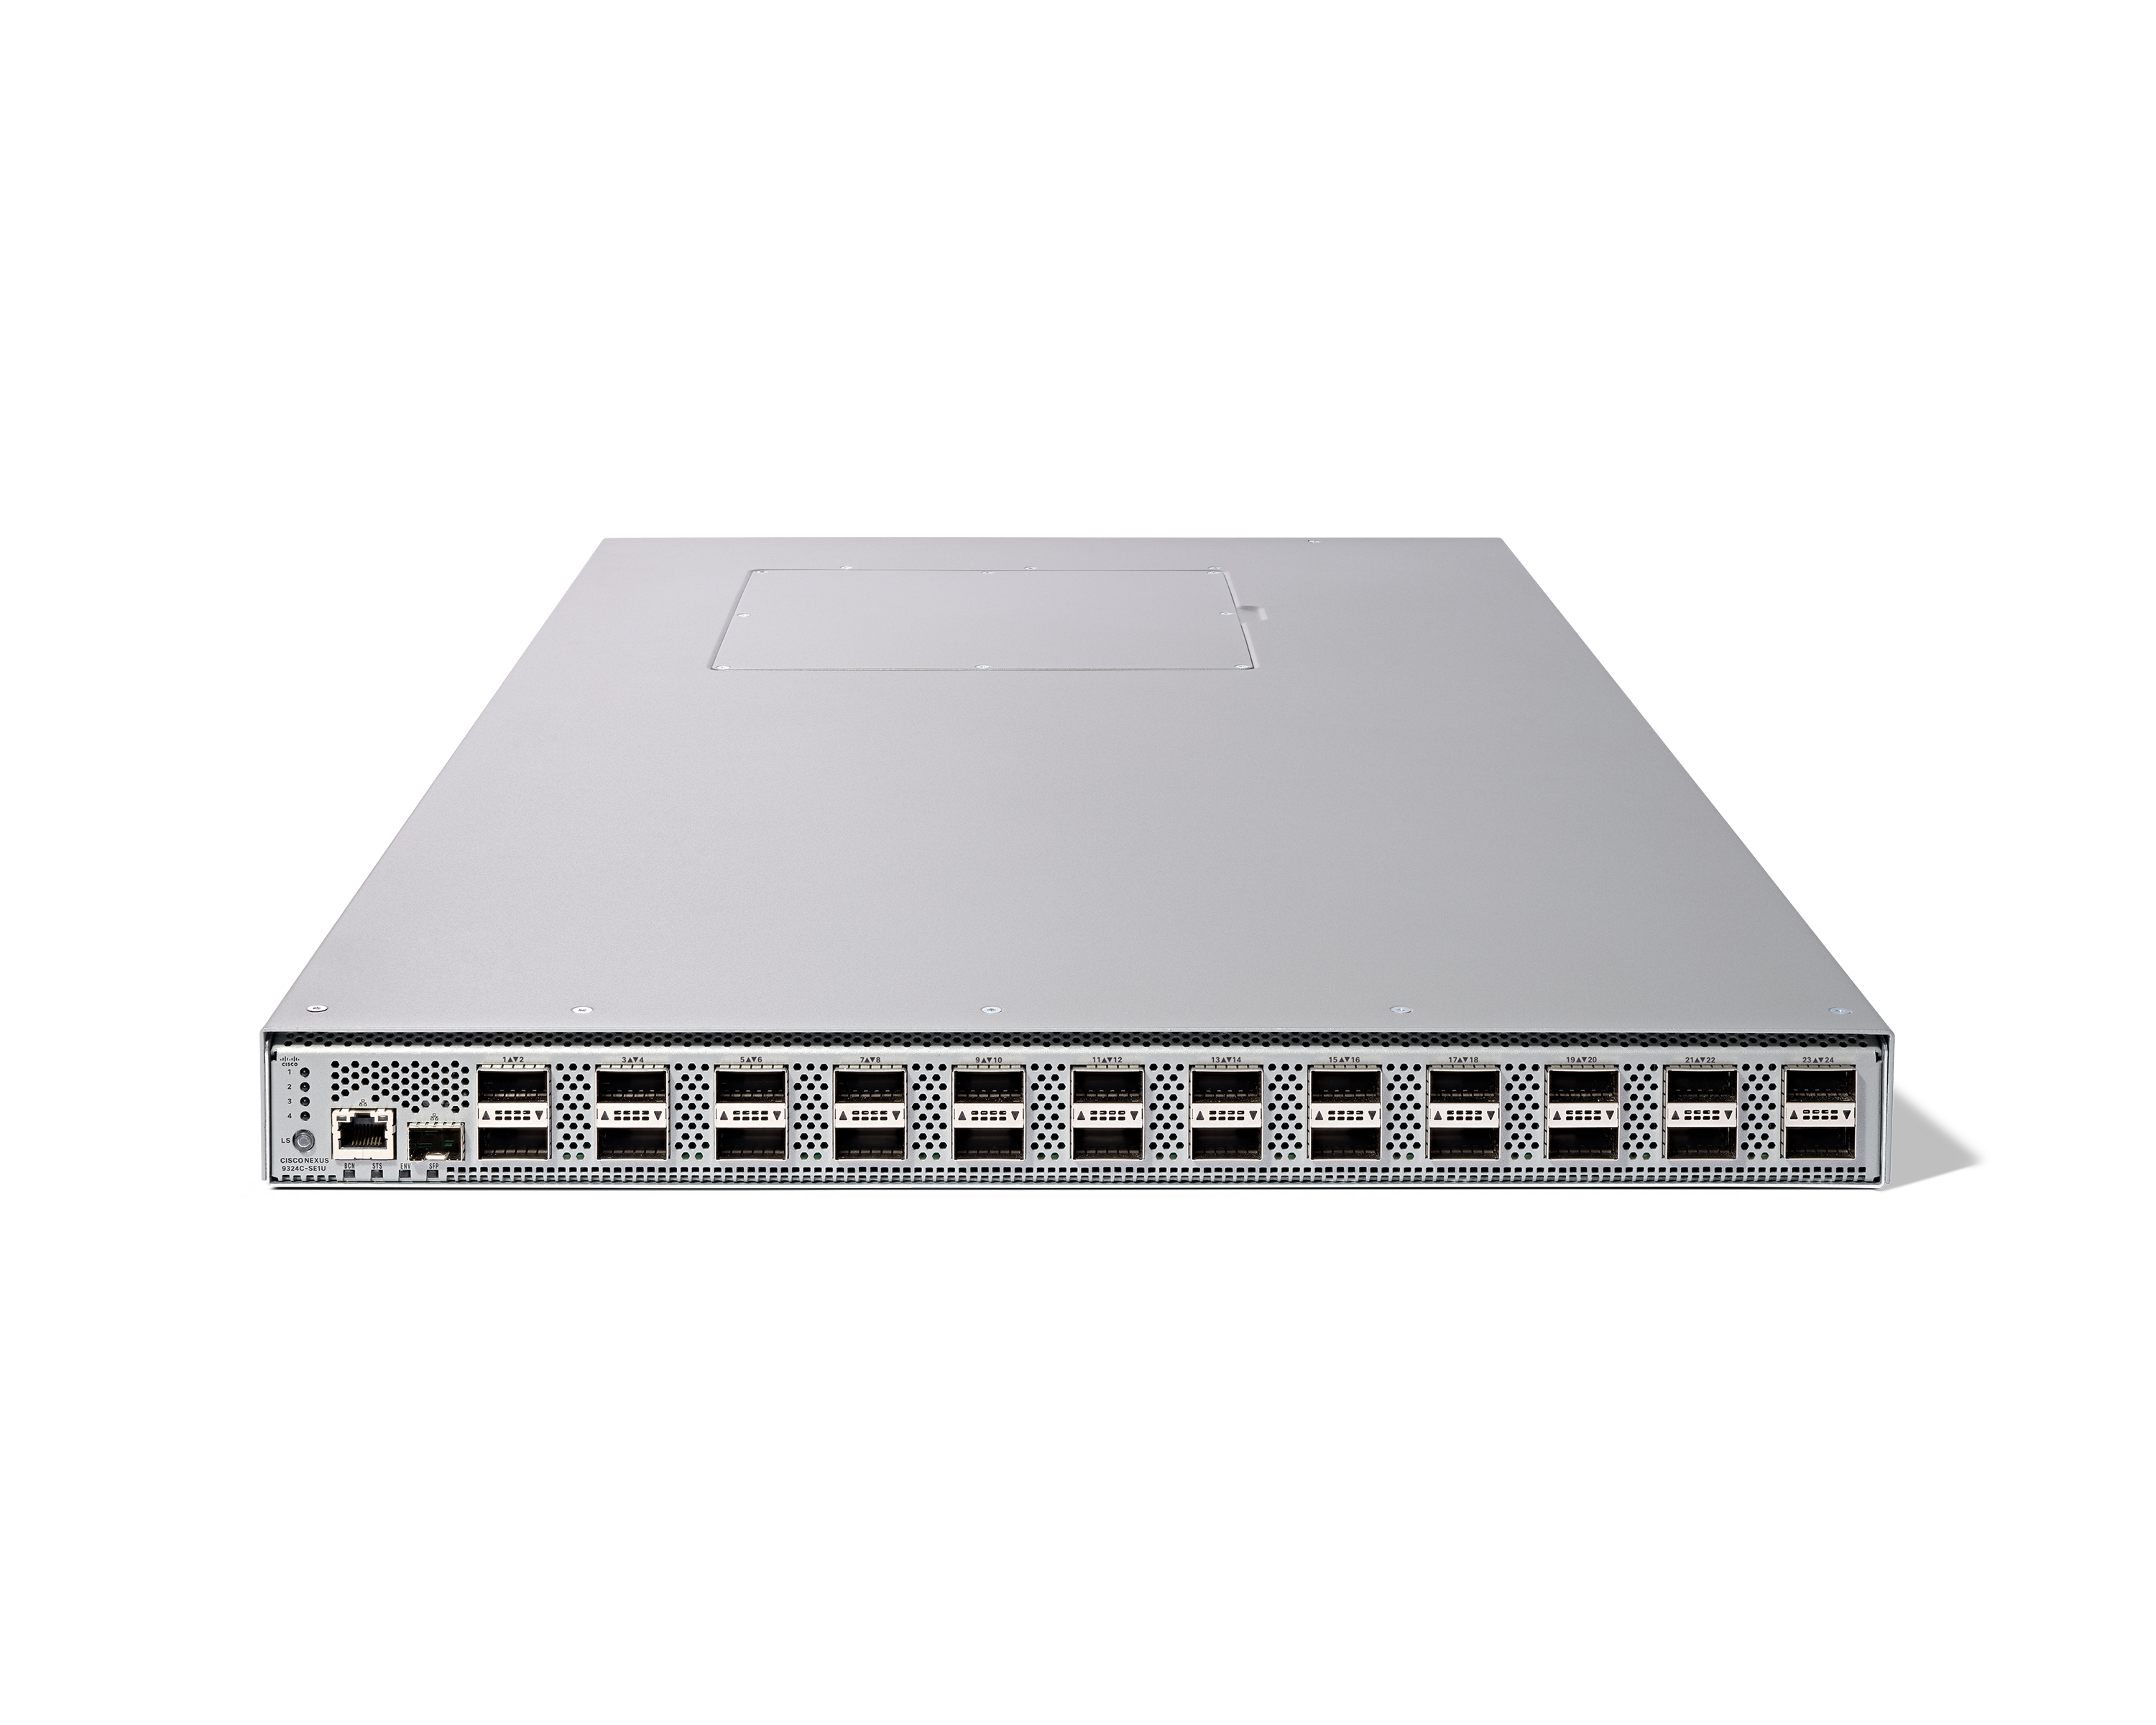
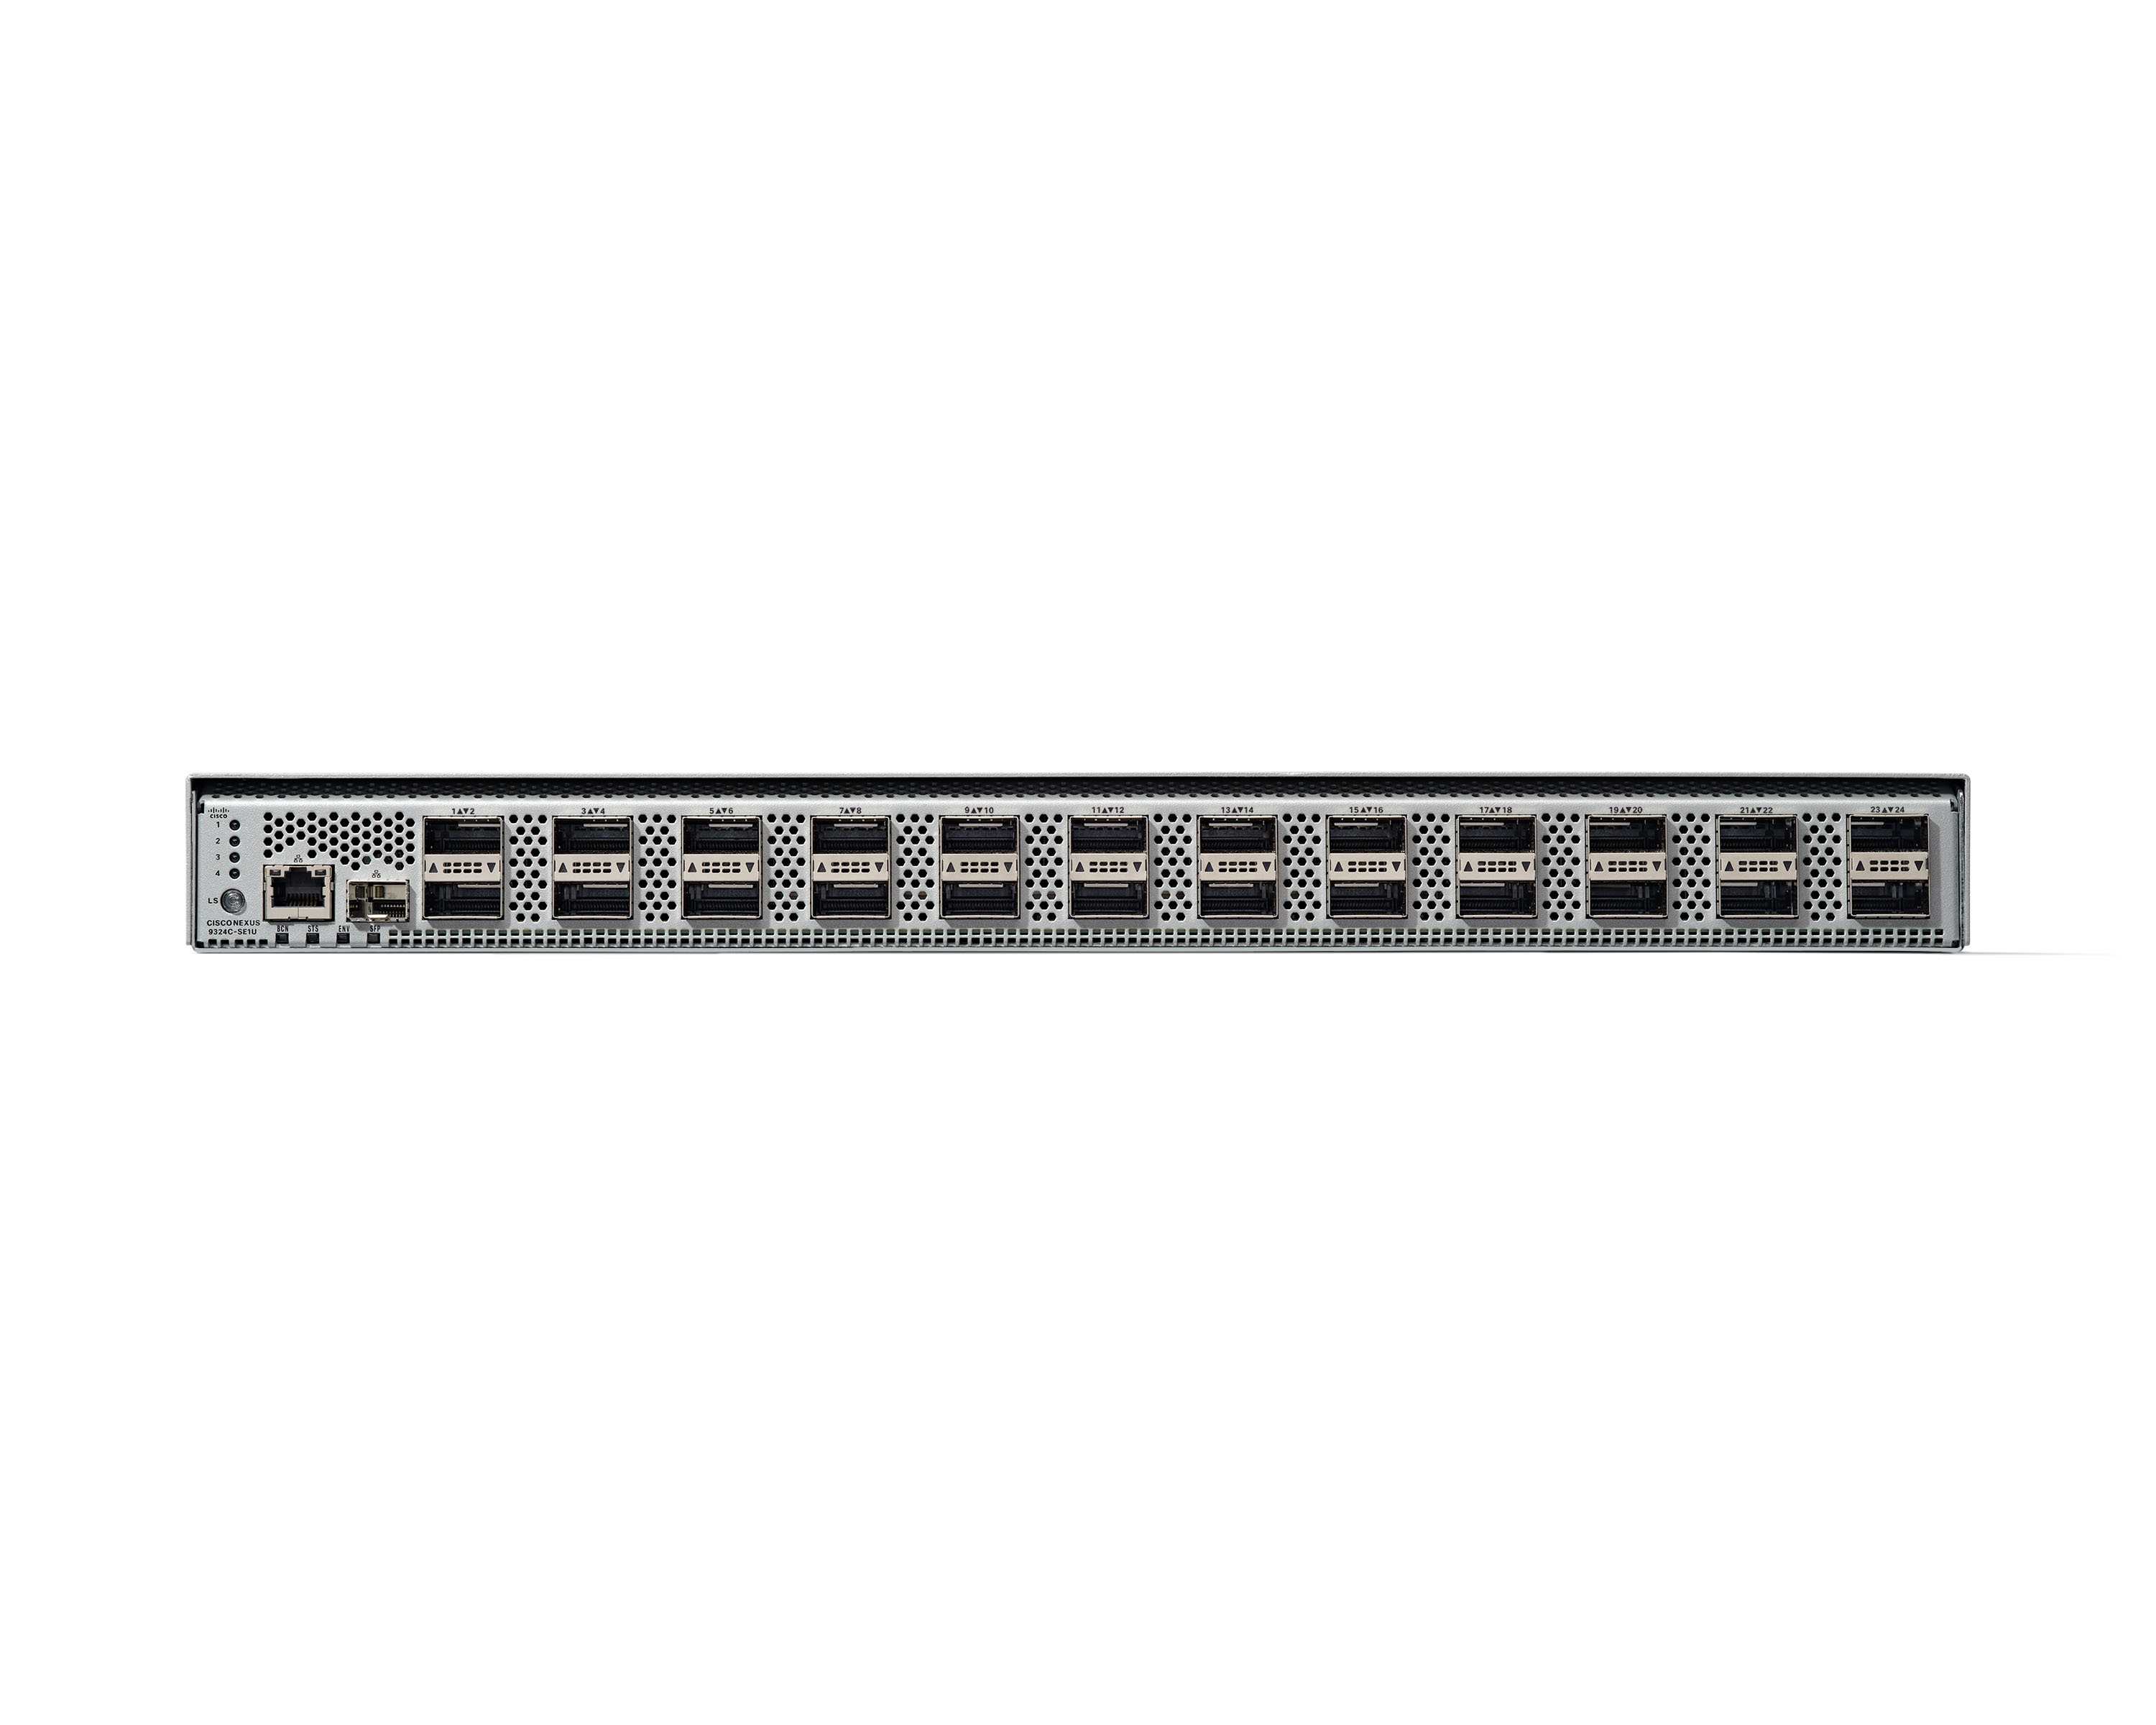
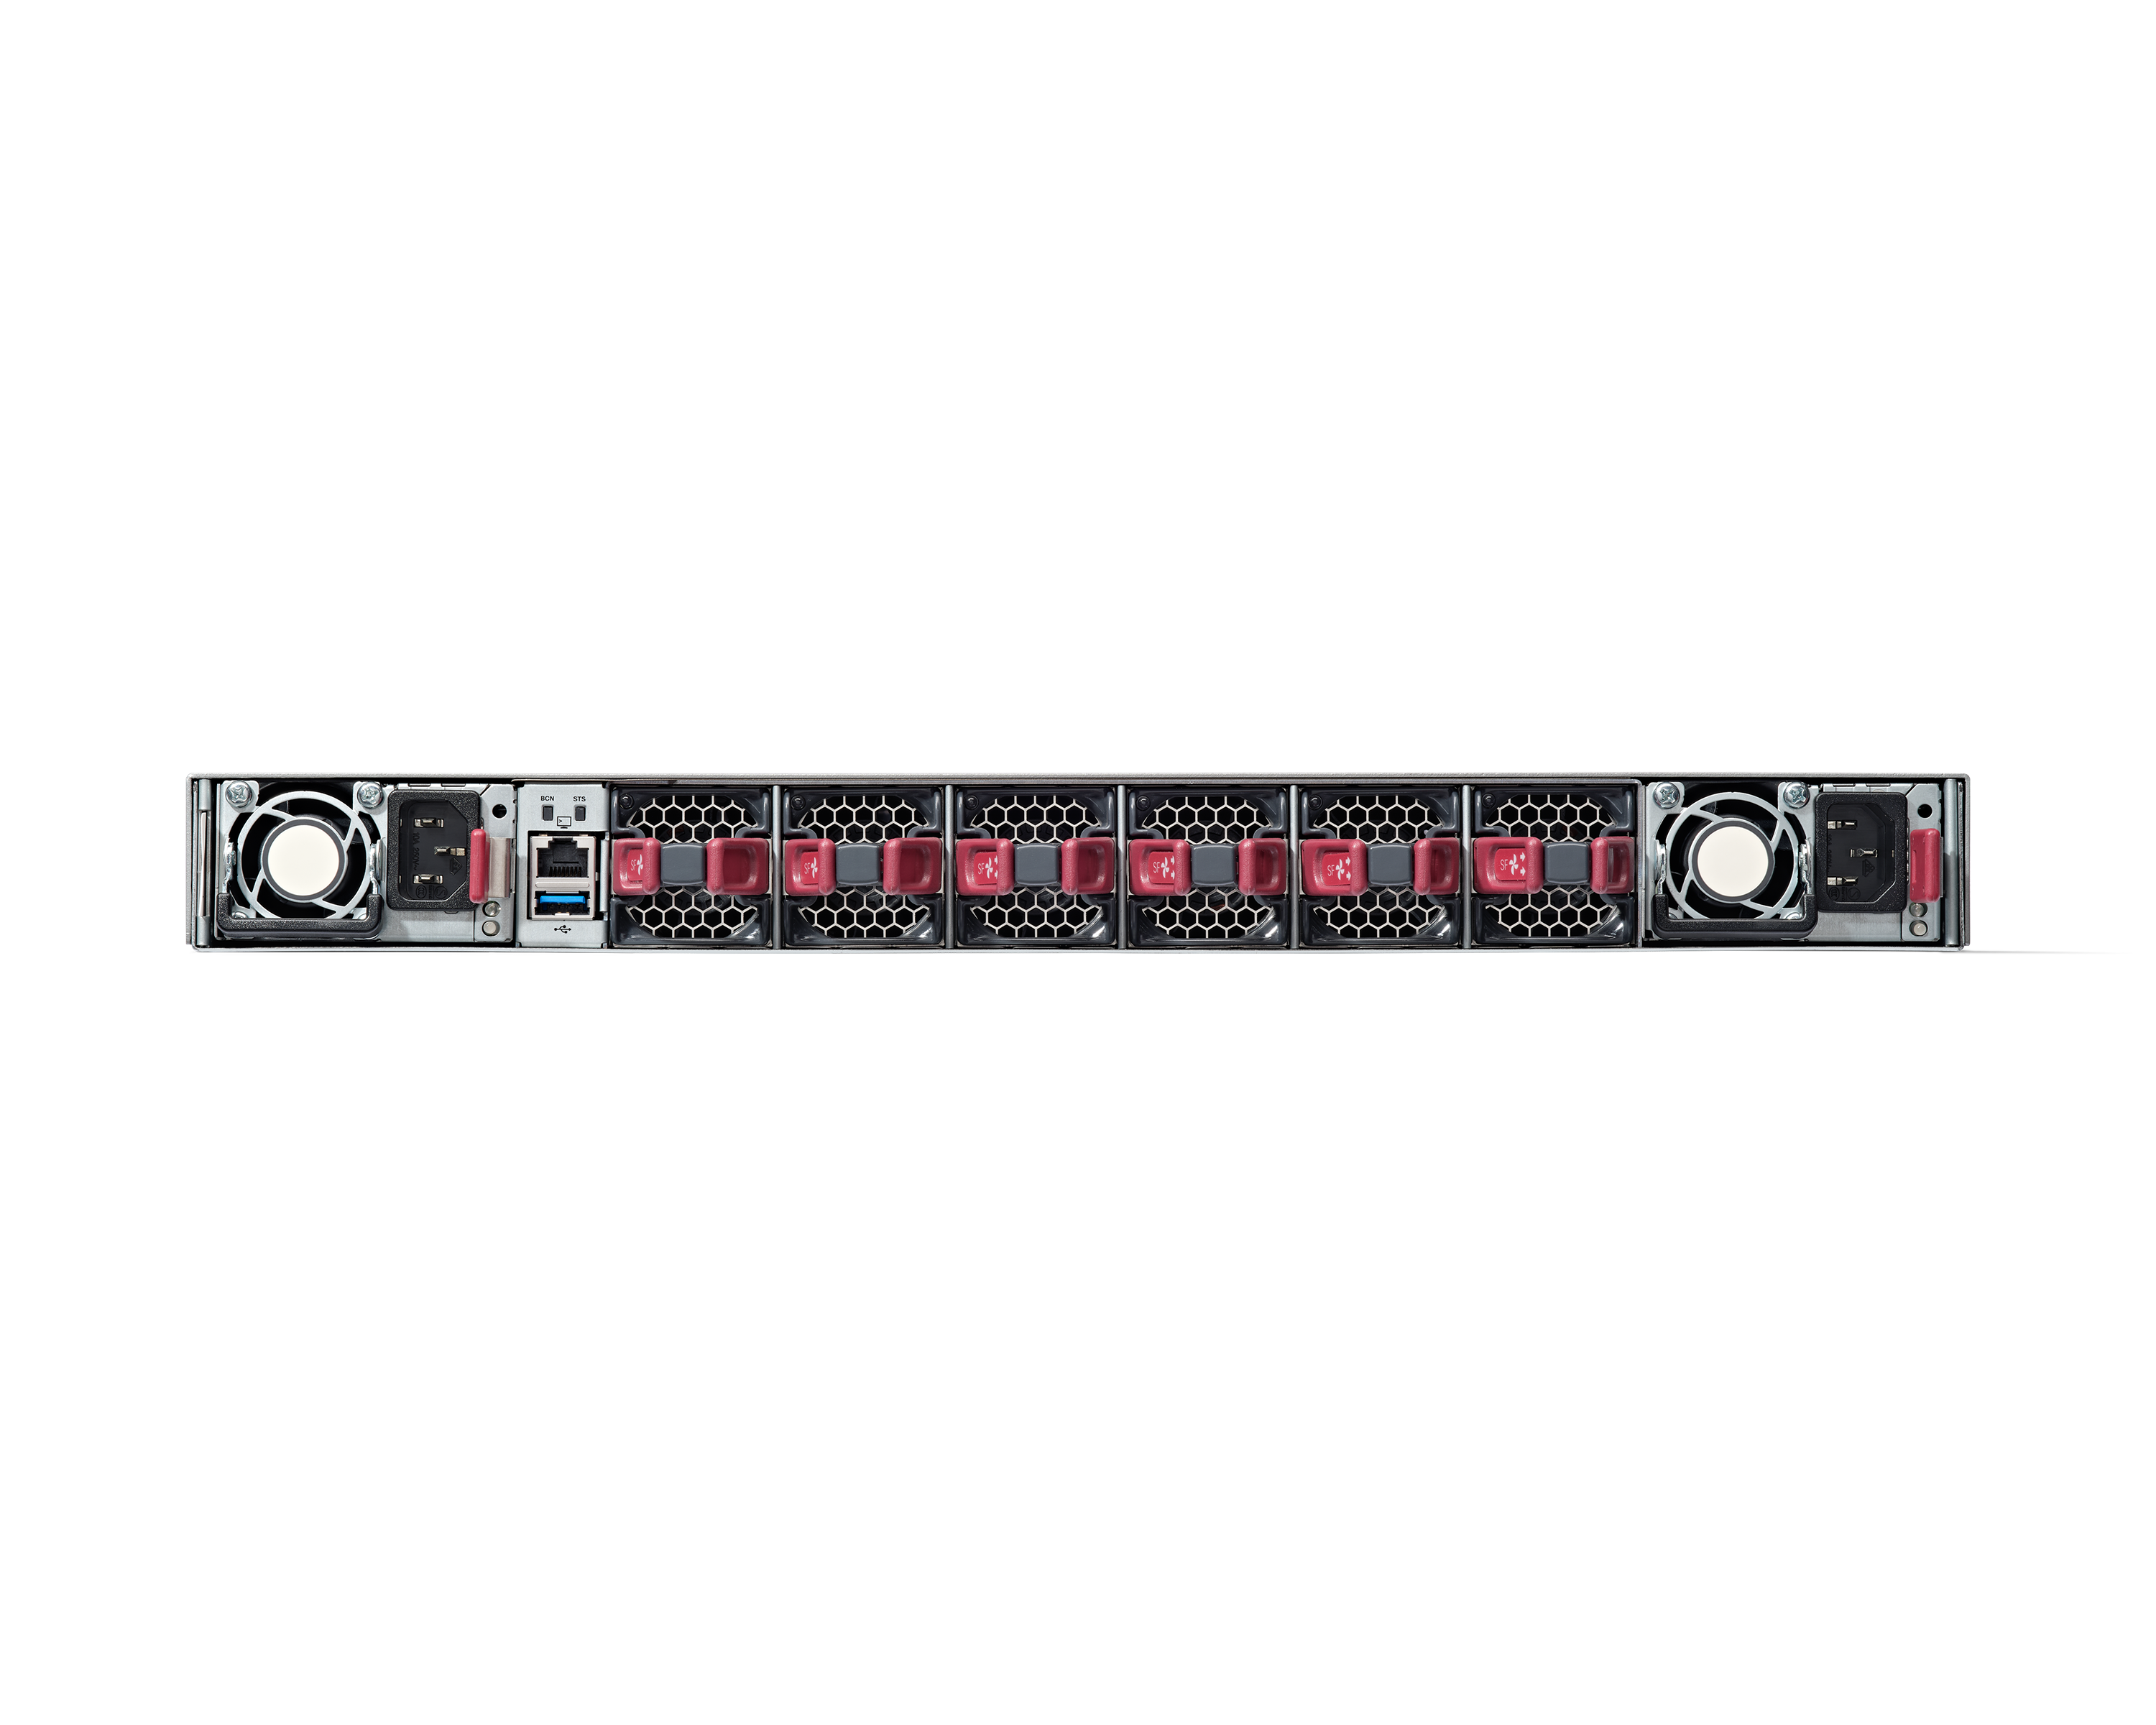
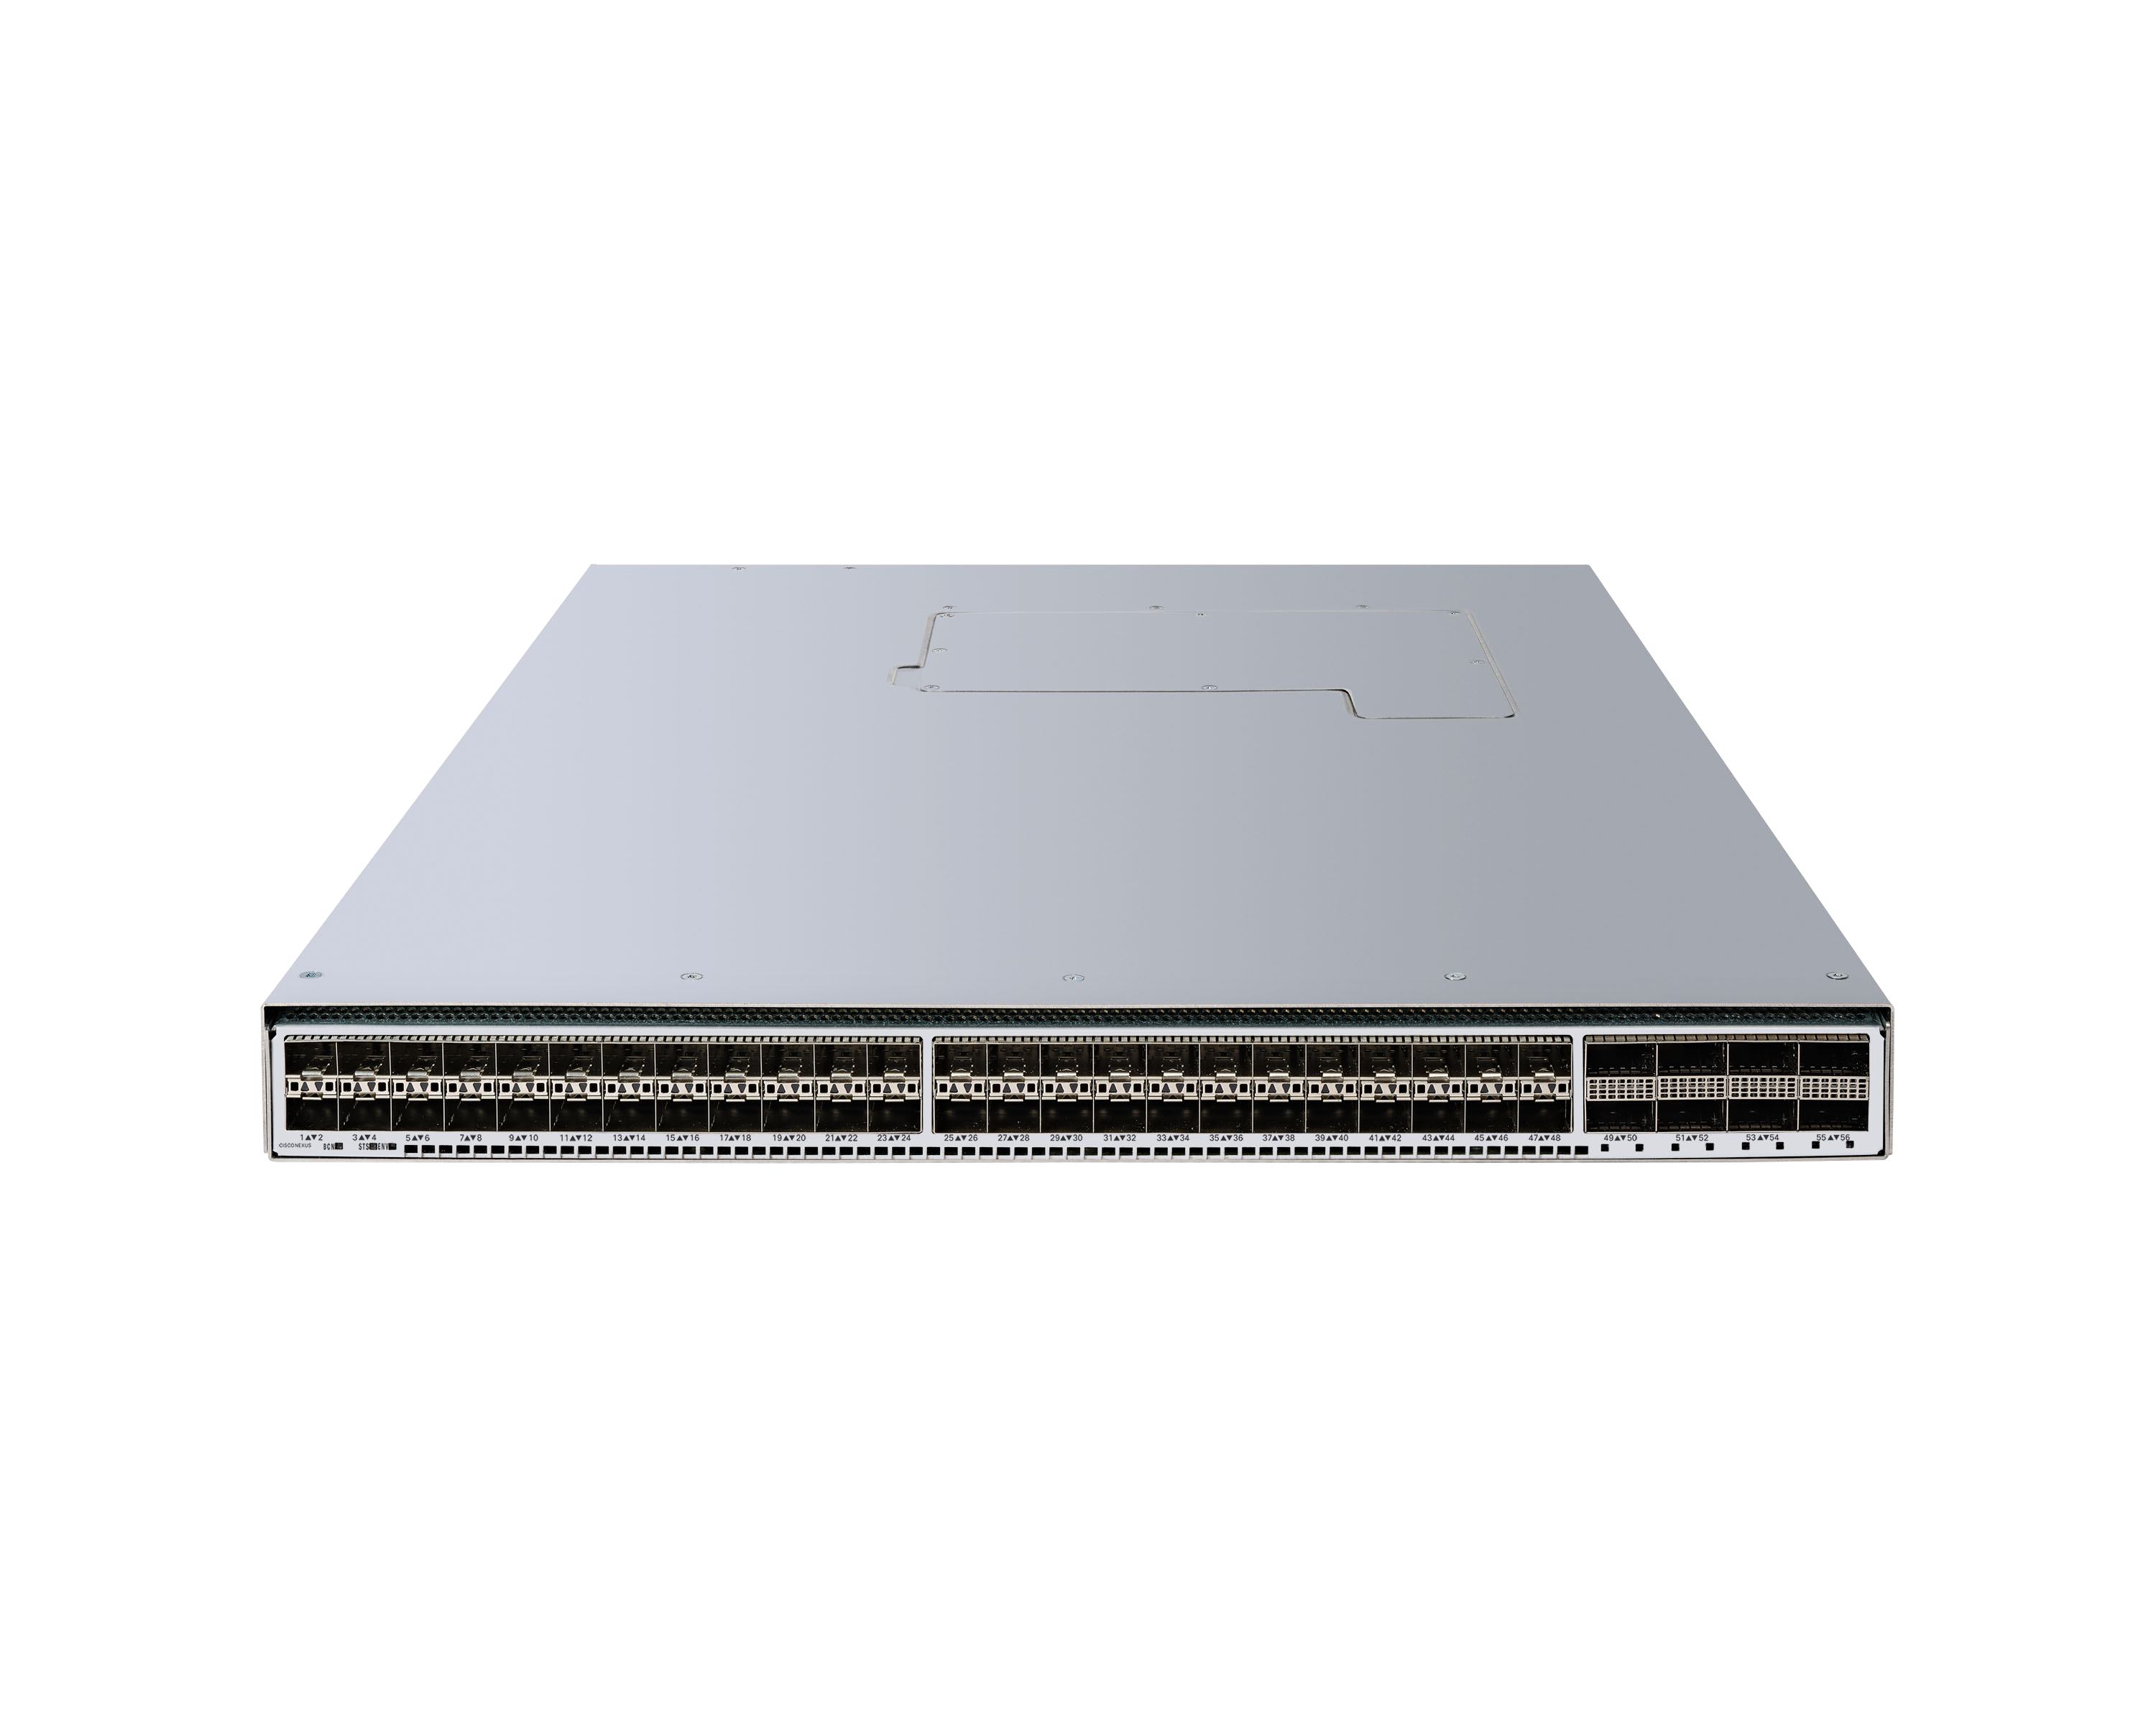
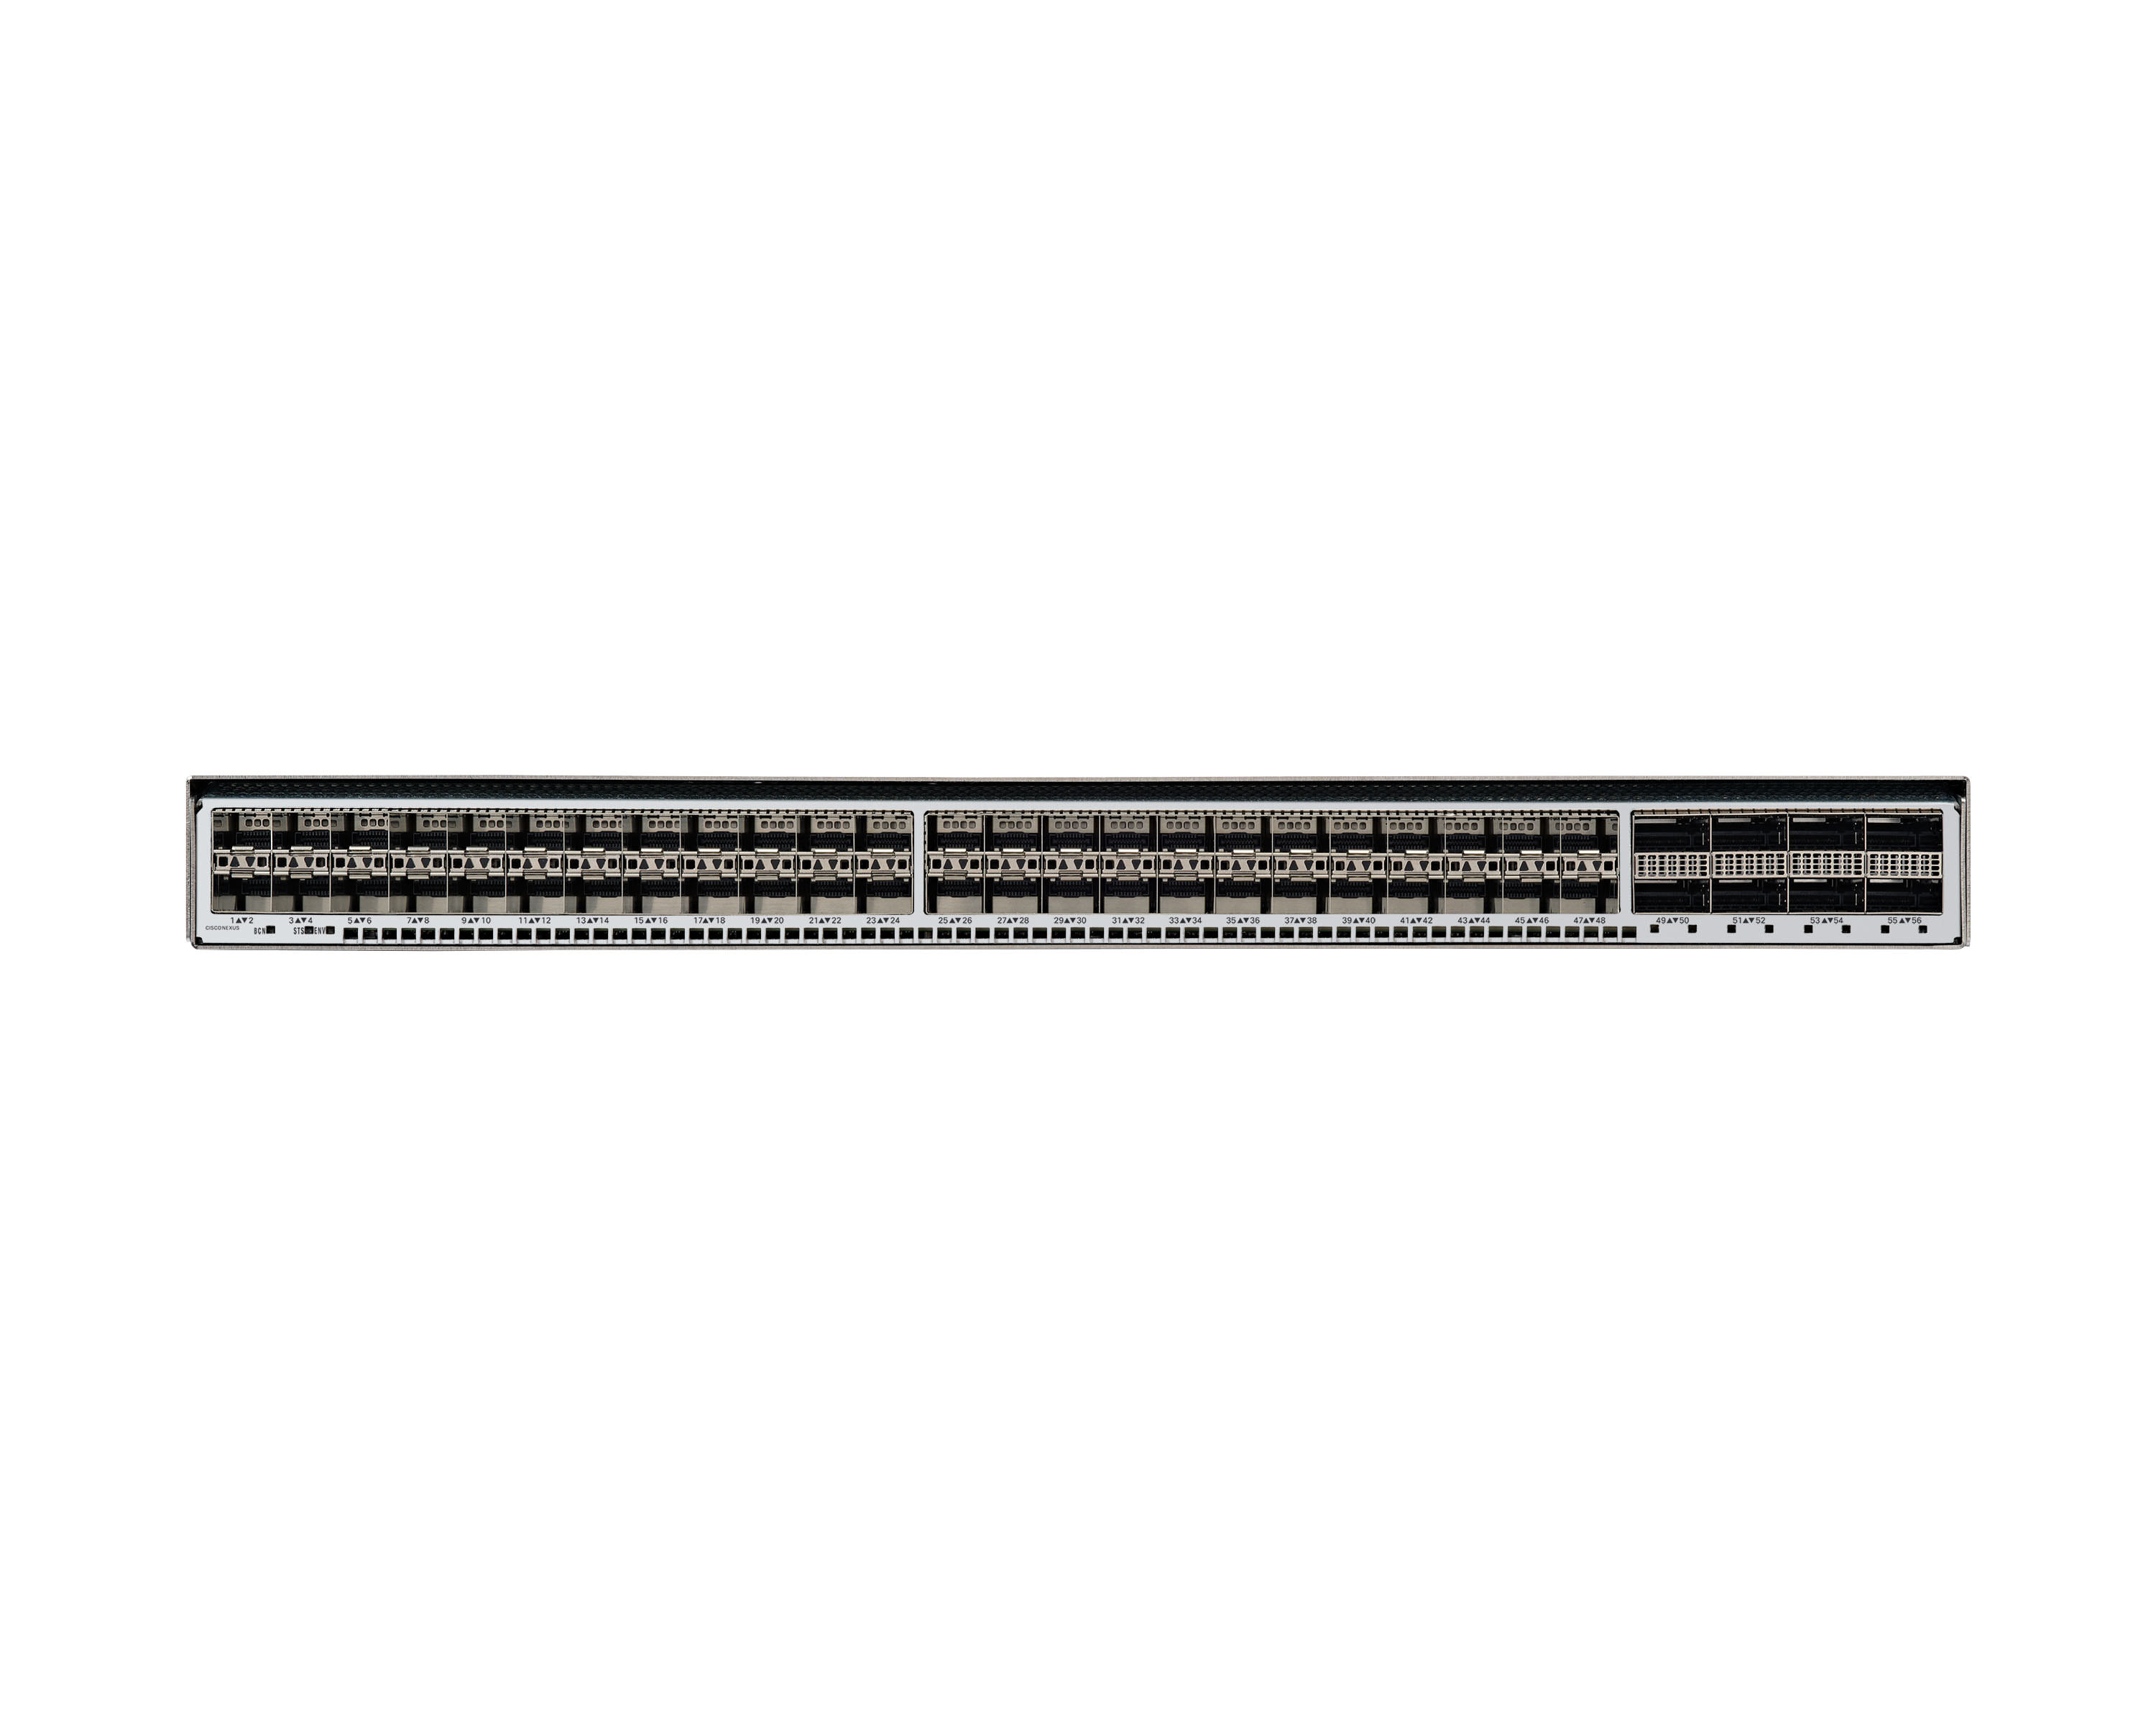
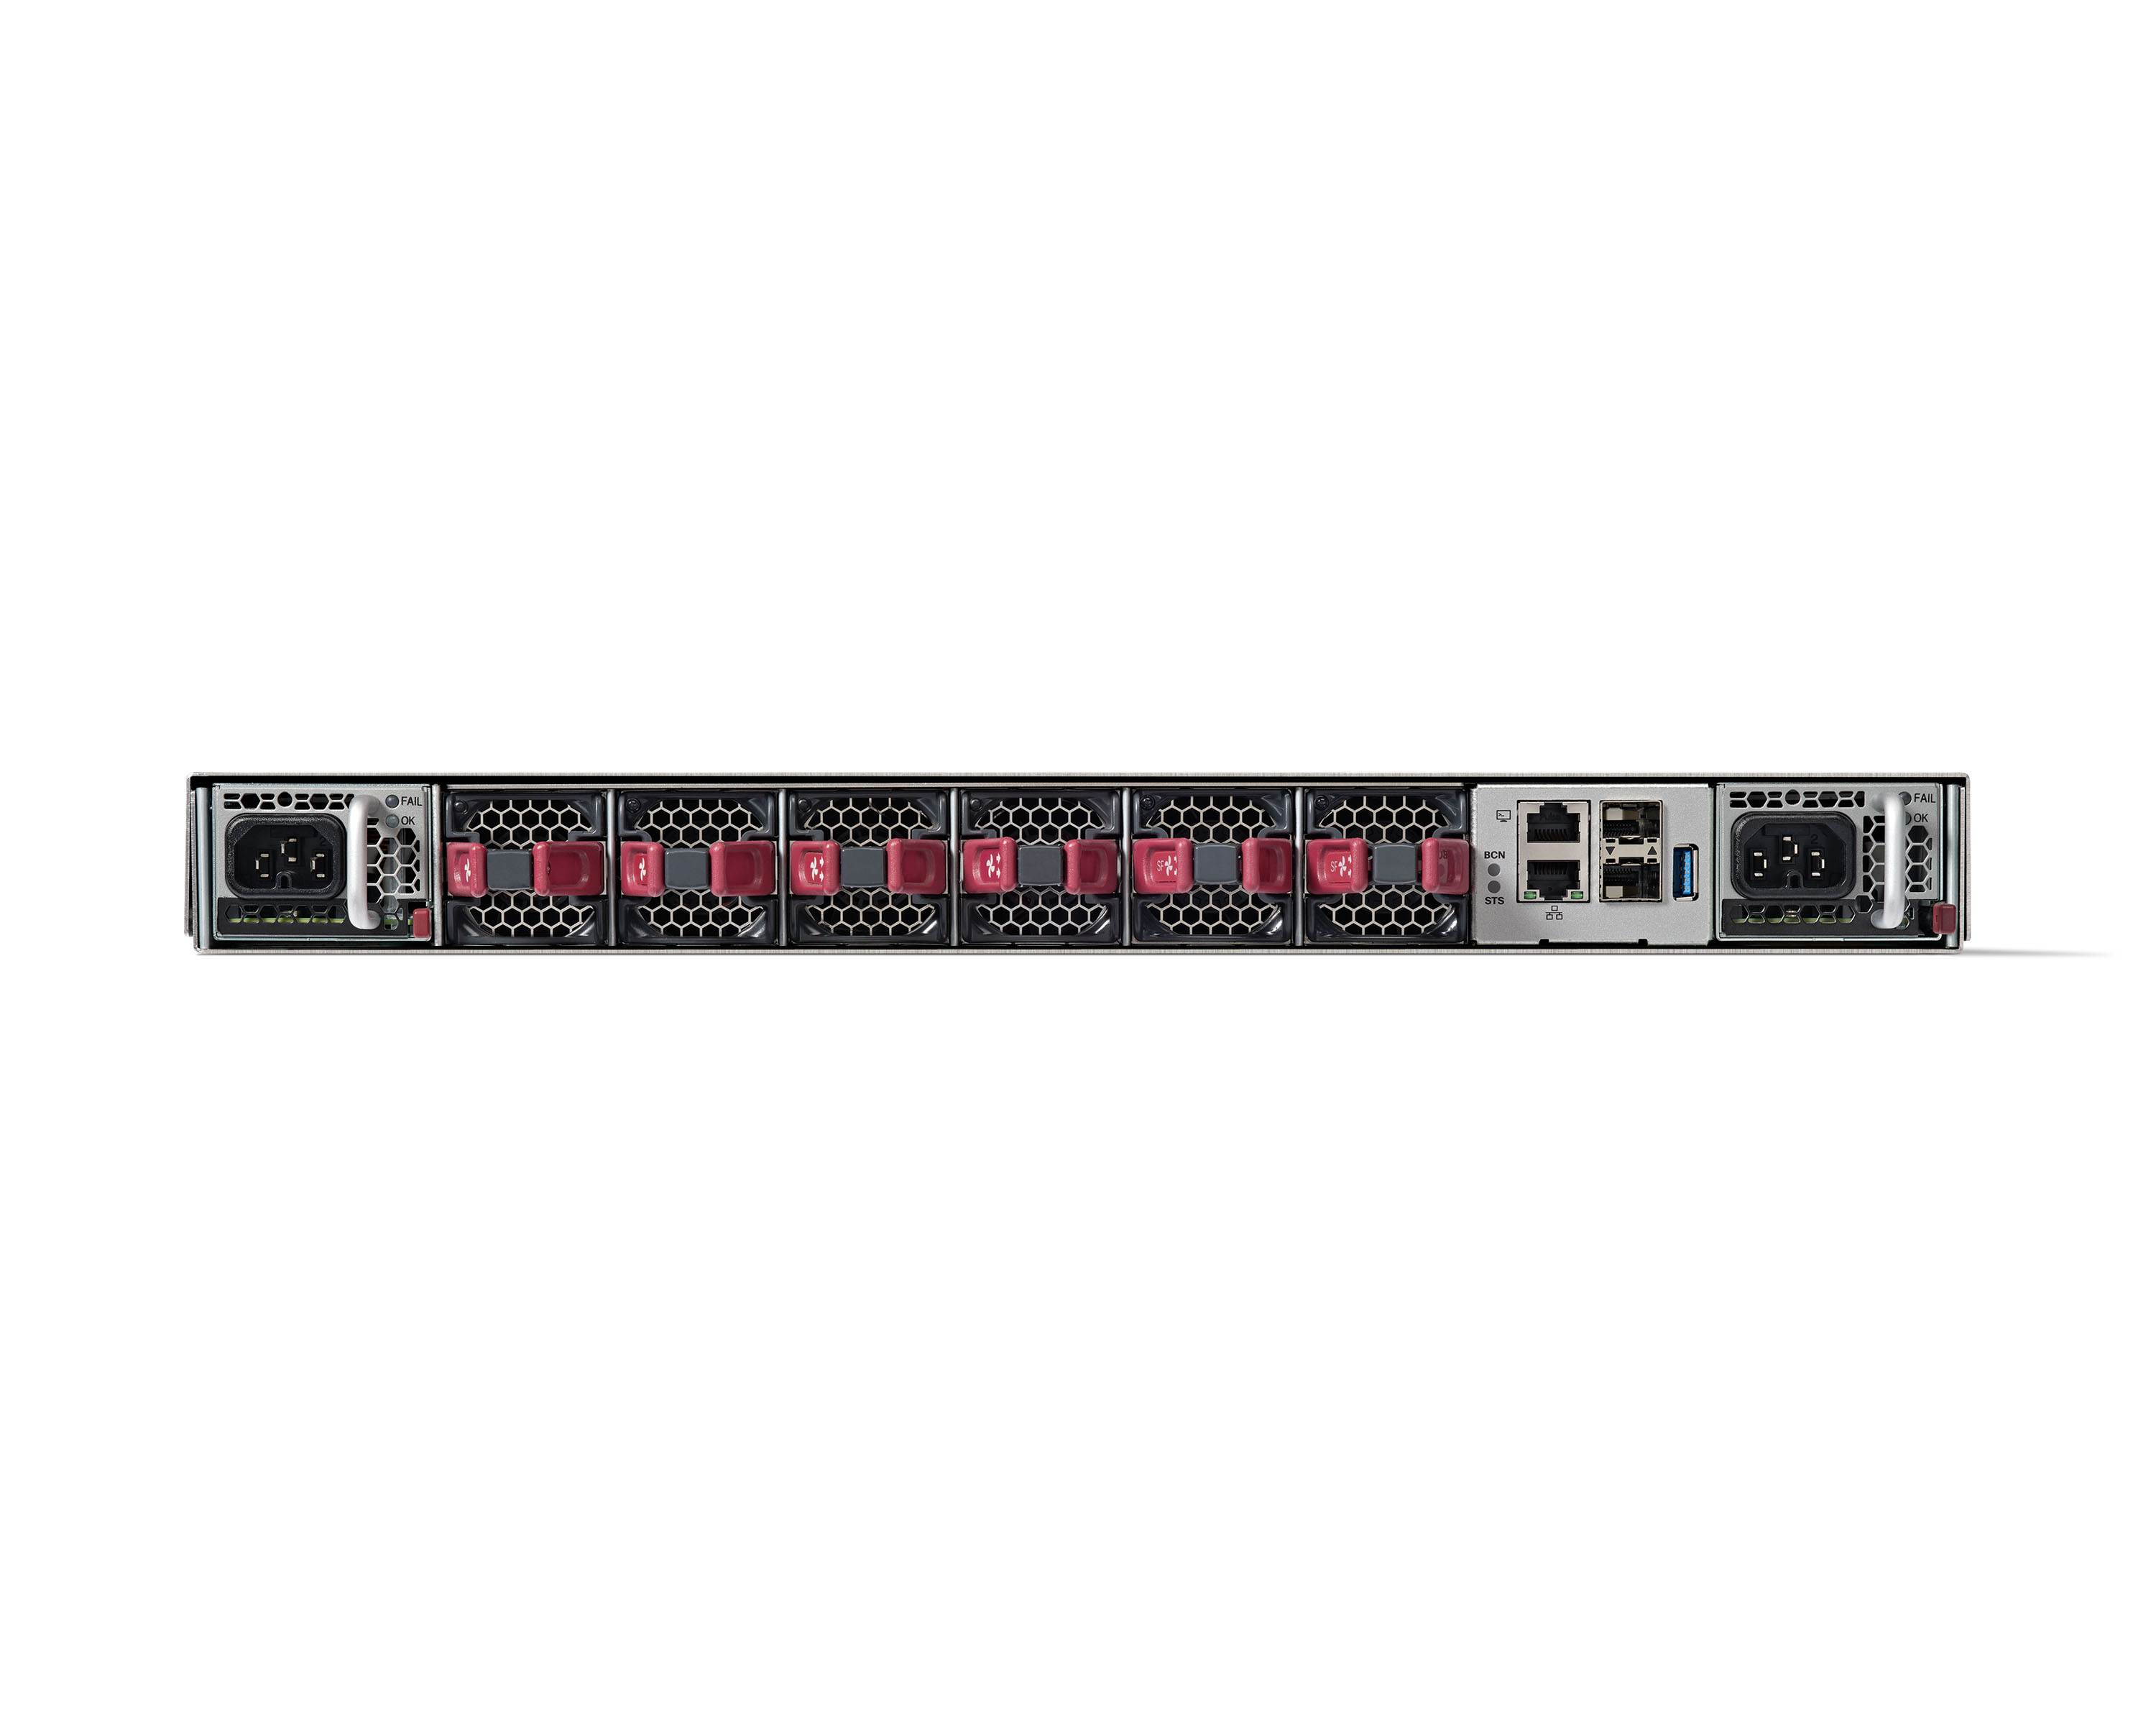
Cisco Nexus Dashboard simplifies data-center networks with automation and analytics. The data-center network helps organizations to meet business demands, and provision reliable data-center networking services as fast as possible, when and where organizations need it. As network infrastructure management is becoming more complex, diverse, and distributed, with multiple configuration points, monitoring tools, and vast amounts of data being generated every second. Cisco Nexus Dashboard is…
N/A
Juniper Paragon Insights
Score 7.8 out of 10
N/A
Paragon Insights (formerly HealthBot) is a cloud-native, network health and diagnostic solution that provides operational intelligence across all service provider, cloud, and enterprise network domains, from network access to servers in the data center. Paragon Insights supports multiple open-source data collection formats, including Junos telemetry interface (JTI) and standards-based OpenConfig telemetry. Once collected, built-in advanced…
Nexus Dashboard is a vital tool for Cisco data center Nexus deployments, in my opinion. By utilizing multiple applications in the suite, a business can utilize orchestration, monitor services and traffic, test deployment scenarios, verify upgrade processes and readiness, etc. The capabilities of the system can allow for SAN MDS controls, traditional Nexus NXOS integration, and/or essential ACI tools
such tools in the IT market but the advanced way of providing and supporting a company’s network is unmatchable in the case of Paragon. It has the capability to withhold big companies' networks as well. Its integration, closed-loop automation, and network visibility are a few of the nitty-gritty features that make it a perfect solution for our company and I just hope that it won't disappoint anybody that has chosen it and prioritized it over other such tools. Less Appropriate: it is not so favorable for beginners because of the level of difficulty and less documentation.
It provides monitoring for our overall ACI Fabric which includes the Controller, Spine, and Leaf Switches.
It gives you a single pane of visibility of all of your ACI fabric using Nexus Dashboard, no need to login to each of the multiple ACI fabric controllers.
Provides an assurance analysis to to your ACI fabric before implementing any change in configuration, they have the Pre-change analysis prior to the firmware upgrade.
Gives you the overall health of your Fabric and provides anomaly severity.
Visibility: it is one of its key features that supports us by showing multidimensional views and facilitates [use] in the monitoring process.
Customization: its flexibility is worth appreciating and its dashboard offers customizations and we can have resource metrics according to our personalization.
Integration: integration is easy and great that allows us to integrate it with any 3rd source platform.
Data collection is another feature that allows us to collect data in our desired standard method.
Flow Telemetry - Need to overcome the restrictions of 20000 flow/sec. No DataCenter is small enough to pump only 20K flows per second. And we want to use this product for proactive monitoring so we cannot decide on a small segment to monitor flow for beforehand.
Creating tags and label for clubbing certain entities so that we can create customized dashboards to monitor and provide access to Operations team
Scheduled Reports and Reporting capability is lacking
For the end user, it is relatively easy to use. However, some training and practice is a must because the NSO is not as straightforward as the traditional router CLI. For the administrator, Cisco Network Service Orchestrator (NSO) is just like another program running on the Linux system--there is no big difference.
Great and effective automation functionalities and the tools on network security management are the best and easy data reports building. Cisco Nexus Dashboard Fabric Controller feature for the network monitoring and easy management of various services and even offers the best analytics and also powerful integration tools for easy data migration.
The Cisco Nexus Series switches perform admirably in our blended distributed system. We have been dealing with any of these sorts of switches for over 5 years and have been exceptionally happy with their functionality. Several of our other computer networks in our data rooms have proved effective with Cisco equipment. Because of the simplicity of maintenance and the high quality of technical support provided by Cisco representatives, there is a high level of trust in these switches.
Paragon Insights was chosen as it was able to handle more products than the Cisco Nexus Dashboard. The second qualifying decision point was the level of integration Paragon Insights had over the Nexus Dashboard. Both products would service the need of the client, but Paragon was positioned to provide additional value and ease of use to the customer.
The platform is very well done, and to date, I have had no complaints about the implementation of the platform and no security issues or vulnerabilities. Cisco in all its product releases new versions to resolve security issues or bugs that appear on the platform, this is a big plus.
Because it guarantees us expandable network services and without any interruption, providing a better service to each of our clients has been possible.
It has allowed us to keep the services innovated, doing this process in a reduced time, since it does not require a long programming, so implementing new services is done at a rapid pace.
Its automation has allowed us to reduce the burden of manual configurations, so having errors has also decreased.
Because it is based on an automation and orchestration model, providing faster and larger-scale services is possible.