Chrome DevTools is a set of authoring, debugging, and profiling tools built into Google Chrome.
N/A
LT Browser
Score9.5 out of 10
N/A
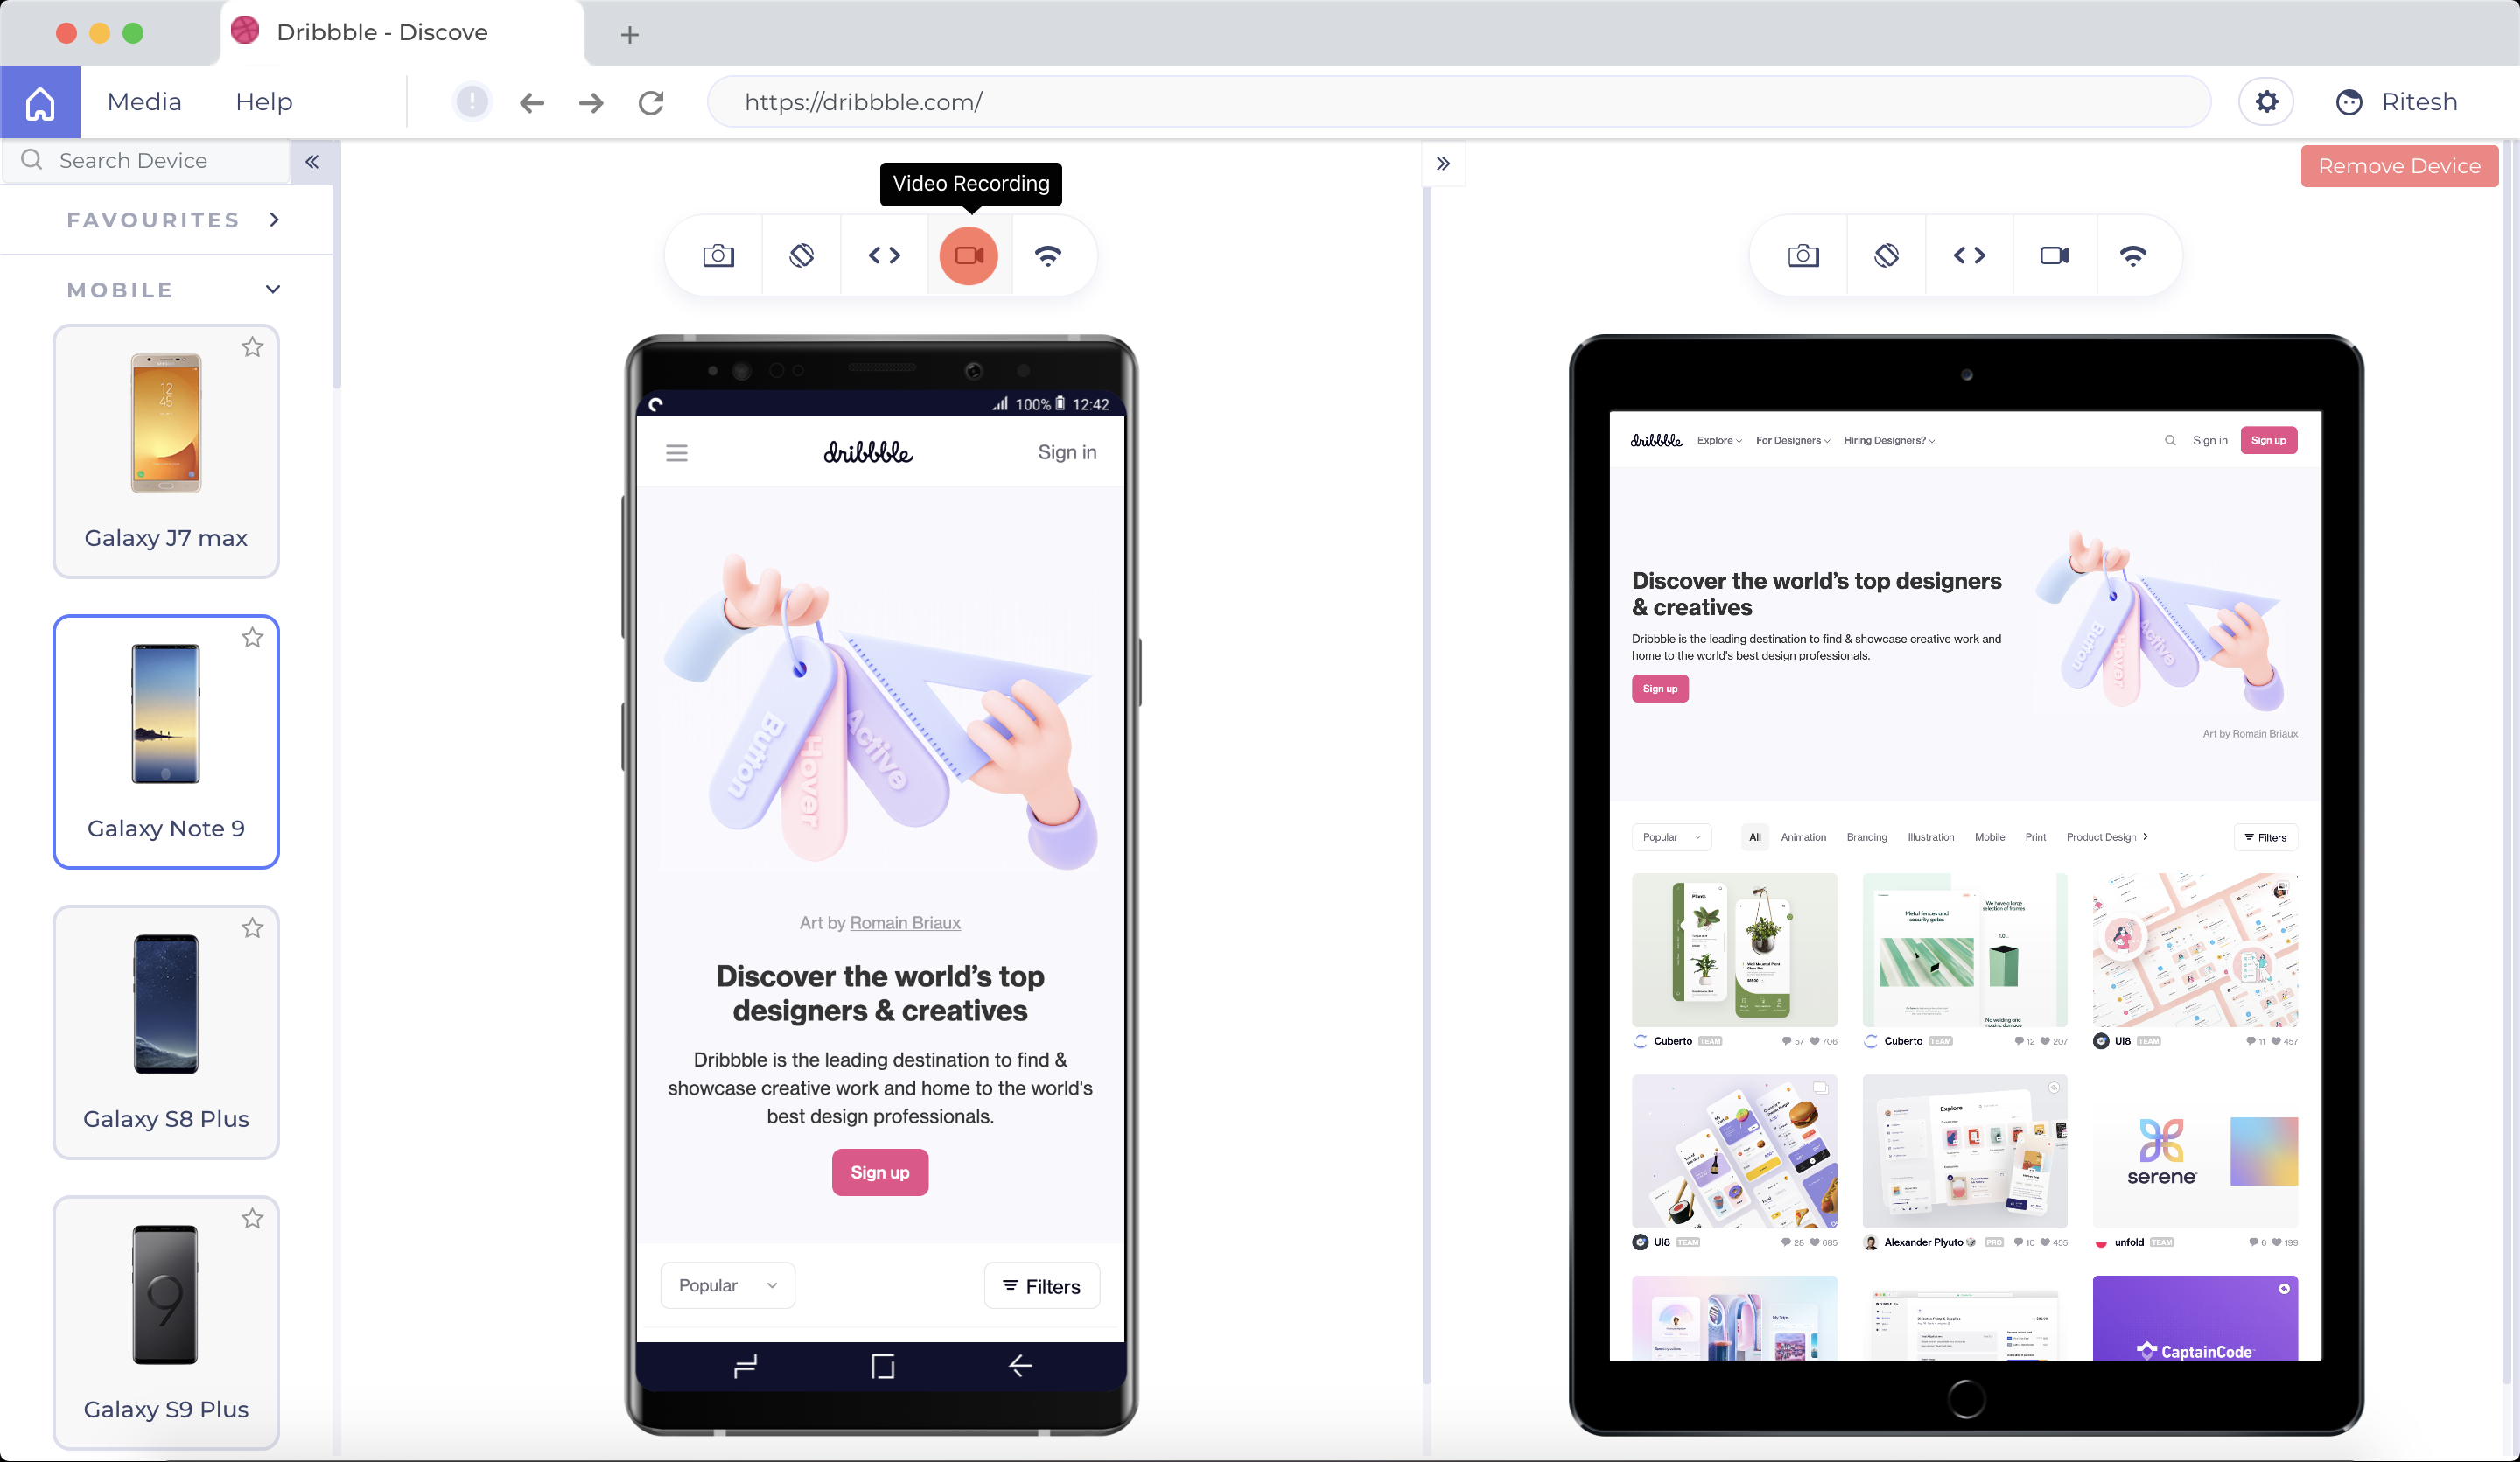
LT Browser allows users to test the mobile view of a website on different screen
sizes and resolutions. With over 50+ devices to choose from, LT Browser aims to make mobile
website testing easier, and ensure that a website is mobile responsive. Users can create their own custom
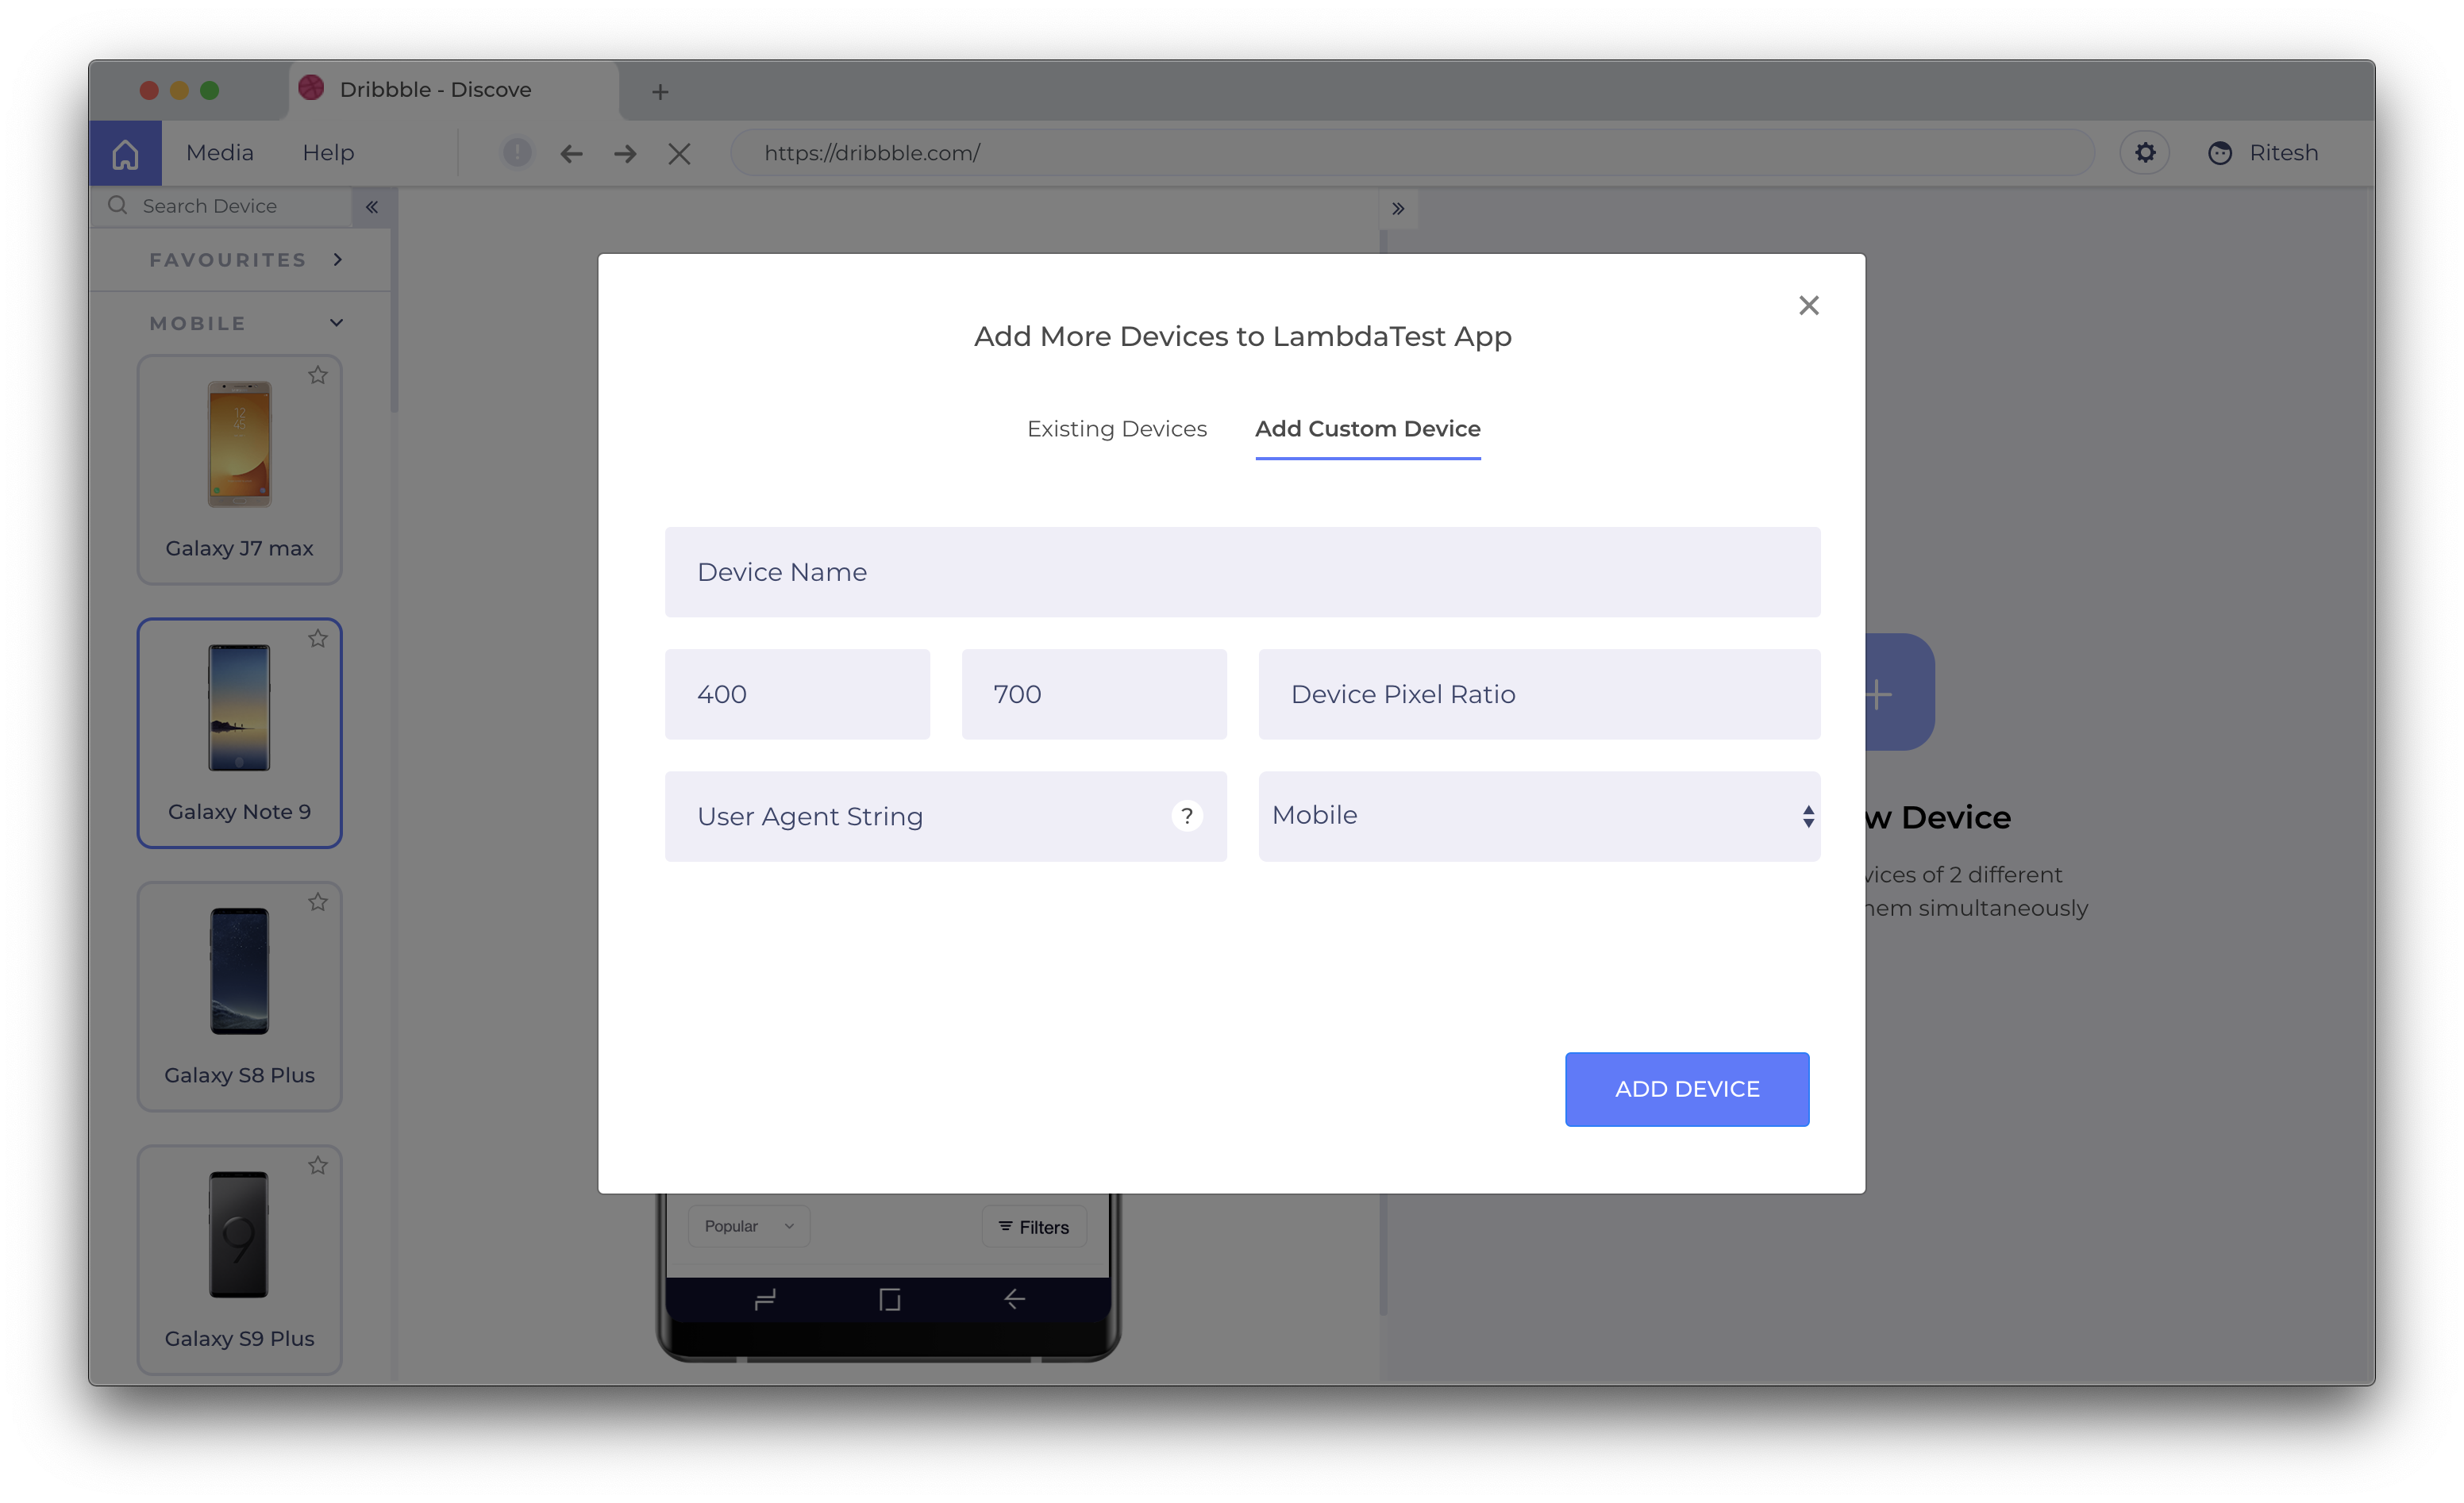
devices and save it for future uses. Create new mobile, tablet or
desktop devices and test a website on various devices, screen resolution
and perform screen resolution test for website on different screen…
Student in Human Resources at Universidad Nacional Autónoma de México (Education Management, 10,001+ employees)
Chose LT Browser
Tools of this type that I have tried, I think LT Browser is the most complete of them and the most affordable on top of everything else, considering that it also offers a plan for students; in addition, I believe that it is backed by Lamdatest and all the possibilities that can …
A de minimis incentive was given to thank the reviewer for their time. The incentive was not used to bias or drive a particular response, nor was the incentive contingent on a positive endorsement. More Info
Verified User
Chose LT Browser
LT Browser has more use-cases that one could test out and be sure about the solution that QA are signing-off
A de minimis incentive was given to thank the reviewer for their time. The incentive was not used to bias or drive a particular response, nor was the incentive contingent on a positive endorsement. More Info
Chrome DevTools helps us identify areas to address such as optimising website performance, cross-browser compatibility, and responsive design. We use the Coverage and panel to identify any unused code, which can cause slow loading times, together with the Network panel which is crucial for analysing page load performance and optimising resources.
A de minimis incentive was given to thank the reviewer for their time. The incentive was not used to bias or drive a particular response, nor was the incentive contingent on a positive endorsement. More Info
I think LT Browser is one of the best programs I know to perform performance, usability, and experience tests on websites because it has a wide range of tools for this purpose; in addition, I consider that its price is affordable for professionals or freelancers with little income as well as for large companies that want the best tools, best of all, is that Lamdatest offers a free plan for students and I think LT Browser is also a very good tool for learning. On the other hand, and being quite honest, I can't find scenarios where LT Browser is not suitable in its area of application or what this software is specialized in.
A de minimis incentive was given to thank the reviewer for their time. The incentive was not used to bias or drive a particular response, nor was the incentive contingent on a positive endorsement. More Info
Provides clear, easy to understand, and actionable intelligence on how the browser is retrieving, parsing and rendering the page.
Covers a wide gamut of front-end development tasks, from manipulating CSS rules to line-by-line debugging of JavaScript to helpful page and server insights.
Continuously incorporates new tools and helpful features. With nearly every major Chrome release there is a "What's new" update with at least one or two useful items.
A de minimis incentive was given to thank the reviewer for their time. The incentive was not used to bias or drive a particular response, nor was the incentive contingent on a positive endorsement. More Info
A de minimis incentive was given to thank the reviewer for their time. The incentive was not used to bias or drive a particular response, nor was the incentive contingent on a positive endorsement. More Info
A de minimis incentive was given to thank the reviewer for their time. The incentive was not used to bias or drive a particular response, nor was the incentive contingent on a positive endorsement. More Info
A de minimis incentive was given to thank the reviewer for their time. The incentive was not used to bias or drive a particular response, nor was the incentive contingent on a positive endorsement. More Info
While Chrome DevTools are very powerful, it's not the easiest thing to use, as there are so many different tools built in. It takes some exploring to discover all the options possible within DevTools, but with a little exploring, the DevTools become a very powerful asset. Accessing the basic HTML and CSS inspection is very easy though, and that's the most common usage for the DevTools.
A de minimis incentive was given to thank the reviewer for their time. The incentive was not used to bias or drive a particular response, nor was the incentive contingent on a positive endorsement. More Info
I'm not entirely sure what to rate the support for DevTools, because I don't have any experience dealing with official customer support for DevTools. I would guess the primary support for DevTools would be in a Chrome forum. Typically if I have a question or issue, I am able to find an answer from doing a quick Google search. It's pretty widely used, so it's not difficult to find answers.
A de minimis incentive was given to thank the reviewer for their time. The incentive was not used to bias or drive a particular response, nor was the incentive contingent on a positive endorsement. More Info
I find them pretty much the same, they have the same tools except Firefox doesn't provide the lighthouse functionality. I do prefer firefox's dark theme and colour palette. But I use Chrome Dev tools because of the Light house functionality that analyzes the page load and scores the website on desktop and mobile experience.
A de minimis incentive was given to thank the reviewer for their time. The incentive was not used to bias or drive a particular response, nor was the incentive contingent on a positive endorsement. More Info
One such product that my team eagerly anticipates testing for responsiveness is the LT Browser. The team has discovered that it is a straightforward process to test on the newest mobile devices utilizing the LT Browser. We may start testing our web pages on local systems by simply adding the URL. LT Browser's native developer tools enable us to make modifications to our code right away. It has a pre-installed selection of well-known devices and can operate in simulated mode.
One major positive impact that using Chrome DevTools has on business is the ability to test your page on multiple devices, screen sizes, and user agents. You can do a lot of QA testing from chrome and that saves time.
Since DevTools is a free product that comes bundled within another free product I don't see any negative impact that derives from its use.
A de minimis incentive was given to thank the reviewer for their time. The incentive was not used to bias or drive a particular response, nor was the incentive contingent on a positive endorsement. More Info