Overview
ProductRatingMost Used ByProduct SummaryStarting Price
Chartbeat
Score 6.9 out of 10
N/A
Chartbeat delivers real-time analytics, insights, and transformative tools for content teams around the world, to help improve audience engagement, inform editorial decisions, and increase loyalty.N/A
ReportGarden
Score 8.0 out of 10
Mid-Size Companies (51-1,000 employees)
ReportGarden is a reporting and dashboarding product for enterprise ad agencies. According to the vendor, Reportgarden provides a full spectrum of marketing tools that seamlessly integrate with the workflow of an agency. 1000+ agencies use ReportGarden to automate the most time consuming tasks like Client Reporting, Data Dashboards, SEO Keyword tracking, PPC Account Health Monitoring etc. ReportGarden offers Dashboards, CRM, Project Management Tools, Analytics, SEO, Budget Tracking and…
$49
per month
Pricing
ChartbeatReportGarden
Editions & Modules
No answers on this topic
Basic
$49
per month
Pro
$89
per month
Agency
$169
per month
Enterprise
$389
per month
Offerings
Pricing Offerings
ChartbeatReportGarden
Free Trial
YesYes
Free/Freemium Version
NoNo
Premium Consulting/Integration Services
NoNo
Entry-level Setup FeeNo setup feeOptional
Additional DetailsChartbeat pricing is based on monthly site page views. Discounts are applied to multi-year contracts. The Basic Plan includes the Real-time Dashboard, Historical Dashboard, Heads Up Display, Reports, Big Board, iOS and Android app, and Real-time API endpoints. The Plus Plan includes all of the Basic Plan features, plus ONE of the following Premium features: Headline Testing, Advanced Queries, or Multi-Site View. The Premium Plan includes all of the Basic Plan features, plus ALL Premium features: Headline Testing, Advanced Queries, Multi-Site View, and enterprise-level support and custom trainings.
More Pricing Information
Community Pulse
ChartbeatReportGarden
Features
ChartbeatReportGarden
Web Analytics
Comparison of Web Analytics features of Product A and Product B
Chartbeat
7.4
Ratings
8% below category average
ReportGarden
-
Ratings
Lead Conversion Tracking6.10 Ratings00 Ratings
Bounce Rate Measurement6.80 Ratings00 Ratings
Device and Browser Reporting7.00 Ratings00 Ratings
Pageview Tracking7.90 Ratings00 Ratings
Event Tracking7.00 Ratings00 Ratings
Reporting in real-time9.10 Ratings00 Ratings
Referral Source Tracking8.00 Ratings00 Ratings
Customizable Dashboards7.60 Ratings00 Ratings
Best Alternatives
ChartbeatReportGarden
Small Businesses
StatCounter
StatCounter
Score 9.0 out of 10
Agency Analytics
Agency Analytics
Score 9.9 out of 10
Medium-sized Companies
Siteimprove
Siteimprove
Score 10.0 out of 10
Supermetrics
Supermetrics
Score 10.0 out of 10
Enterprises
Optimal
Optimal
Score 9.0 out of 10
Alteryx Platform
Alteryx Platform
Score 8.9 out of 10
All AlternativesView all alternativesView all alternatives
User Ratings
ChartbeatReportGarden
Likelihood to Recommend
8.6
(0 ratings)
8.0
(0 ratings)
Likelihood to Renew
9.9
(0 ratings)
-
(0 ratings)
Usability
7.9
(0 ratings)
-
(0 ratings)
Support Rating
8.1
(0 ratings)
-
(0 ratings)
User Testimonials
ChartbeatReportGarden
Likelihood to Recommend
It is well suited to keeping me toward a specified goal, and gives me concrete numbers and gives me an idea of what we need to do to meet our goals. It's less appropriate if you want something more than pageviews, and doesn't really do a lot for video views.
Read full review
ReportGarden has been fantastic for us, as a smaller agency, when we need an affordable tool for multiple, smaller clients who are on many different platforms and need to report on all of our metrics, across all tactics, for a holistic picture. ReportGarden has also been easy-to-use for our newer employees, with its simplified platform layout and tools.
Read full review
Pros
  • Provides easy at-a-glance look at what people are reading right now
  • Heads-up Display allows you to make sure the homepage is showing the content people want to read
  • Headline testing tool provides fascinating insight into what makes people read a story and improves headline-writing ability
Read full review
  • Reporting for Google Analytics, Adwords, Facebook Ads, and other ad channels.
  • Provides you with a dashboard for clients to login to their own accounts.
  • Automated reporting set to schedules with manageable report templates.
Read full review
Cons
  • Source of traffic needs improvement. Search and social make sense, but "internal" and "links" is a grey area. It would be helpful to define those with an organization and provide an information icon so users can easily remember what each of those buckets is tracking.
  • More ways to customize the real-time board. For example, with video content, that's great that I can see a user has started a video, but what is the completion rate, was that only on O&O or can that track Facebook, too?
  • Would like to see demo (age) information included as a way to slice the data so I can see what's working with my older and younger demo.
Read full review
  • ReportGarden is sometimes too simplistic, and doesn't allow you to get down into the details as much as you might need to for more sophisticated clients.
  • Sometimes we've had issues with getting all of our separate platforms/campaigns to work together in reporting.
  • It would be great if there were different levels to ReportGarden that would allow for more sophisticated agencies to buy into higher-level, more detailed reporting tools.
Read full review
Likelihood to Renew
I gave Chartbeat a 5 for a renewal rating, because, while it delivers clear and understandable content, Google Analytics also provides many of the same features for free. For a small to medium website, I believe it would be more cost effective to use Google Analytics. A website with a high amount of traffic, however, could merit spending the money on Chartbeat to maximize their potential.
Read full review
No answers on this topic
Usability
Chartbeat is really pretty straightforward. The only things that may cause confusion are the string of sidebar features and tools at the left of the screen. I mostly use the big leader board in real-time and the historical feature (looking at the monthly or weekly performance of my team's content) and then generate reports automatically from there.
Read full review
No answers on this topic
Support Rating
I have had limited experience of support for Chartbeat but whenever I have needed help it has been there. Recently there was an issue of seeing different forms of data in real time - app and otherwise effectively, and the issue was being clearly dealt with and communicated back to us.
Read full review
No answers on this topic
Alternatives Considered
Google Analytics has gradually become much more difficult to use, and much slower in its realtime reporting. It was the changes that came in with Google Analytics 4 that gave us the final push to work with Chartbeat - a product some of us were already familiar with from previous jobs. Things are just much harder to find in GA, and when time is always tight you can't afford to spend a long time looking for particular data - it should be quick and easy to locate
Read full review
Kissmetrics offers a great product, but it can also be painfully expensive. We love the product they're able to provide, but when it came to overhead costs, it didn't make sense for us. ReportGarden is far less expensive and seems to deliver more value, so the decision to go with them was pretty easy. We've upgraded tiers to accommodate more clients a few times and still pay less than Kissmetrics' bottom tier.
Read full review
Return on Investment
  • It has helped us save time in report generation and performance analysis.
  • By helping us evaluate our contributors, we're able to get our money's worth.
  • Seeing our numbers on the Big Board fosters healthy competition among brands, motivating us to distribute our stories better.
Read full review
  • Saved hours because we used to do manual reporting.
Read full review
ScreenShots

Chartbeat Screenshots

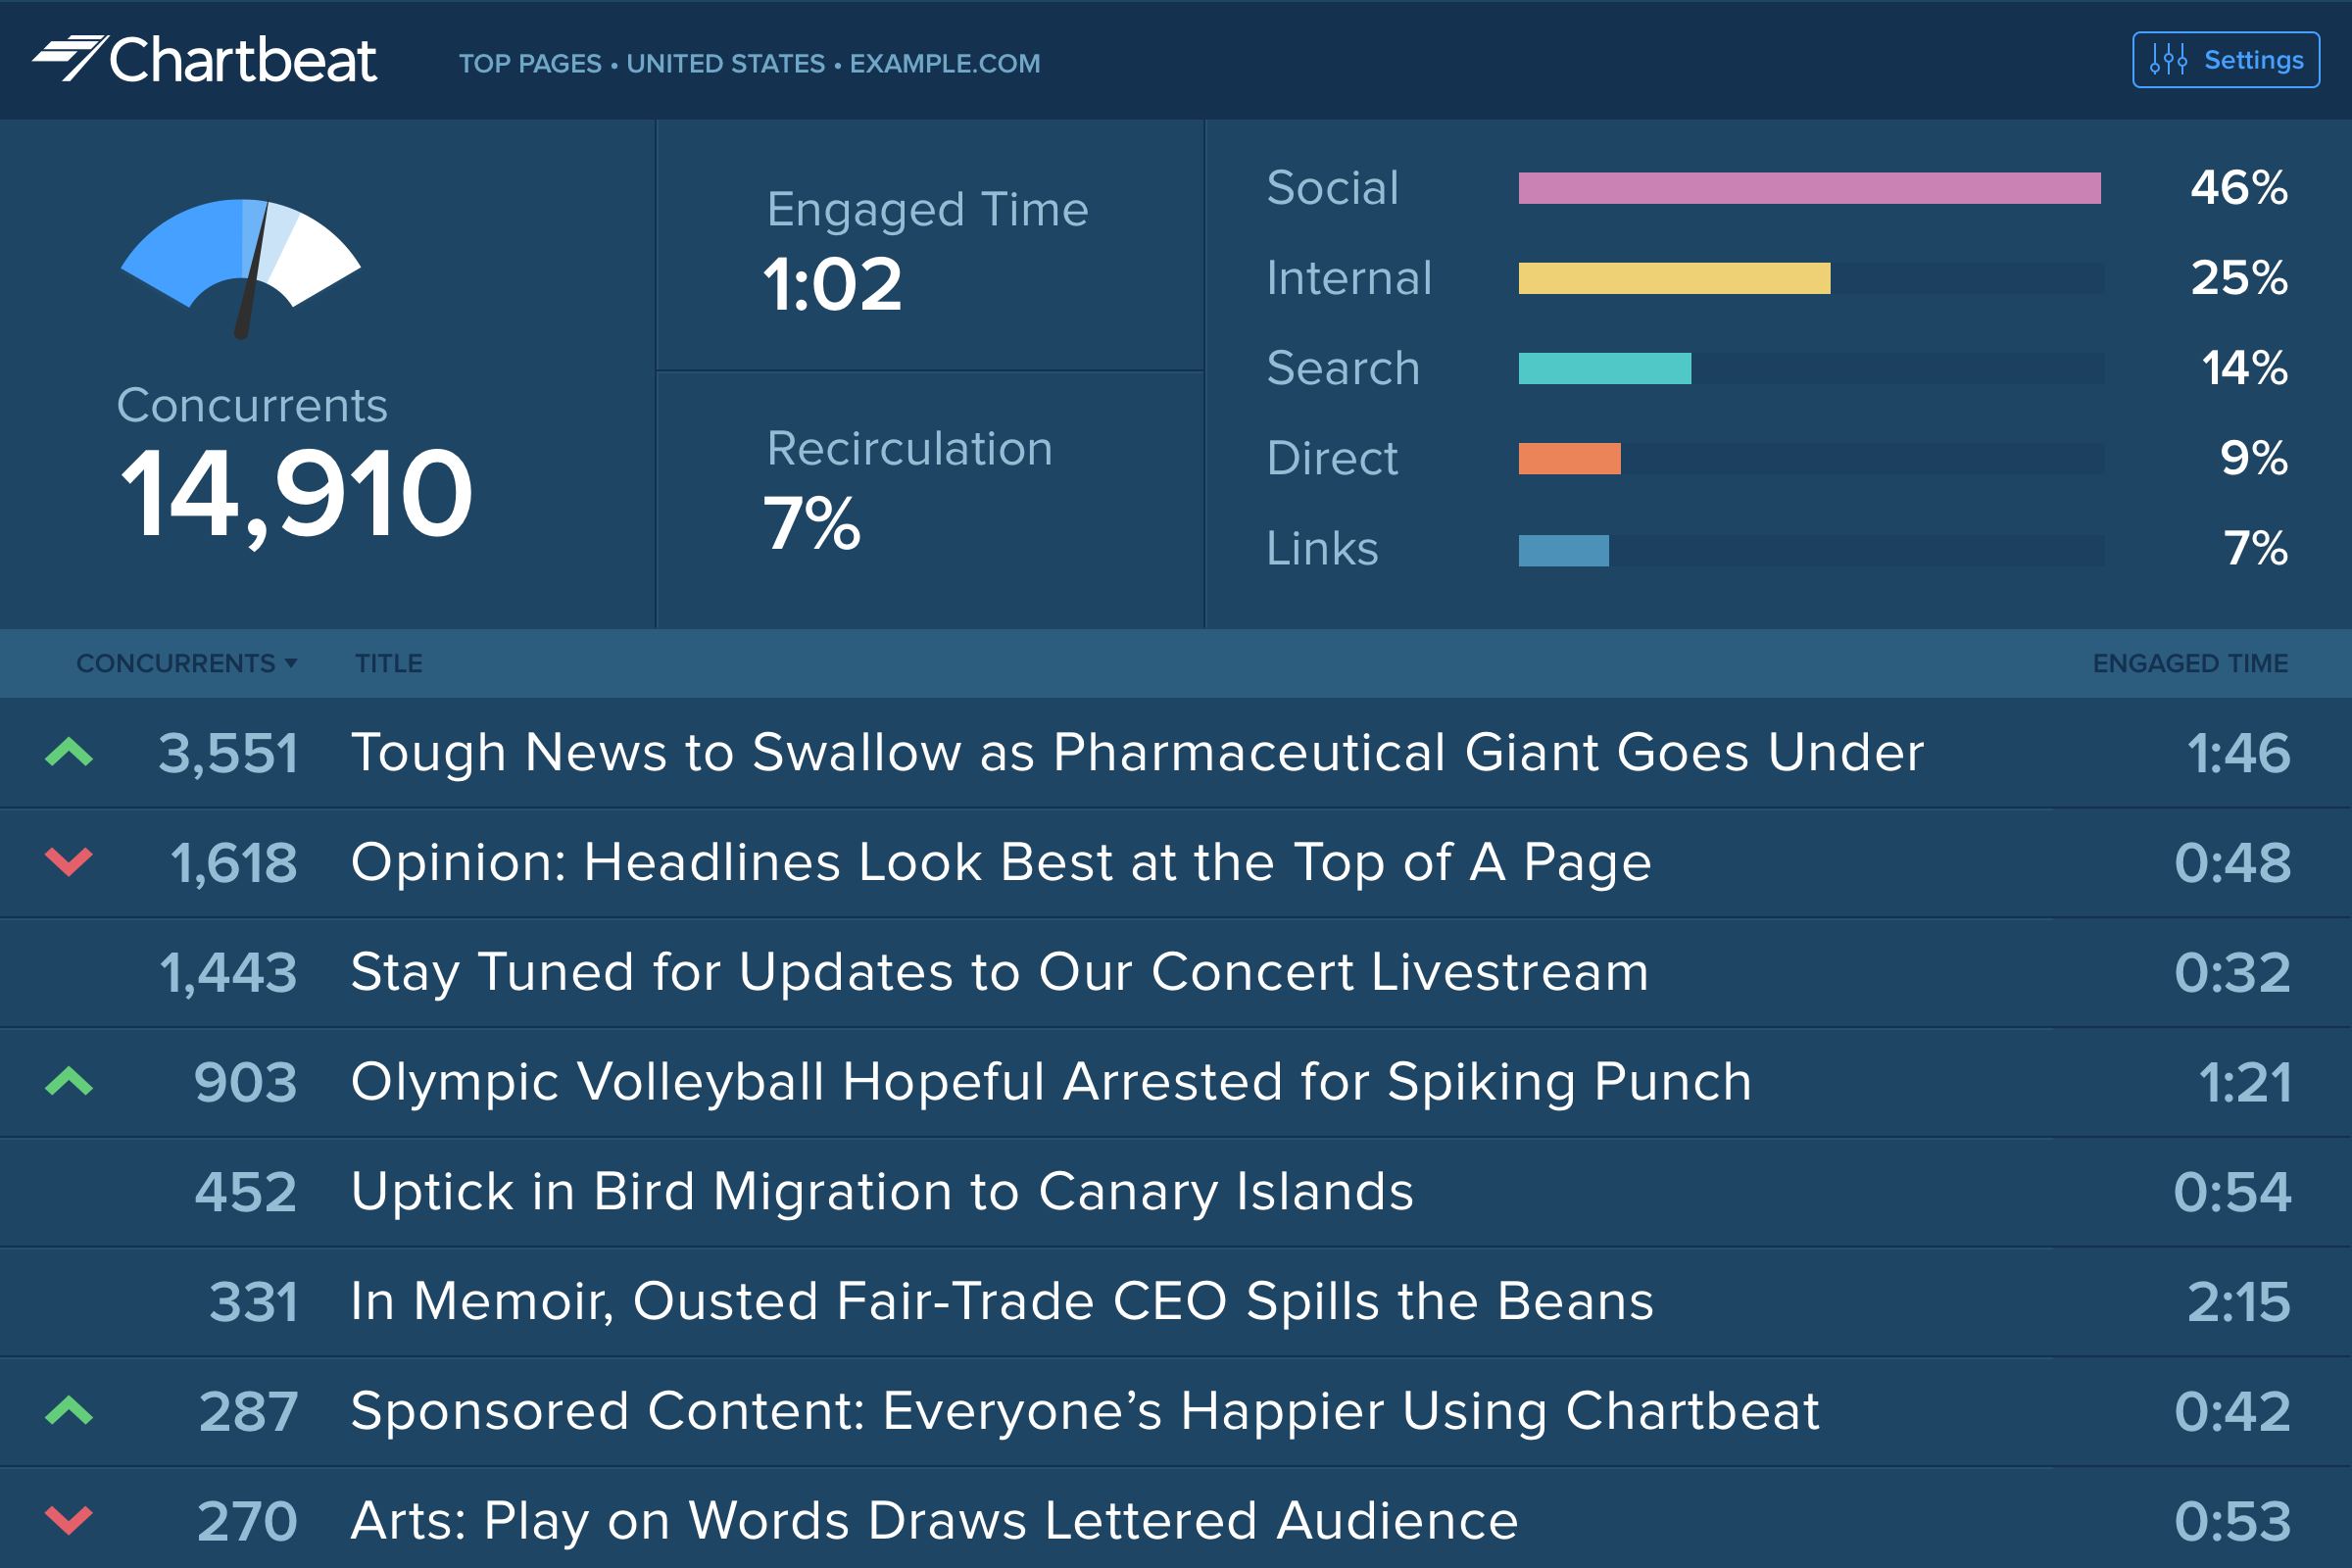
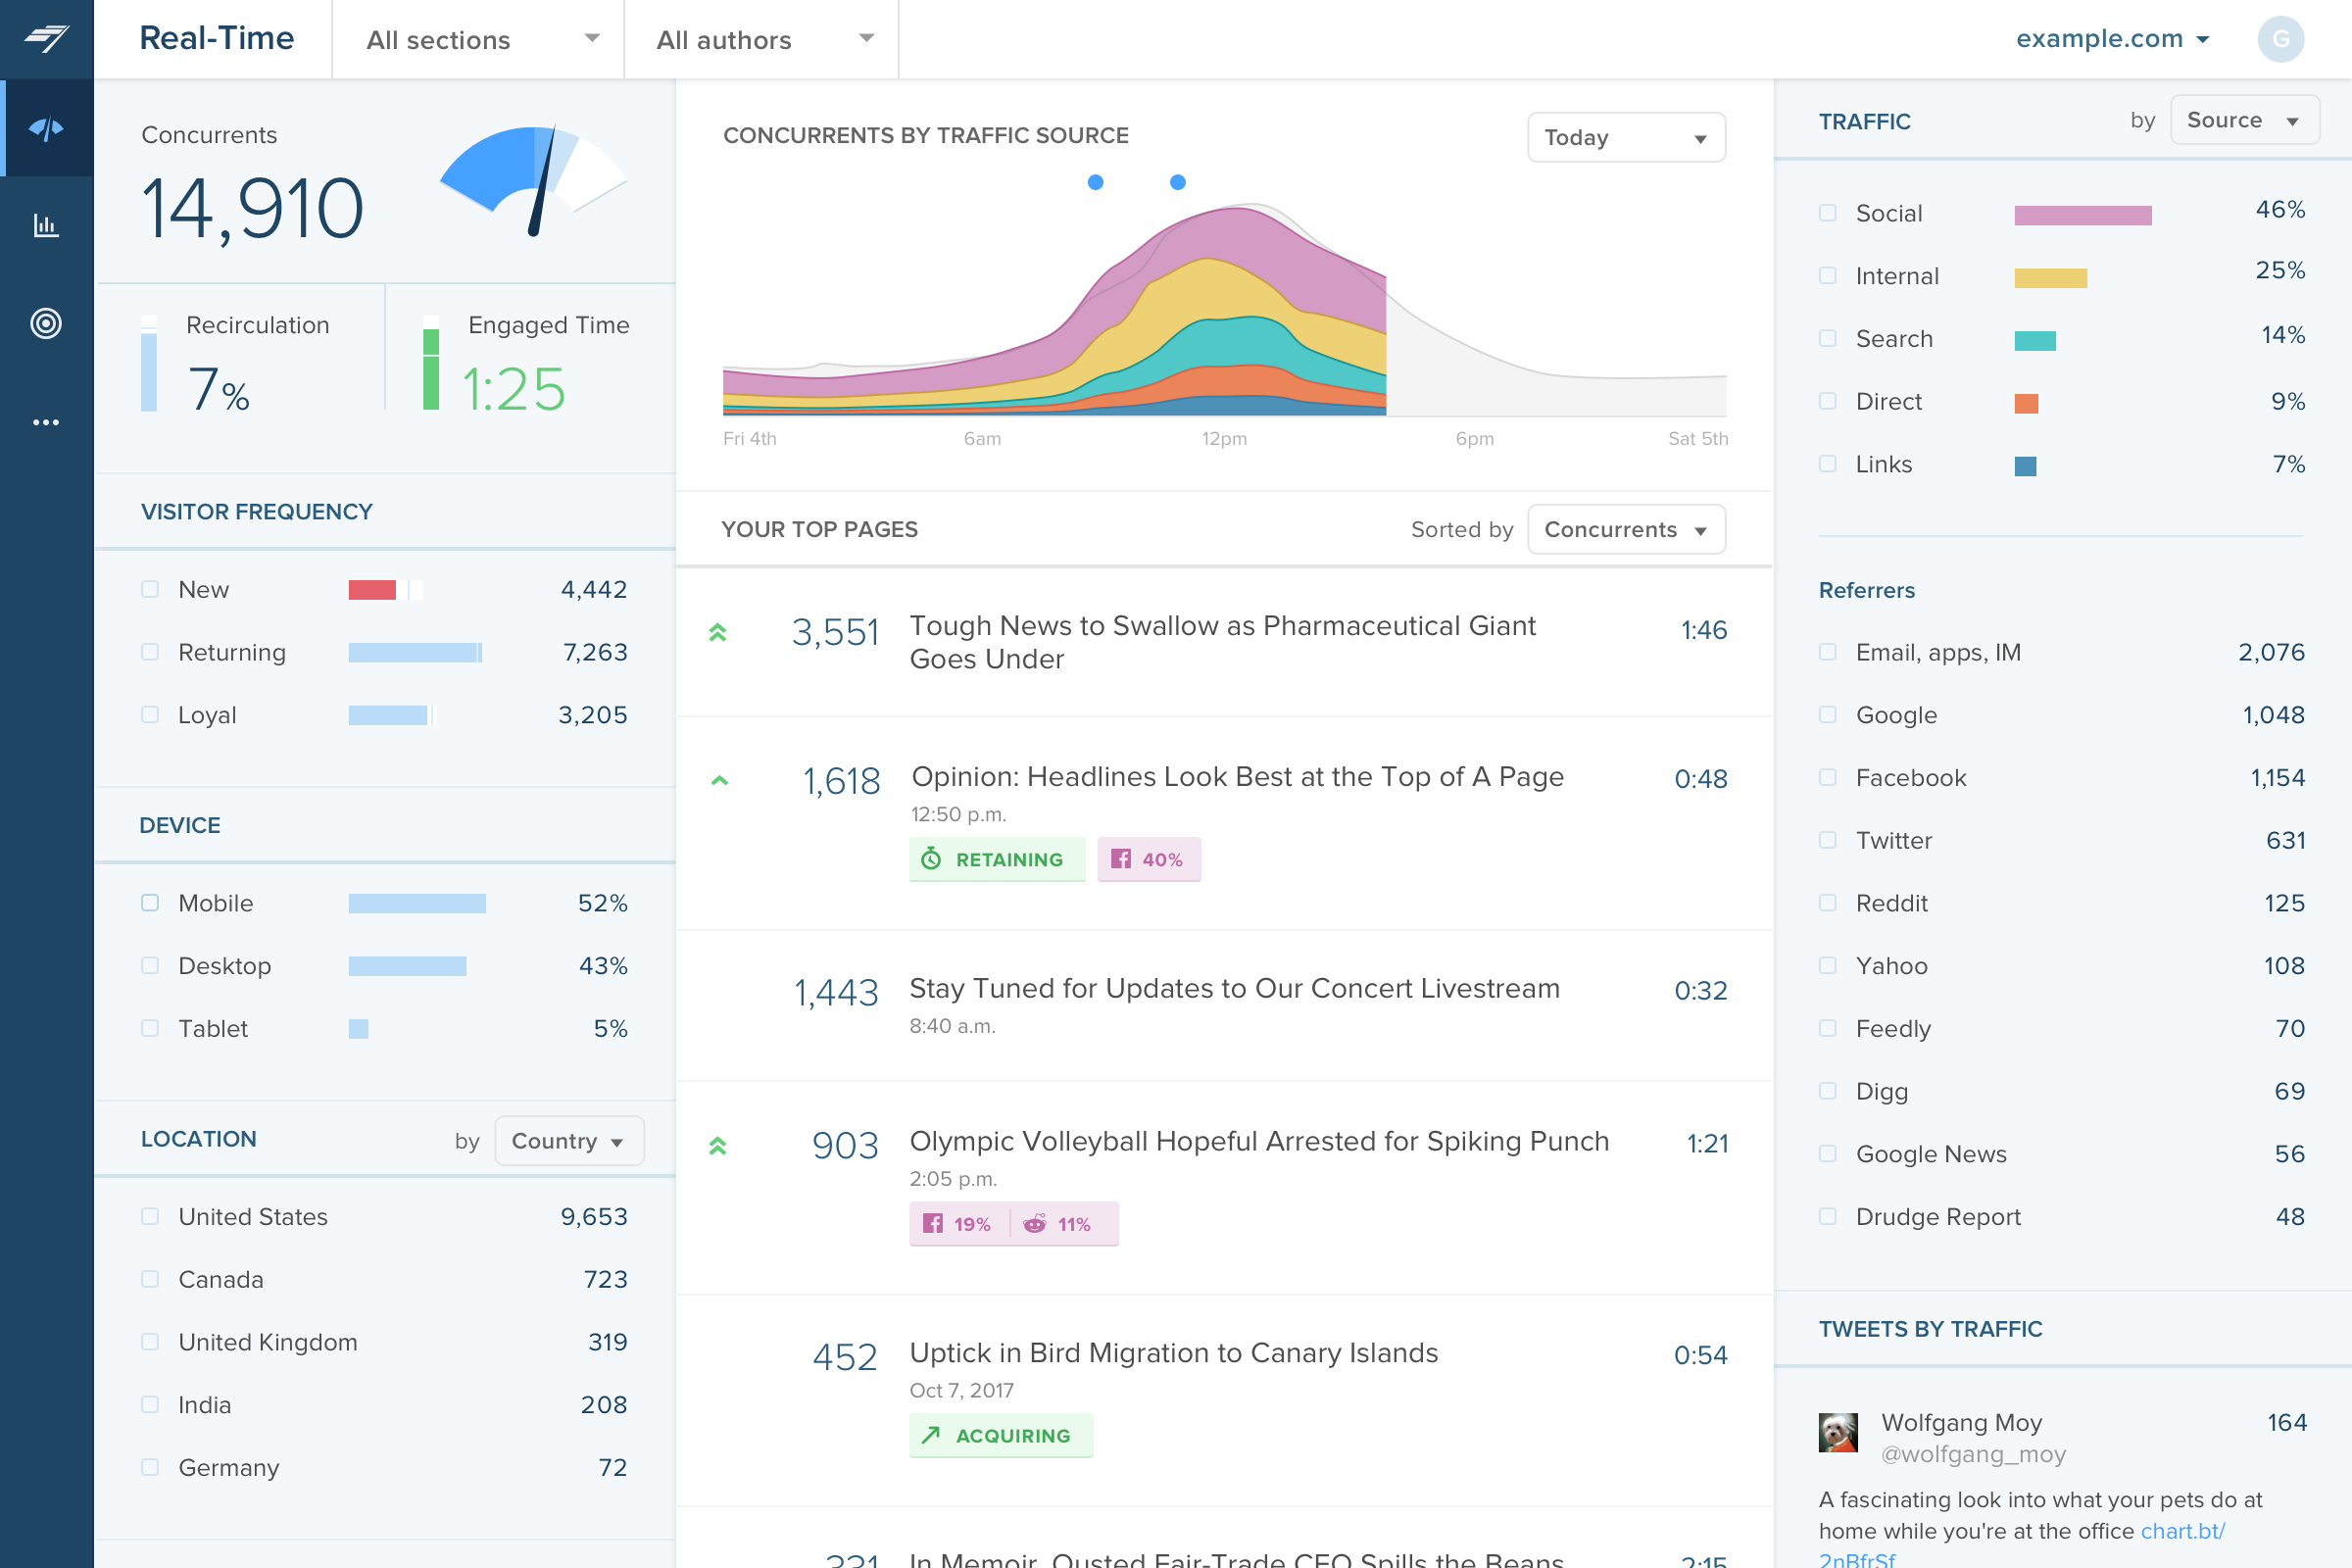
Screenshot of Big Board: For newsrooms, the leaderboard-style visualization shows the top stories on the biggest screen.Screenshot of Real-time dashboard: Displays how an audience is connecting with content in the moment – across platforms, channels, and devices.Screenshot of Historical Dashboard: To assess content performance, KPIs, and valuable trends over the long term.Screenshot of Heads Up Display: Shows which homepage articles are the top performers, how stories are trending up or down in traffic, and how far visitors are scrolling down the page.Screenshot of Video Dashboard: Reveals how video content captures viewer attention.Screenshot of Conversion Dashboard: Tracks conversion metrics and insights.

ReportGarden Screenshots

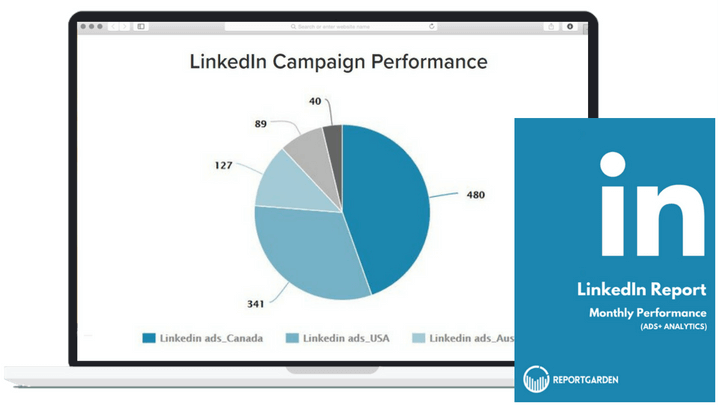
Screenshot of Custom DashboardsScreenshot of AdWords Reporting ToolScreenshot of PPC Reporting ToolScreenshot of Facebook Reporting ToolScreenshot of Twitter Reporting ToolScreenshot of LinkedIn Analytics Reports