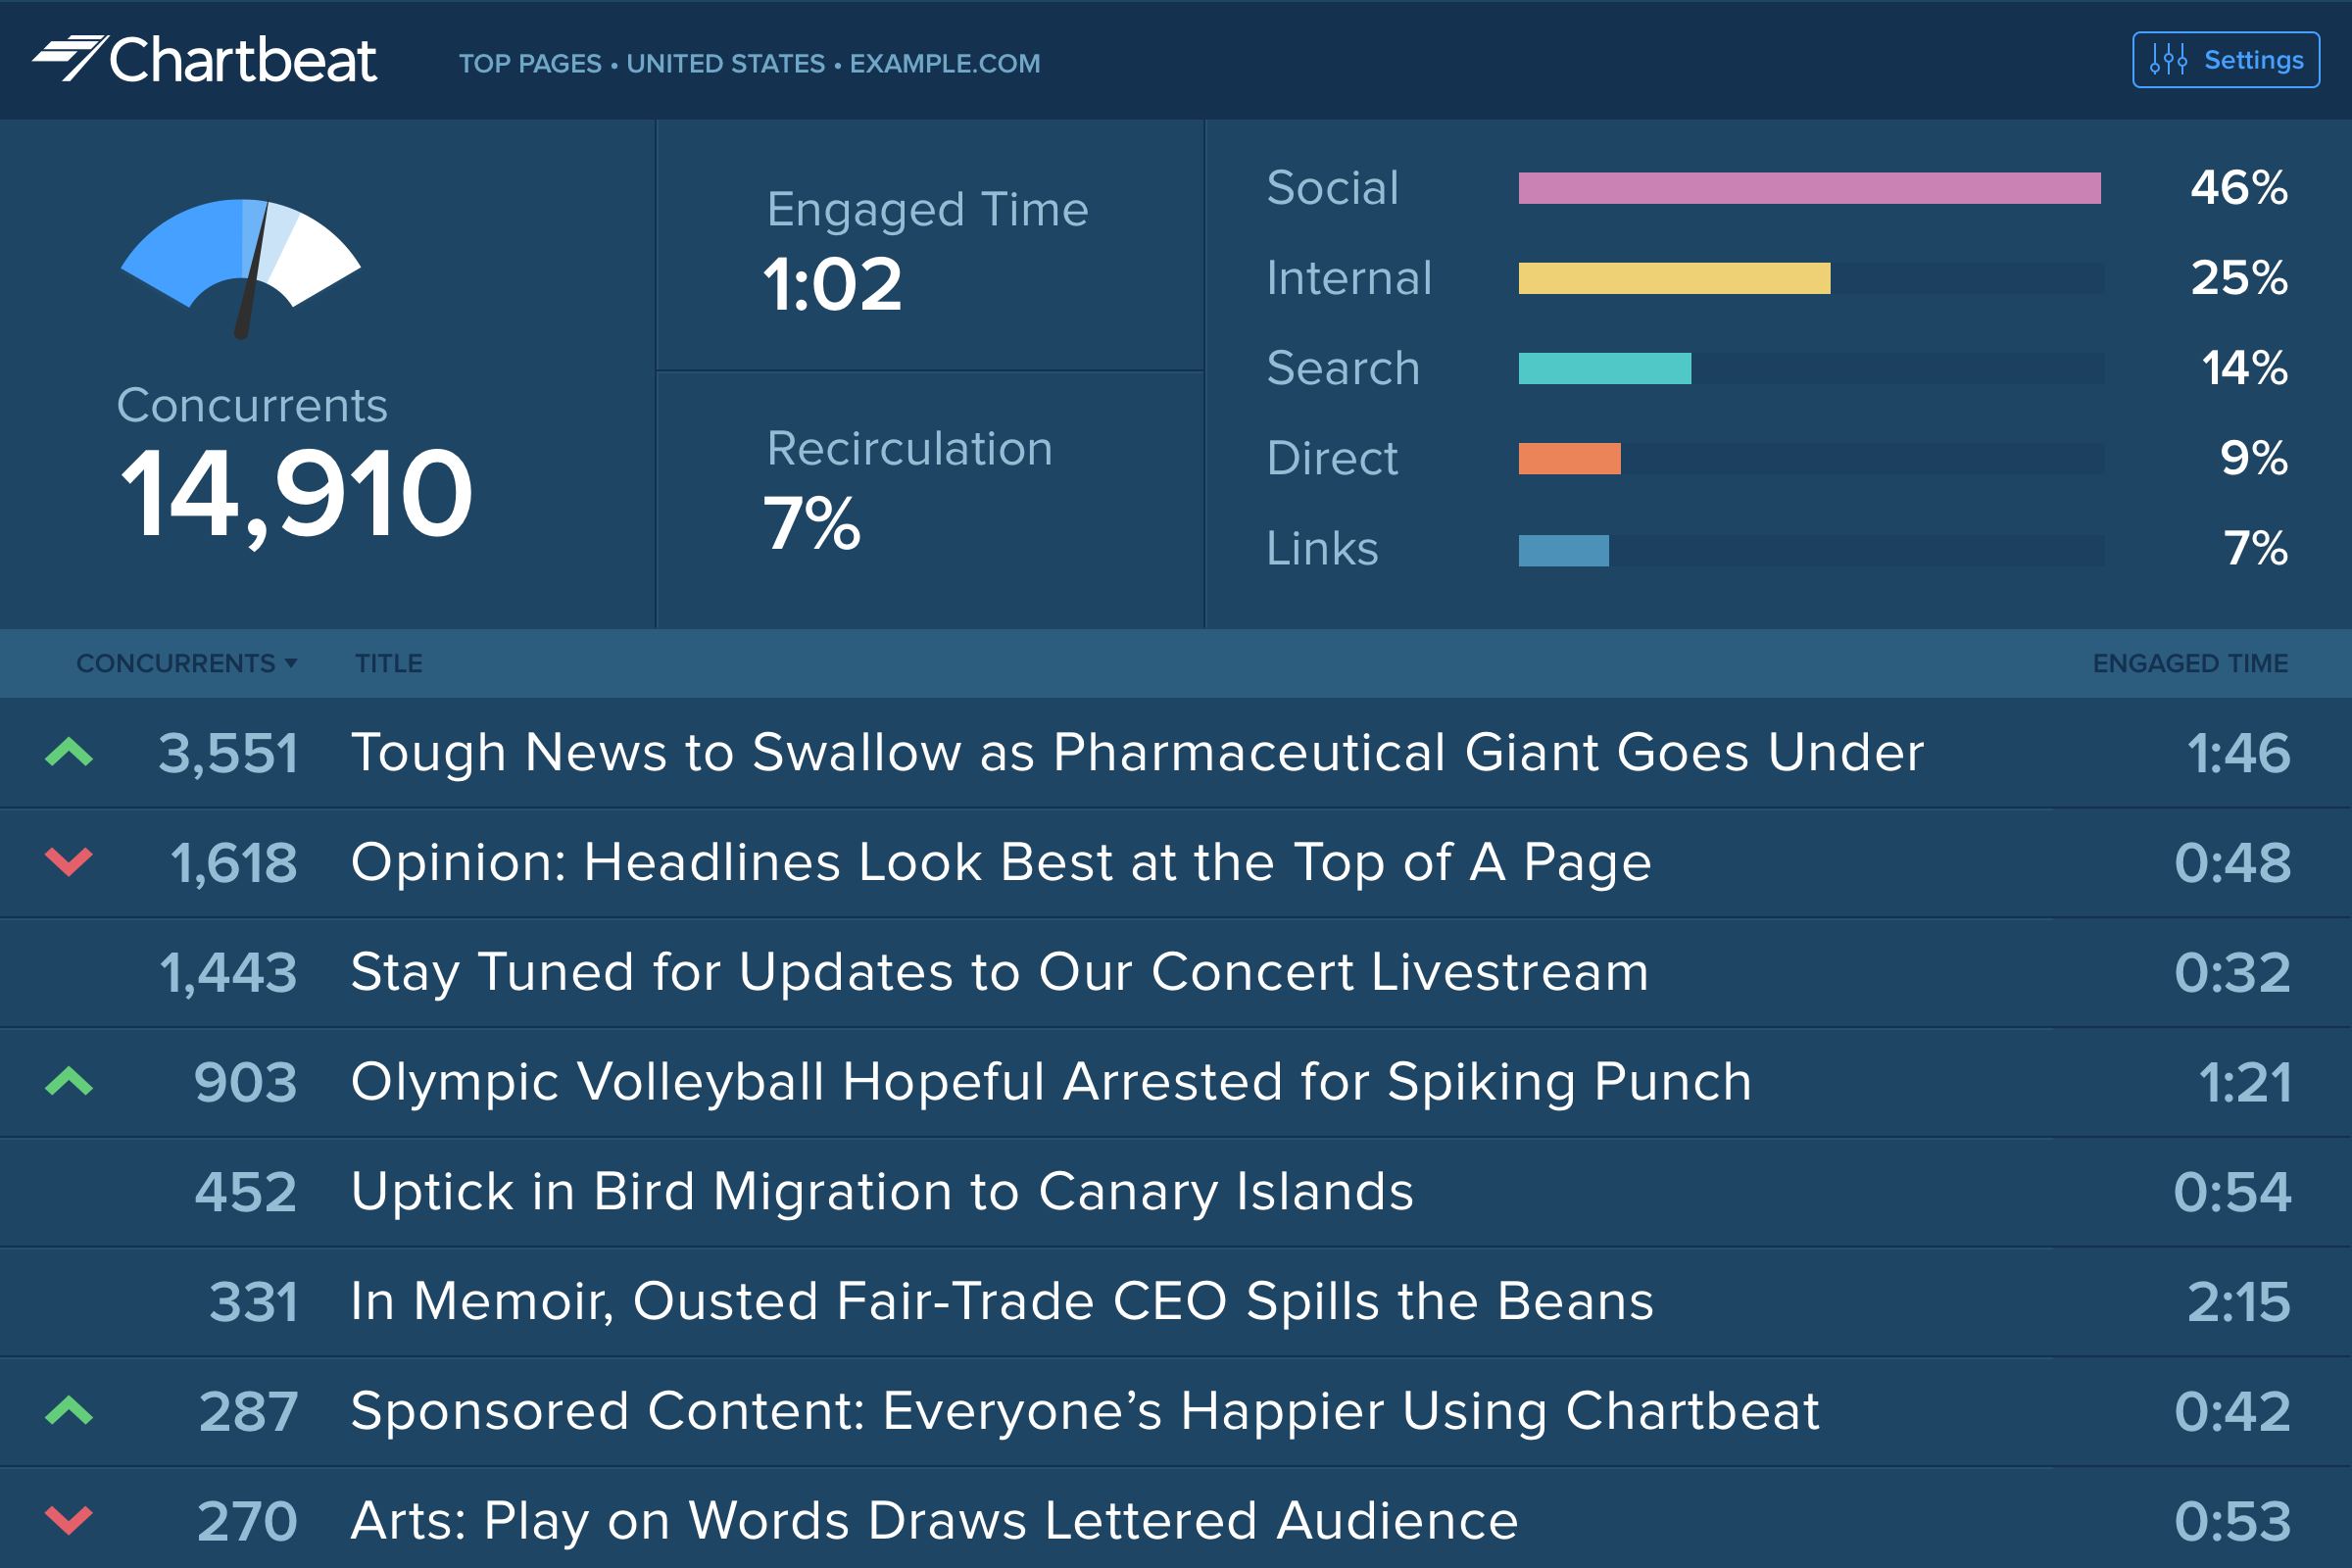
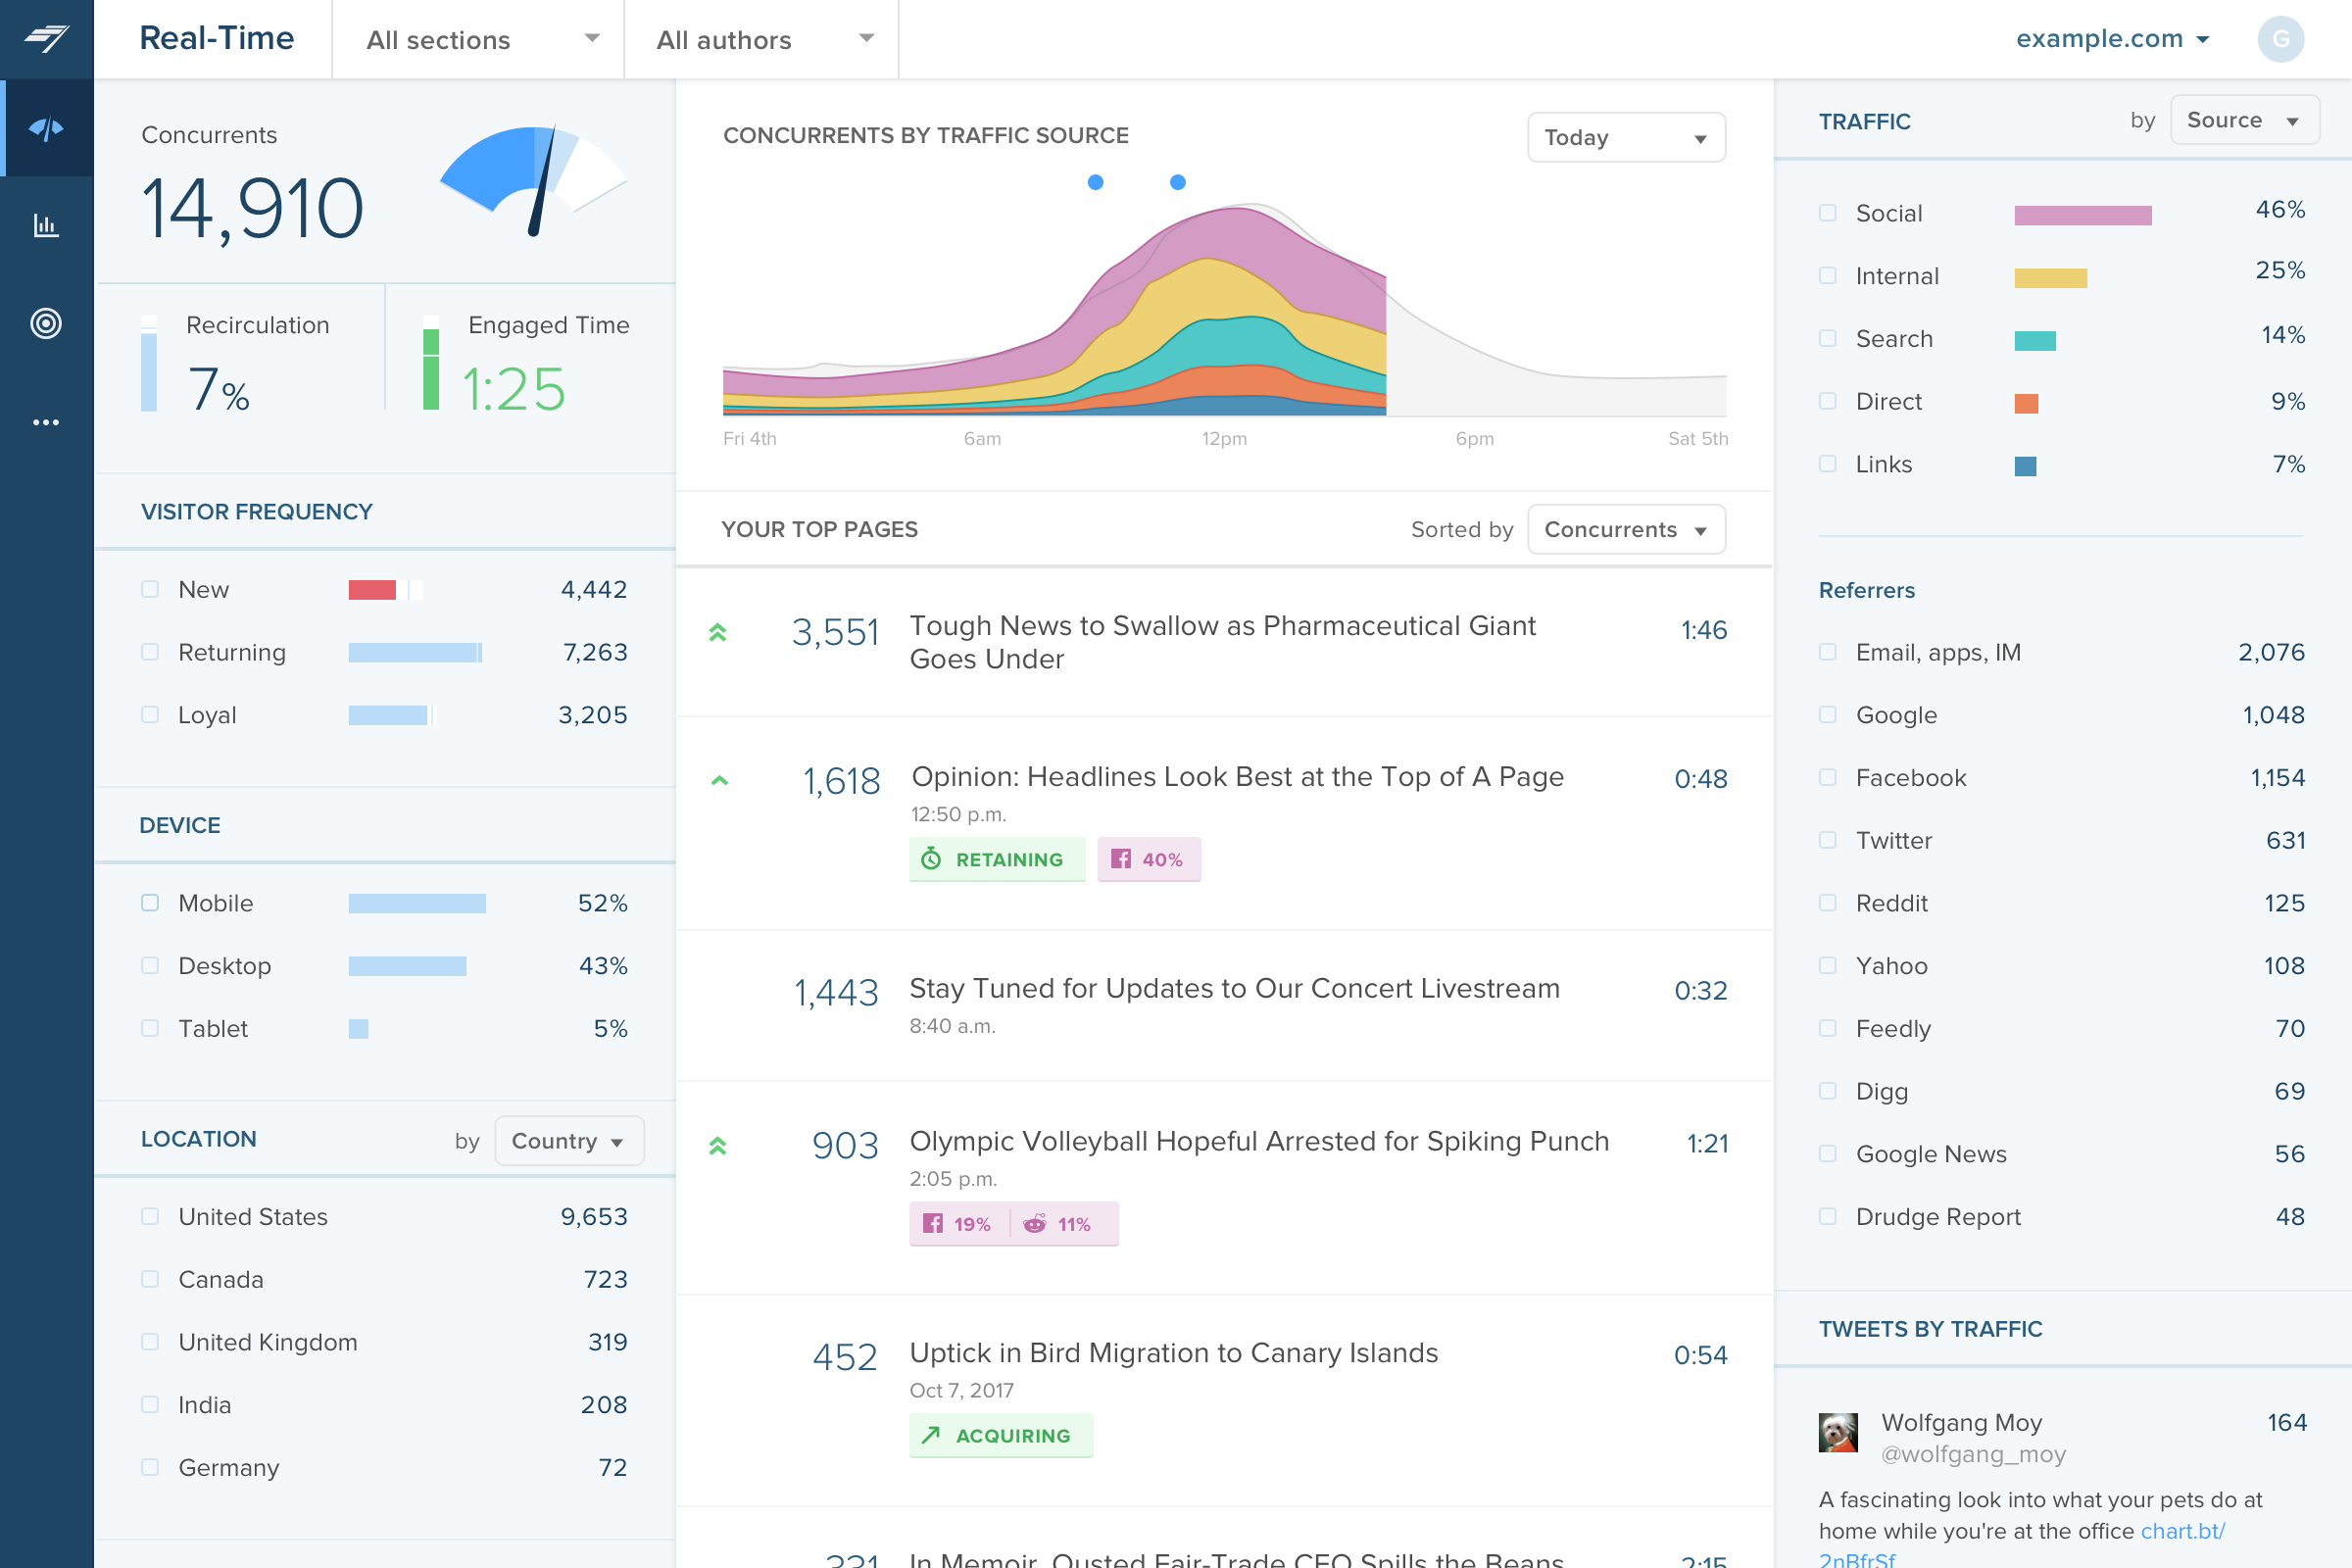
Chartbeat delivers real-time analytics, insights, and transformative tools for content teams around the world, to help improve audience engagement, inform editorial decisions, and increase loyalty.
N/A
Optimizely Web Experimentation
Score8.7 out of 10
N/A
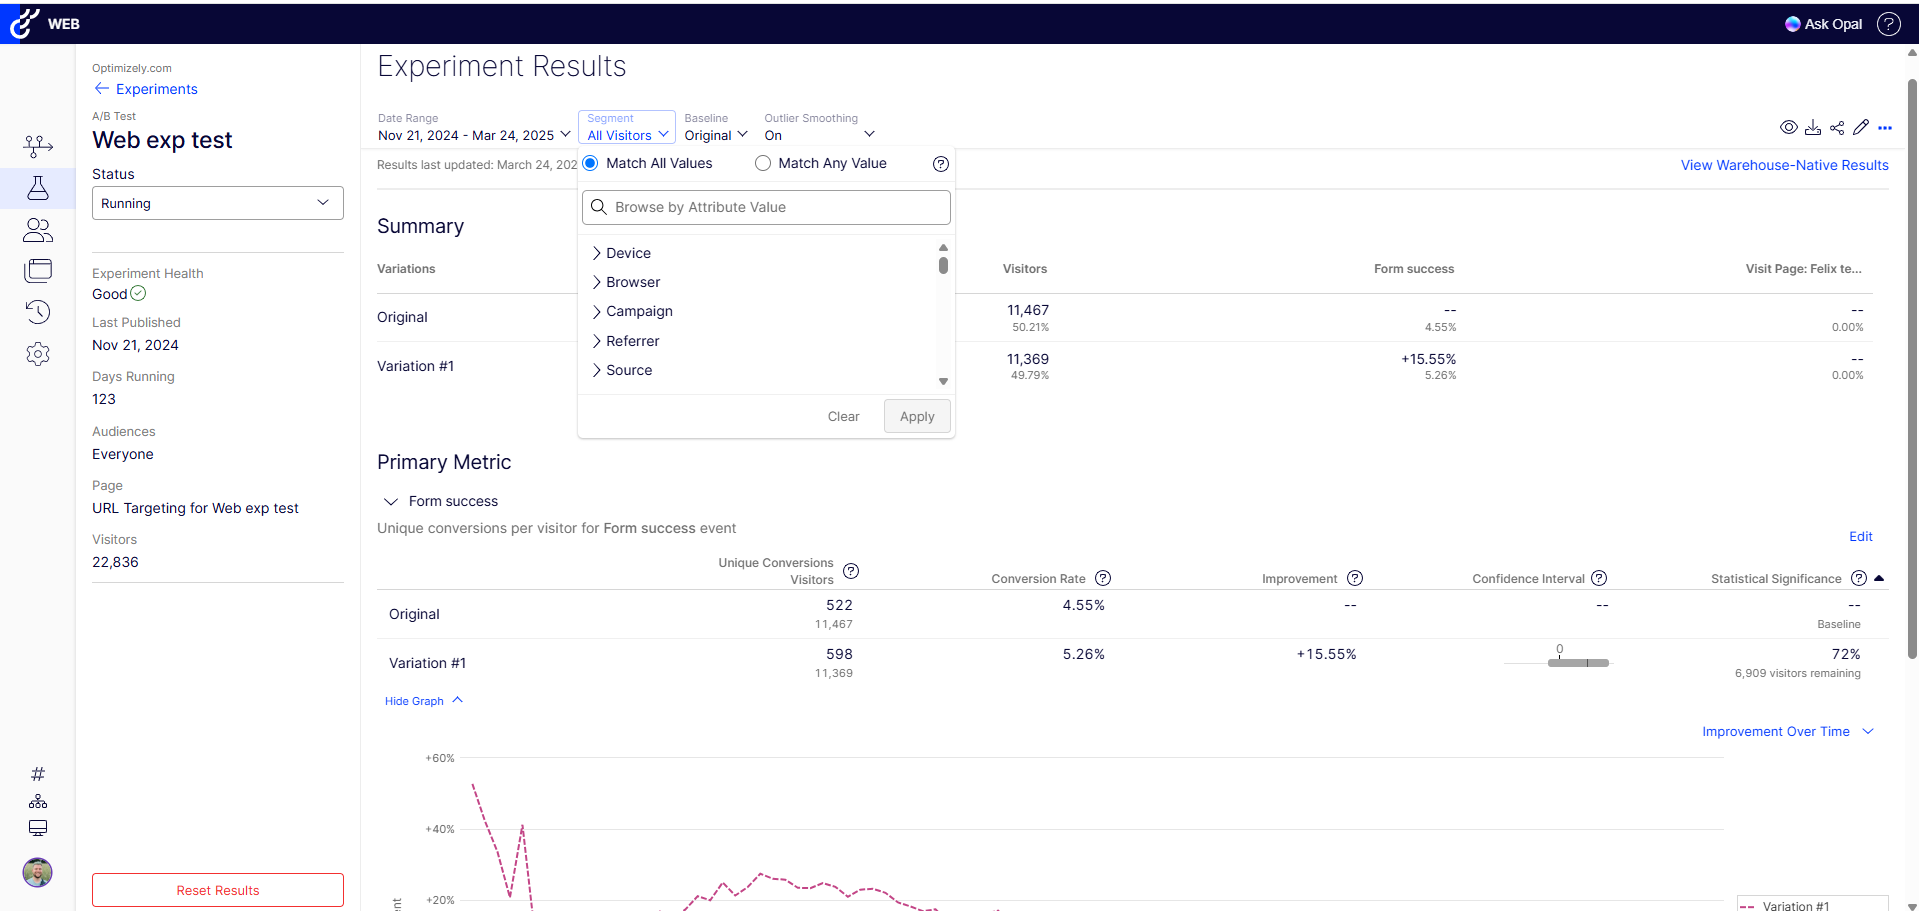
Whether launching a first test or scaling a sophisticated experimentation program, Optimizely Web Experimentation aims to deliver the insights needed to craft high-performing digital experiences that drive engagement, increase conversions, and accelerate growth.
N/A
Pricing
Chartbeat
Optimizely Web Experimentation
Editions & Modules
No answers on this topic
No answers on this topic
Offerings
Pricing Offerings
Chartbeat
Optimizely Web Experimentation
Free Trial
Yes
Yes
Free/Freemium Version
No
No
Premium Consulting/Integration Services
Yes
Yes
Entry-level Setup Fee
No setup fee
Optional
Additional Details
Chartbeat pricing is based on monthly site page views. Discounts are applied to multi-year contracts. The Basic Plan includes the Real-time Dashboard, Historical Dashboard, Heads Up Display, Reports, Big Board, iOS and Android app, and Real-time API endpoints.
The Plus Plan includes all of the Basic Plan features, plus ONE of the following Premium features: Headline Testing, Advanced Queries, or Multi-Site View.
The Premium Plan includes all of the Basic Plan features, plus ALL Premium features: Headline Testing, Advanced Queries, Multi-Site View, and enterprise-level support and custom trainings.
The main point of benefit is the realtime data. This is vital to our team as we are publishing a lot of content per day, so we have a busy homepage to manage and it's important to know which content is performing well. We also like to get an understanding as quickly as possible - which Chartbeat offers - of where traffic is coming from. Often we will see an example where a page is getting high traffic from Google, for example, and we know that might not need to be placed so prominently on the homepage because the traffic is arriving to us externally anyway. Without that depth of understanding what is performing best and why - updated immediately, unlike in Google Analytics now - our homepage would not be as well optimised for users coming to us direct
A de minimis incentive was given to thank the reviewer for their time. The incentive was not used to bias or drive a particular response, nor was the incentive contingent on a positive endorsement. More Info
I think it can serve the whole spectrum of experiences from people who are just getting used to web experimentation. It's really easy to pick up and use. If you're more experienced then it works well because it just gets out of the way and lets you really focus on the experimentation side of things. So yeah, strongly recommend. I think it is well suited both to small businesses and large enterprises as well. I think it's got a really low barrier to entry. It's very easy to integrate on your website and get results quickly. Likewise, if you are a big business, it's incrementally adoptable, so you can start out with one component of optimizing and you can build there and start to build in things like data CMS to augment experimentation as well. So it's got a really strong a pathway to grow your MarTech platform if you're a small company or a big company.
A de minimis incentive was given to thank the reviewer for their time. The incentive was not used to bias or drive a particular response, nor was the incentive contingent on a positive endorsement. More Info
The Platform contains drag-and-drop editor options for creating variations, which ease the A/B tests process, as it does not require any coding or development resources.
Establishing it is so simple that even a non-technical person can do it perfectly.
It provides real-time results and analytics with robust dashboard access through which you can quickly analyze how different variations perform. With this, your team can easily make data-driven decisions Fastly.
A de minimis incentive was given to thank the reviewer for their time. The incentive was not used to bias or drive a particular response, nor was the incentive contingent on a positive endorsement. TR verified that a representative sample of customers was invited. More Info
Source of traffic needs improvement. Search and social make sense, but "internal" and "links" is a grey area. It would be helpful to define those with an organization and provide an information icon so users can easily remember what each of those buckets is tracking.
More ways to customize the real-time board. For example, with video content, that's great that I can see a user has started a video, but what is the completion rate, was that only on O&O or can that track Facebook, too?
Would like to see demo (age) information included as a way to slice the data so I can see what's working with my older and younger demo.
A de minimis incentive was given to thank the reviewer for their time. The incentive was not used to bias or drive a particular response, nor was the incentive contingent on a positive endorsement. TR verified that a representative sample of customers was invited. More Info
A de minimis incentive was given to thank the reviewer for their time. The incentive was not used to bias or drive a particular response, nor was the incentive contingent on a positive endorsement. More Info
I gave Chartbeat a 5 for a renewal rating, because, while it delivers clear and understandable content, Google Analytics also provides many of the same features for free. For a small to medium website, I believe it would be more cost effective to use Google Analytics. A website with a high amount of traffic, however, could merit spending the money on Chartbeat to maximize their potential.
I rated this question because at this stage, Optimizely does most everything we need so I don't foresee a need to migrate to a new tool. We have the infrastructure already in place and it is a sizeable lift to pivot to another tool with no guarantee that it will work as good or even better than Optimizely
A de minimis incentive was given to thank the reviewer for their time. The incentive was not used to bias or drive a particular response, nor was the incentive contingent on a positive endorsement. TR verified that a representative sample of customers was invited. More Info
I am able to "set it and forget it," keeping it up on my monitor for either constant checking or just keeping an eye on the numbers during the day. I'm also able to keep track of what times are perfect to post a story and which stories rack up the most traffic.
A de minimis incentive was given to thank the reviewer for their time. The incentive was not used to bias or drive a particular response, nor was the incentive contingent on a positive endorsement. More Info
Optimizely Web Experimentation's visual editor is handy for non-technical or quick iterative testing. When it comes to content changes it's as easy as going into wordpress, clicking around, and then seeing your changes live--what you see is what you get. The preview and approval process for sharing built experiments is also handy for sharing experiments across teams for QA purposes or otherwise.
A de minimis incentive was given to thank the reviewer for their time. The incentive was not used to bias or drive a particular response, nor was the incentive contingent on a positive endorsement. More Info
I would rate Optimizely Web Experimentation's availability as a 10 out of 10. The software is reliable and does not experience any application errors or unplanned outages. Additionally, the customer service and technical support teams are always available to help with any issues or questions.
A de minimis incentive was given to thank the reviewer for their time. The incentive was not used to bias or drive a particular response, nor was the incentive contingent on a positive endorsement. More Info
I would rate Optimizely Web Experimentation's performance as a 9 out of 10. Pages load quickly, reports are complete in a reasonable time frame, and the software does not slow down any other software or systems that it integrates with. Additionally, the customer service and technical support teams are always available to help with any issues or questions.
A de minimis incentive was given to thank the reviewer for their time. The incentive was not used to bias or drive a particular response, nor was the incentive contingent on a positive endorsement. More Info
I have had limited experience of support for Chartbeat but whenever I have needed help it has been there. Recently there was an issue of seeing different forms of data in real time - app and otherwise effectively, and the issue was being clearly dealt with and communicated back to us.
A de minimis incentive was given to thank the reviewer for their time. The incentive was not used to bias or drive a particular response, nor was the incentive contingent on a positive endorsement. More Info
They always are quick to respond, and are so friendly and helpful. They always answer the phone right away. And [they are] always willing to not only help you with your problem, but if you need ideas they have suggestions as well.
The tool itself is not very difficult to use so training was not very useful in my opinion. It did not also account for success events more complex than a click (which my company being ecommerce is looking to examine more than a mere click).
In retrospect: - I think I should have stressed more demo's / workshopping with the Optimizely team at the start. I felt too confident during demo stages, and when came time to actually start, I was a bit lost. (The answer is likely I should have had them on-hand for our first install.. they offered but I thought I was OK.) - Really getting an understanding / asking them prior to install of how to make it really work for checkout pages / one that uses dynamic content or user interaction to determine what the UI does. Could have saved some time by addressing this at the beginning, as some things we needed to create on our site for Optimizely to "use" as a trigger for the variation test. - Having a number of planned/hoped-for tests already in-hand before working with Optimizely team. Sharing those thoughts with them would likely have started conversations on additional things we needed to do to make them work (rather than figuring that out during the actual builds). Since I had development time available, I could have added more things to the baseline installation since my developers were already "looking under the hood" of the site.
Omnilytics is more robust, detailed, and catered for an intermediate media user, while I think Chartbeat is a more user-friendly and beginner-oriented piece of technology. That being said, there is an impressive amount of lift for Chartbeat, and it's evident that simplicity is the key to using a software daily (which is absolutely the point in the content world).
A de minimis incentive was given to thank the reviewer for their time. The incentive was not used to bias or drive a particular response, nor was the incentive contingent on a positive endorsement. More Info
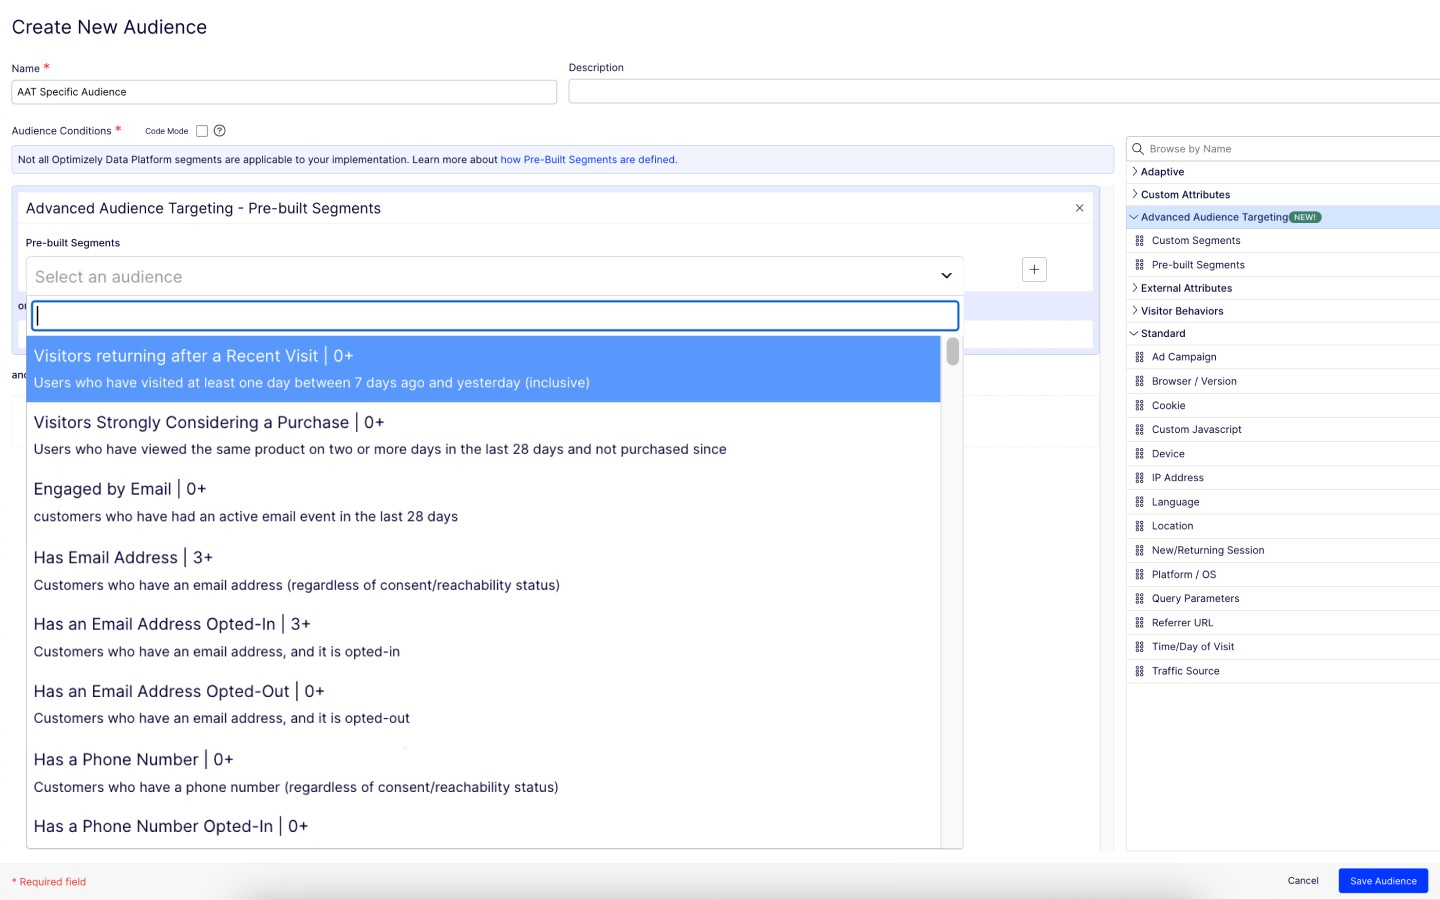
The ability to do A/B testing in Optimizely along with the associated statistical modelling and audience segmentation means it is a much better solution than using something like Google Analytics were a lot more effort is required to identify and isolate the specific data you need to confidently make changes
A de minimis incentive was given to thank the reviewer for their time. The incentive was not used to bias or drive a particular response, nor was the incentive contingent on a positive endorsement. More Info
We can use it flexibly across lines of business and have it in use across two departments. We have different use cases and slightly different outcomes, but can unify our results based on impact to the bottom line. Finally, we can generate value from anywhere in the org for any stakeholders as needed.
A de minimis incentive was given to thank the reviewer for their time. The incentive was not used to bias or drive a particular response, nor was the incentive contingent on a positive endorsement. TR verified that a representative sample of customers was invited. More Info
A de minimis incentive was given to thank the reviewer for their time. The incentive was not used to bias or drive a particular response, nor was the incentive contingent on a positive endorsement. More Info
We're able to share definitive annualized revenue projections with our team, showing what would happen if we put a test into Production
Showing the results of a test on a new page or feature prior to full implementation on a site saves developer time (if a test proves the new element doesn't deliver a significant improvement.
Making a change via the WYSIWYG interface allows us to see multiple changes without developer intervention.
A de minimis incentive was given to thank the reviewer for their time. The incentive was not used to bias or drive a particular response, nor was the incentive contingent on a positive endorsement. TR verified that a representative sample of customers was invited. More Info