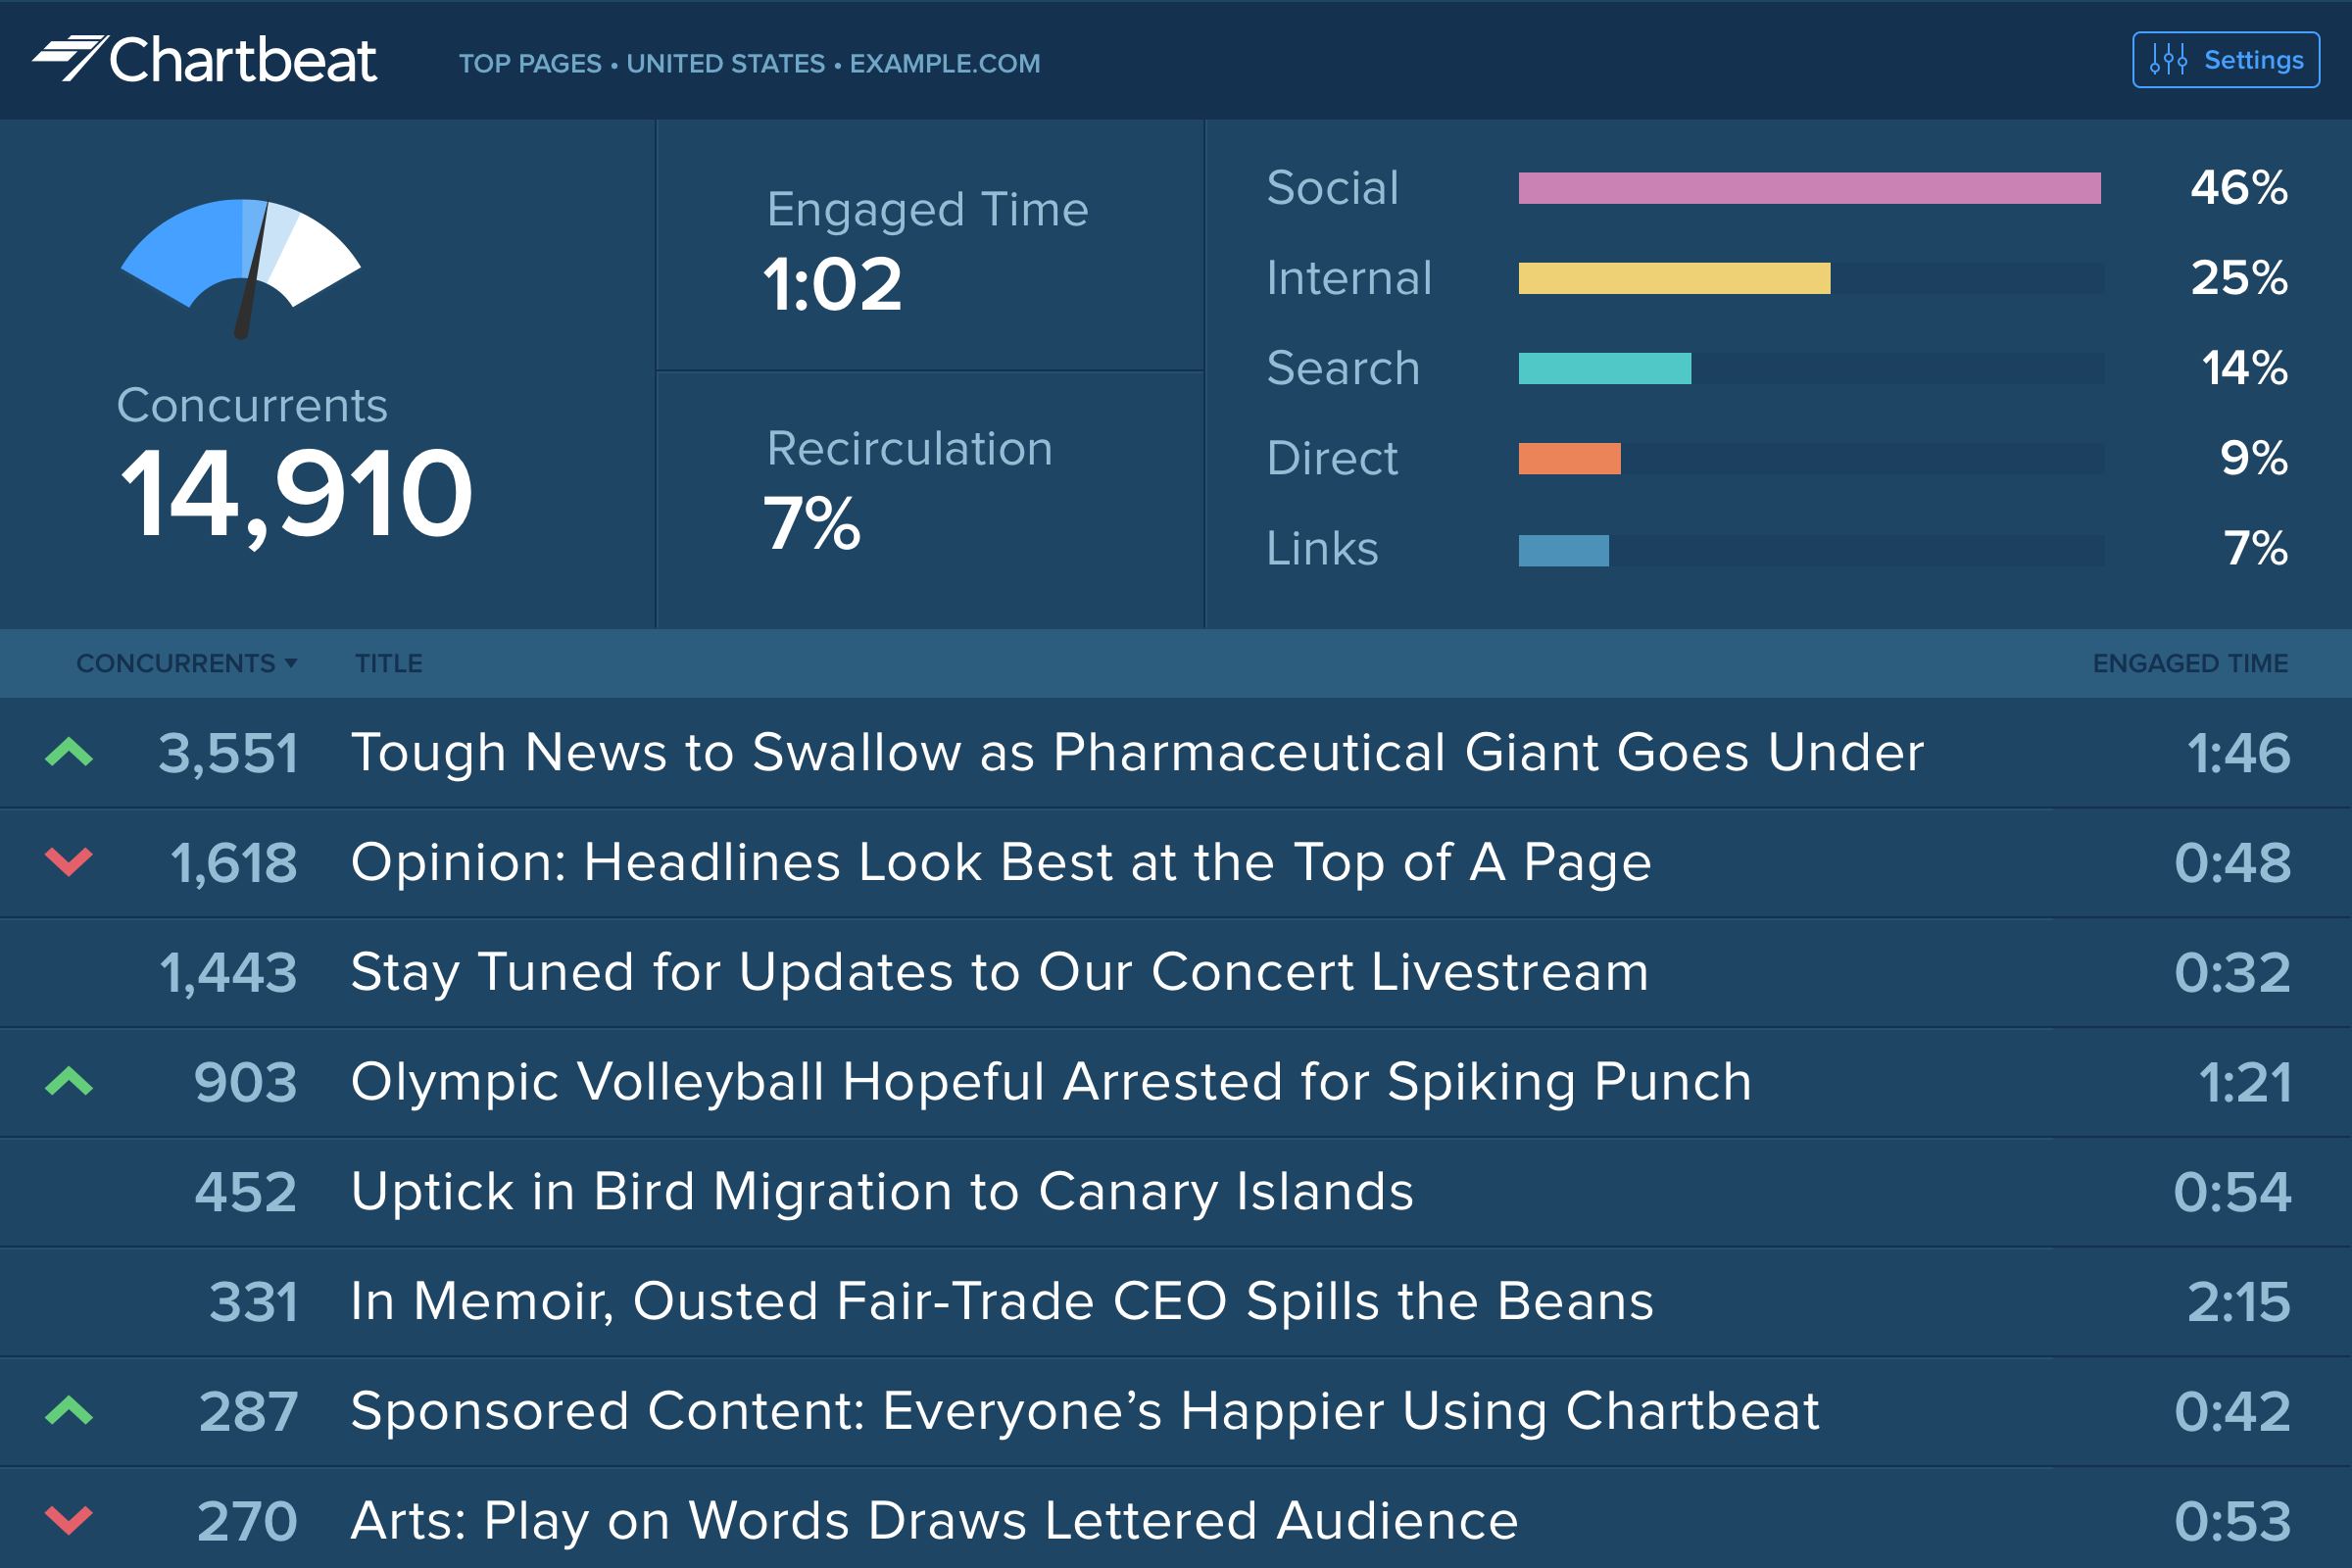
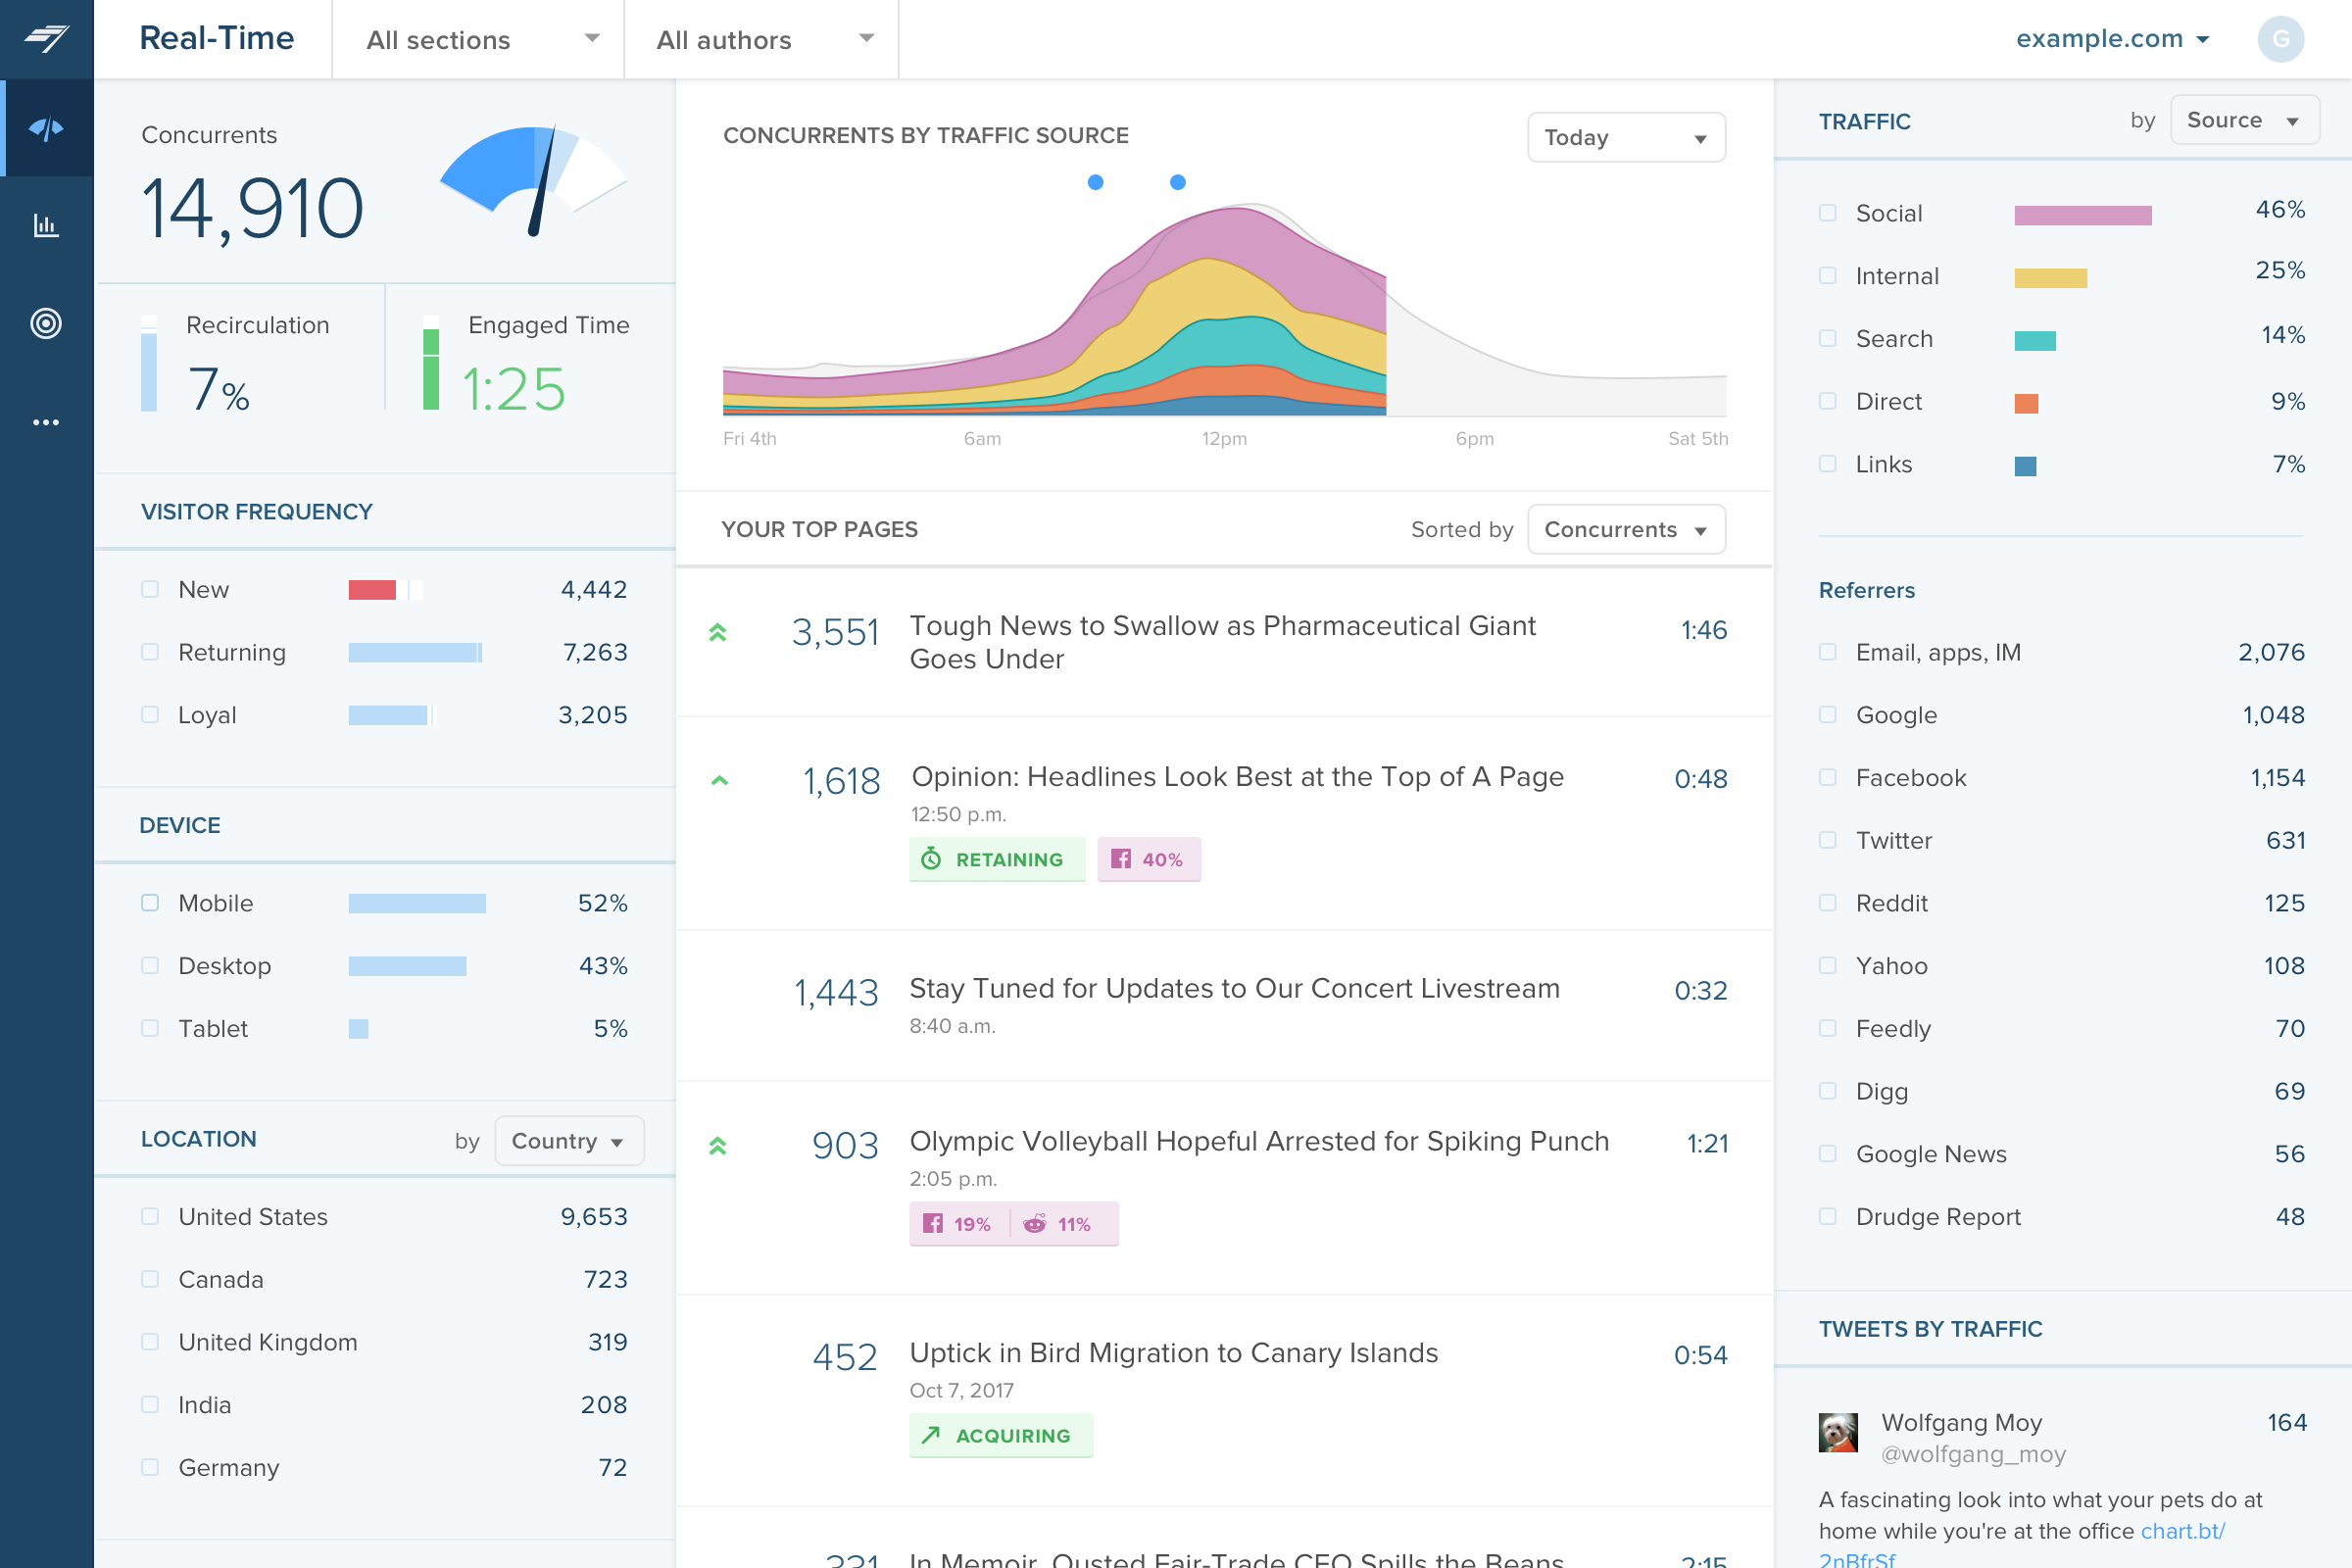
Chartbeat delivers real-time analytics, insights, and transformative tools for content teams around the world, to help improve audience engagement, inform editorial decisions, and increase loyalty.
N/A
Kameleoon
Score 7.7 out of 10
Enterprise companies (1,001+ employees)
Kameleoon boasts users among 500 corporate and enterprise companies across North America, Europe, and Asia Pacific to help brands deliver digital experiences and products to their customers. GDPR, CPPA, and HIPPA compliant, Kameleoon’s A/B testing, full stack, and AI-powered personalization solutions are designed to help marketers, product owners, and developers maximize customer engagement and conversion, across all channels.
N/A
Pricing
Chartbeat
Kameleoon
Editions & Modules
No answers on this topic
No answers on this topic
Offerings
Pricing Offerings
Chartbeat
Kameleoon
Free Trial
Yes
Yes
Free/Freemium Version
No
No
Premium Consulting/Integration Services
No
No
Entry-level Setup Fee
No setup fee
No setup fee
Additional Details
Chartbeat pricing is based on monthly site page views. Discounts are applied to multi-year contracts. The Basic Plan includes the Real-time Dashboard, Historical Dashboard, Heads Up Display, Reports, Big Board, iOS and Android app, and Real-time API endpoints.
The Plus Plan includes all of the Basic Plan features, plus ONE of the following Premium features: Headline Testing, Advanced Queries, or Multi-Site View.
The Premium Plan includes all of the Basic Plan features, plus ALL Premium features: Headline Testing, Advanced Queries, Multi-Site View, and enterprise-level support and custom trainings.
It is well suited to keeping me toward a specified goal, and gives me concrete numbers and gives me an idea of what we need to do to meet our goals. It's less appropriate if you want something more than pageviews, and doesn't really do a lot for video views.
We can easily create A/B tests and personalizations to target specific audiences and improve the customer journey
The widget editor is intuitive and very easy to use, a lot of features are available without any code
The result analysis dashboard is easy to read and understand : we have very detailed data to analyze the performance of our experiments, even on pages with low traffic thanks to the CUPED algorithm.
The segment builder is incredibly intuitive and easy to use. Works wonderfully with Mixpanel. Our team managed to set up our segments and experiments within a couple of hours.
Great customer service and willingness to help with any of our questions.
Very secure testing environment for our A/B testing experiments. We had a staging environment easily set up for review and testing before live deployment. We needed a HIPAA compliant solution, and Kameleoon delivers.
Source of traffic needs improvement. Search and social make sense, but "internal" and "links" is a grey area. It would be helpful to define those with an organization and provide an information icon so users can easily remember what each of those buckets is tracking.
More ways to customize the real-time board. For example, with video content, that's great that I can see a user has started a video, but what is the completion rate, was that only on O&O or can that track Facebook, too?
Would like to see demo (age) information included as a way to slice the data so I can see what's working with my older and younger demo.
Interface of the graphics editor is quite conceptual. It is fine after a few days but it takes a little while to recognize some icons.
Their online tutorial could also be easily improved.
If you want to do major graphical changes on your website, you will have to inject JS and CSS code which requires some technical background but I don’t know if that point can be improved.
I gave Chartbeat a 5 for a renewal rating, because, while it delivers clear and understandable content, Google Analytics also provides many of the same features for free. For a small to medium website, I believe it would be more cost effective to use Google Analytics. A website with a high amount of traffic, however, could merit spending the money on Chartbeat to maximize their potential.
Chartbeat is really pretty straightforward. The only things that may cause confusion are the string of sidebar features and tools at the left of the screen. I mostly use the big leader board in real-time and the historical feature (looking at the monthly or weekly performance of my team's content) and then generate reports automatically from there.
Kameleoon offers one of the best UI's I've seen when I've compared it to 4 of the other big competitors in the landscape. They have some improvement areas when it comes to the UX - Which is easily solvable if/when prioritized. There's a little to much "clicking" and "new tabs" in my opinion
I have had limited experience of support for Chartbeat but whenever I have needed help it has been there. Recently there was an issue of seeing different forms of data in real time - app and otherwise effectively, and the issue was being clearly dealt with and communicated back to us.
Our Kameleoon team is also very dedicated to us. We have weekly meetings to review our project roadmap and the results of our ongoing campaigns. Kameleoon’s team is very supportive and ambitious for every project. The responsiveness of the teams is also very helpful and reassuring when there are up and downs (as happens in every relationship).
Google Analytics has gradually become much more difficult to use, and much slower in its realtime reporting. It was the changes that came in with Google Analytics 4 that gave us the final push to work with Chartbeat - a product some of us were already familiar with from previous jobs. Things are just much harder to find in GA, and when time is always tight you can't afford to spend a long time looking for particular data - it should be quick and easy to locate
The agency that helped create our new Headless website recommended Kameleoon and Growth book on top of the stalwart Optimizely. Our final round of POC was between Optimizely and Kameleoon, and the thing that pushed Kameleoon ahead was the size of their snippet and how easy it was to set up the Segment integration out of the box to do what we needed it to do. Although Kameleoon is relatively "new" to the North American market, they have continued to perform above and beyond our expectations.
The platform allows us to test and learn different functionalities.
We run multiple feature experiments at different levels of the customer journey (search, login, and checkout) to improve efficiency and our conversion rate.
We are also able to boost our fidelity program to the right audience thanks to AI.
And obviously, optimize the user experience continuously.