
Jake Noble
Director
Chose GoSquared
Chartbeat does not have as many features as GoSquared.

| Product | Rating | Most Used By | Product Summary | Starting Price |
|---|---|---|---|---|
 Chartbeat | N/A | Chartbeat delivers real-time analytics, insights, and transformative tools for content teams around the world, to help improve audience engagement, inform editorial decisions, and increase loyalty. | N/A | |
 GoSquared | N/A | GoSquared provides real-time website analytics to sites of all sizes. The real-time dashboard displays website analytics on an individual visitor basis. The Now App displays concurrent analysis (the visitors who are on your site right now) of your site performance. The Trends App displays historical, trends and comparison analysis on real-time data. You don't have to wait 4 - 24 hours in order to compare todays current performance against last years. The Ecommerce App displays the same freshness… | $0 Per Month [Unlimited Users] |
| Chartbeat | GoSquared | |||||||||||||||
|---|---|---|---|---|---|---|---|---|---|---|---|---|---|---|---|---|
| Editions & Modules | No answers on this topic |
| ||||||||||||||
| Offerings |
| |||||||||||||||
| Entry-level Setup Fee | No setup fee | No setup fee | ||||||||||||||
| Additional Details | Chartbeat pricing is based on monthly site page views. Discounts are applied to multi-year contracts. The Basic Plan includes the Real-time Dashboard, Historical Dashboard, Heads Up Display, Reports, Big Board, iOS and Android app, and Real-time API endpoints. The Plus Plan includes all of the Basic Plan features, plus ONE of the following Premium features: Headline Testing, Advanced Queries, or Multi-Site View. The Premium Plan includes all of the Basic Plan features, plus ALL Premium features: Headline Testing, Advanced Queries, Multi-Site View, and enterprise-level support and custom trainings. | GoSquared Free, track up to 1000 pageviews a month. GoSquared Analytics, track up to 100k pageviews a month with pricing starting at £29/month. GoSquared Suite, track up to 100k pageviews a month with pricing starting at £79/month. | ||||||||||||||
| More Pricing Information | ||||||||||||||||
| Chartbeat | GoSquared | |
|---|---|---|
| Considered Both Products |  Chartbeat No answer on this topic |  GoSquared Jake Noble Director Chose GoSquared Chartbeat does not have as many features as GoSquared. |
| Chartbeat | GoSquared | |||||||||||||||||||||||||||
|---|---|---|---|---|---|---|---|---|---|---|---|---|---|---|---|---|---|---|---|---|---|---|---|---|---|---|---|---|
| Web Analytics |
|
| Chartbeat | GoSquared | |
|---|---|---|
| Small Businesses |  StatCounter Score 9.0 out of 10 | StatCounter Score 9.0 out of 10 |
| Medium-sized Companies |  Siteimprove Score 10.0 out of 10 | Siteimprove Score 10.0 out of 10 |
| Enterprises |  Optimal Score 9.0 out of 10 | Optimal Score 9.0 out of 10 |
| All Alternatives | View all alternatives | View all alternatives |
| Chartbeat | GoSquared | |
|---|---|---|
| Likelihood to Recommend | 8.6 (67 ratings) | 9.0 (15 ratings) |
| Likelihood to Renew | 9.9 (9 ratings) | 7.7 (12 ratings) |
| Usability | 7.8 (58 ratings) | 7.3 (2 ratings) |
| Support Rating | 8.1 (10 ratings) | 8.6 (2 ratings) |
| Chartbeat | GoSquared | |
|---|---|---|
| Likelihood to Recommend | Chartbeat
| GoSquared
|
| Pros | Chartbeat
| GoSquared
 Erdoğan Kürtür Chief Software Engineer |
| Cons | Chartbeat
| GoSquared
|
| Likelihood to Renew | Chartbeat
| GoSquared
 Bailey Bliss Owner |
| Usability | Chartbeat
| GoSquared
 Sharon Hurley Hall Professional blogger, writer, journalist |
| Support Rating | Chartbeat
 Graeme Brown Editor | GoSquared
|
| Alternatives Considered | Chartbeat
| GoSquared
 Dale Williams UI Designer |
| Return on Investment | Chartbeat
| GoSquared
 James Billingham CTO (Chief Technical Officer) |
| ScreenShots | Chartbeat Screenshots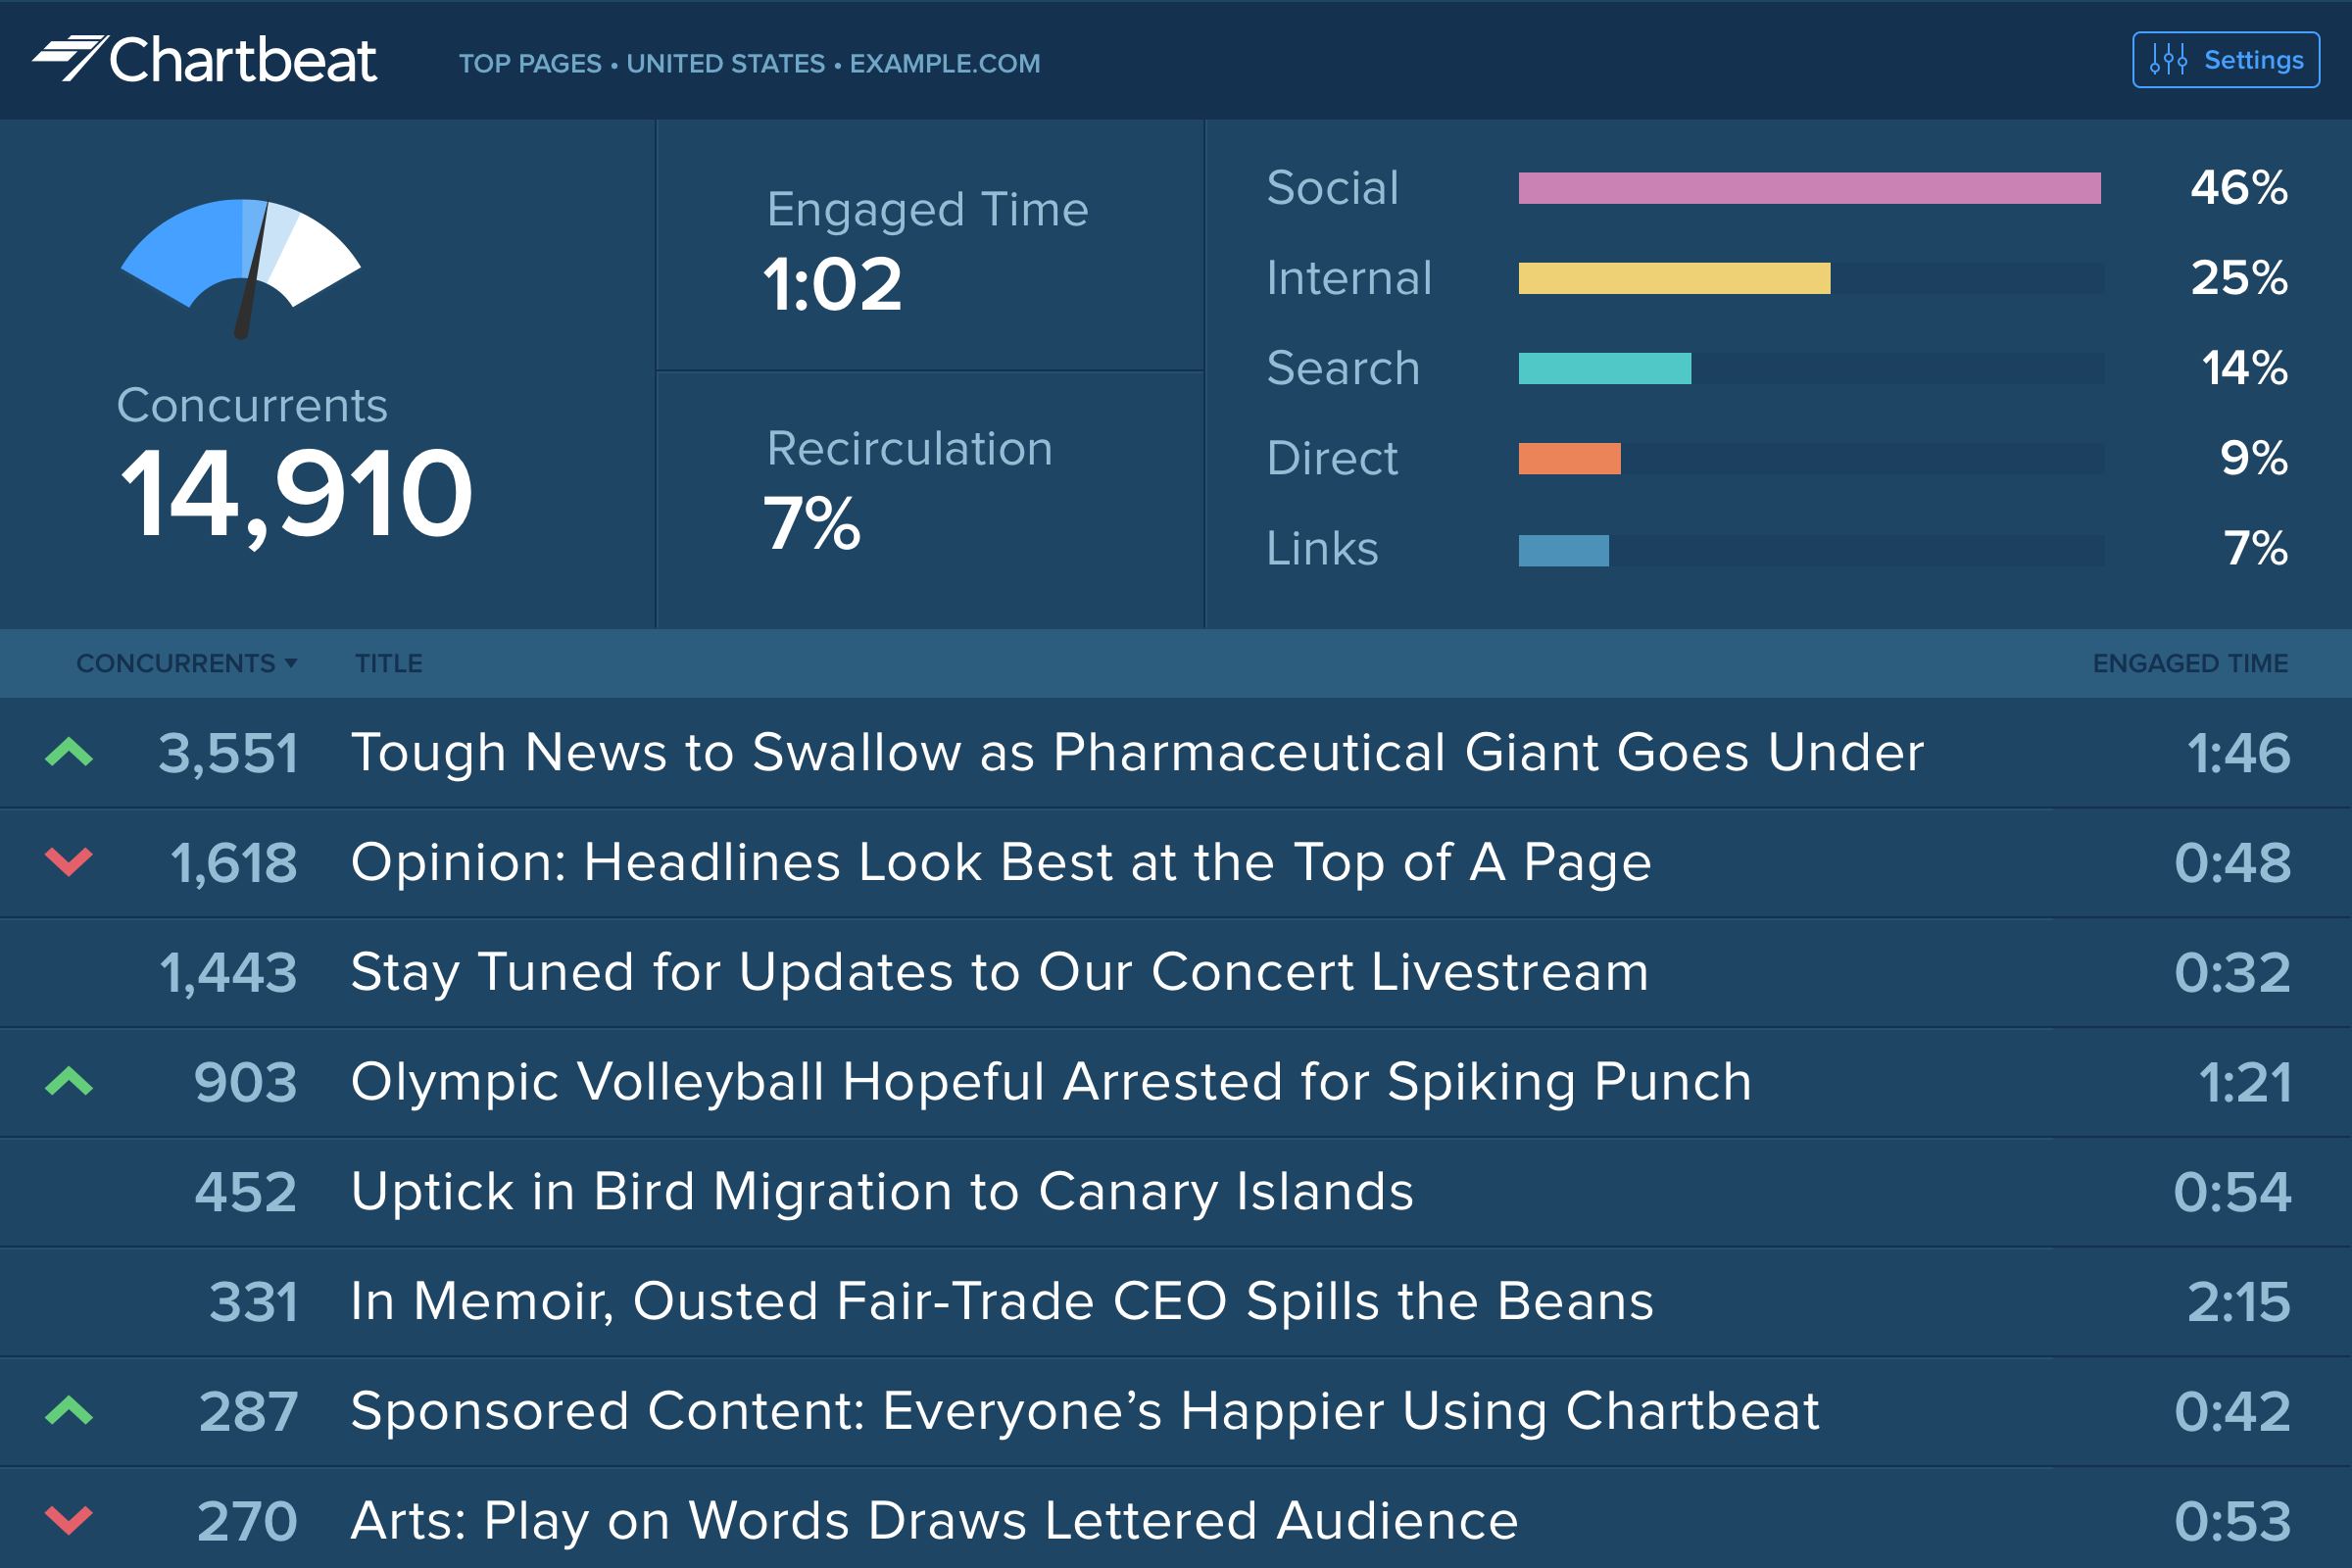 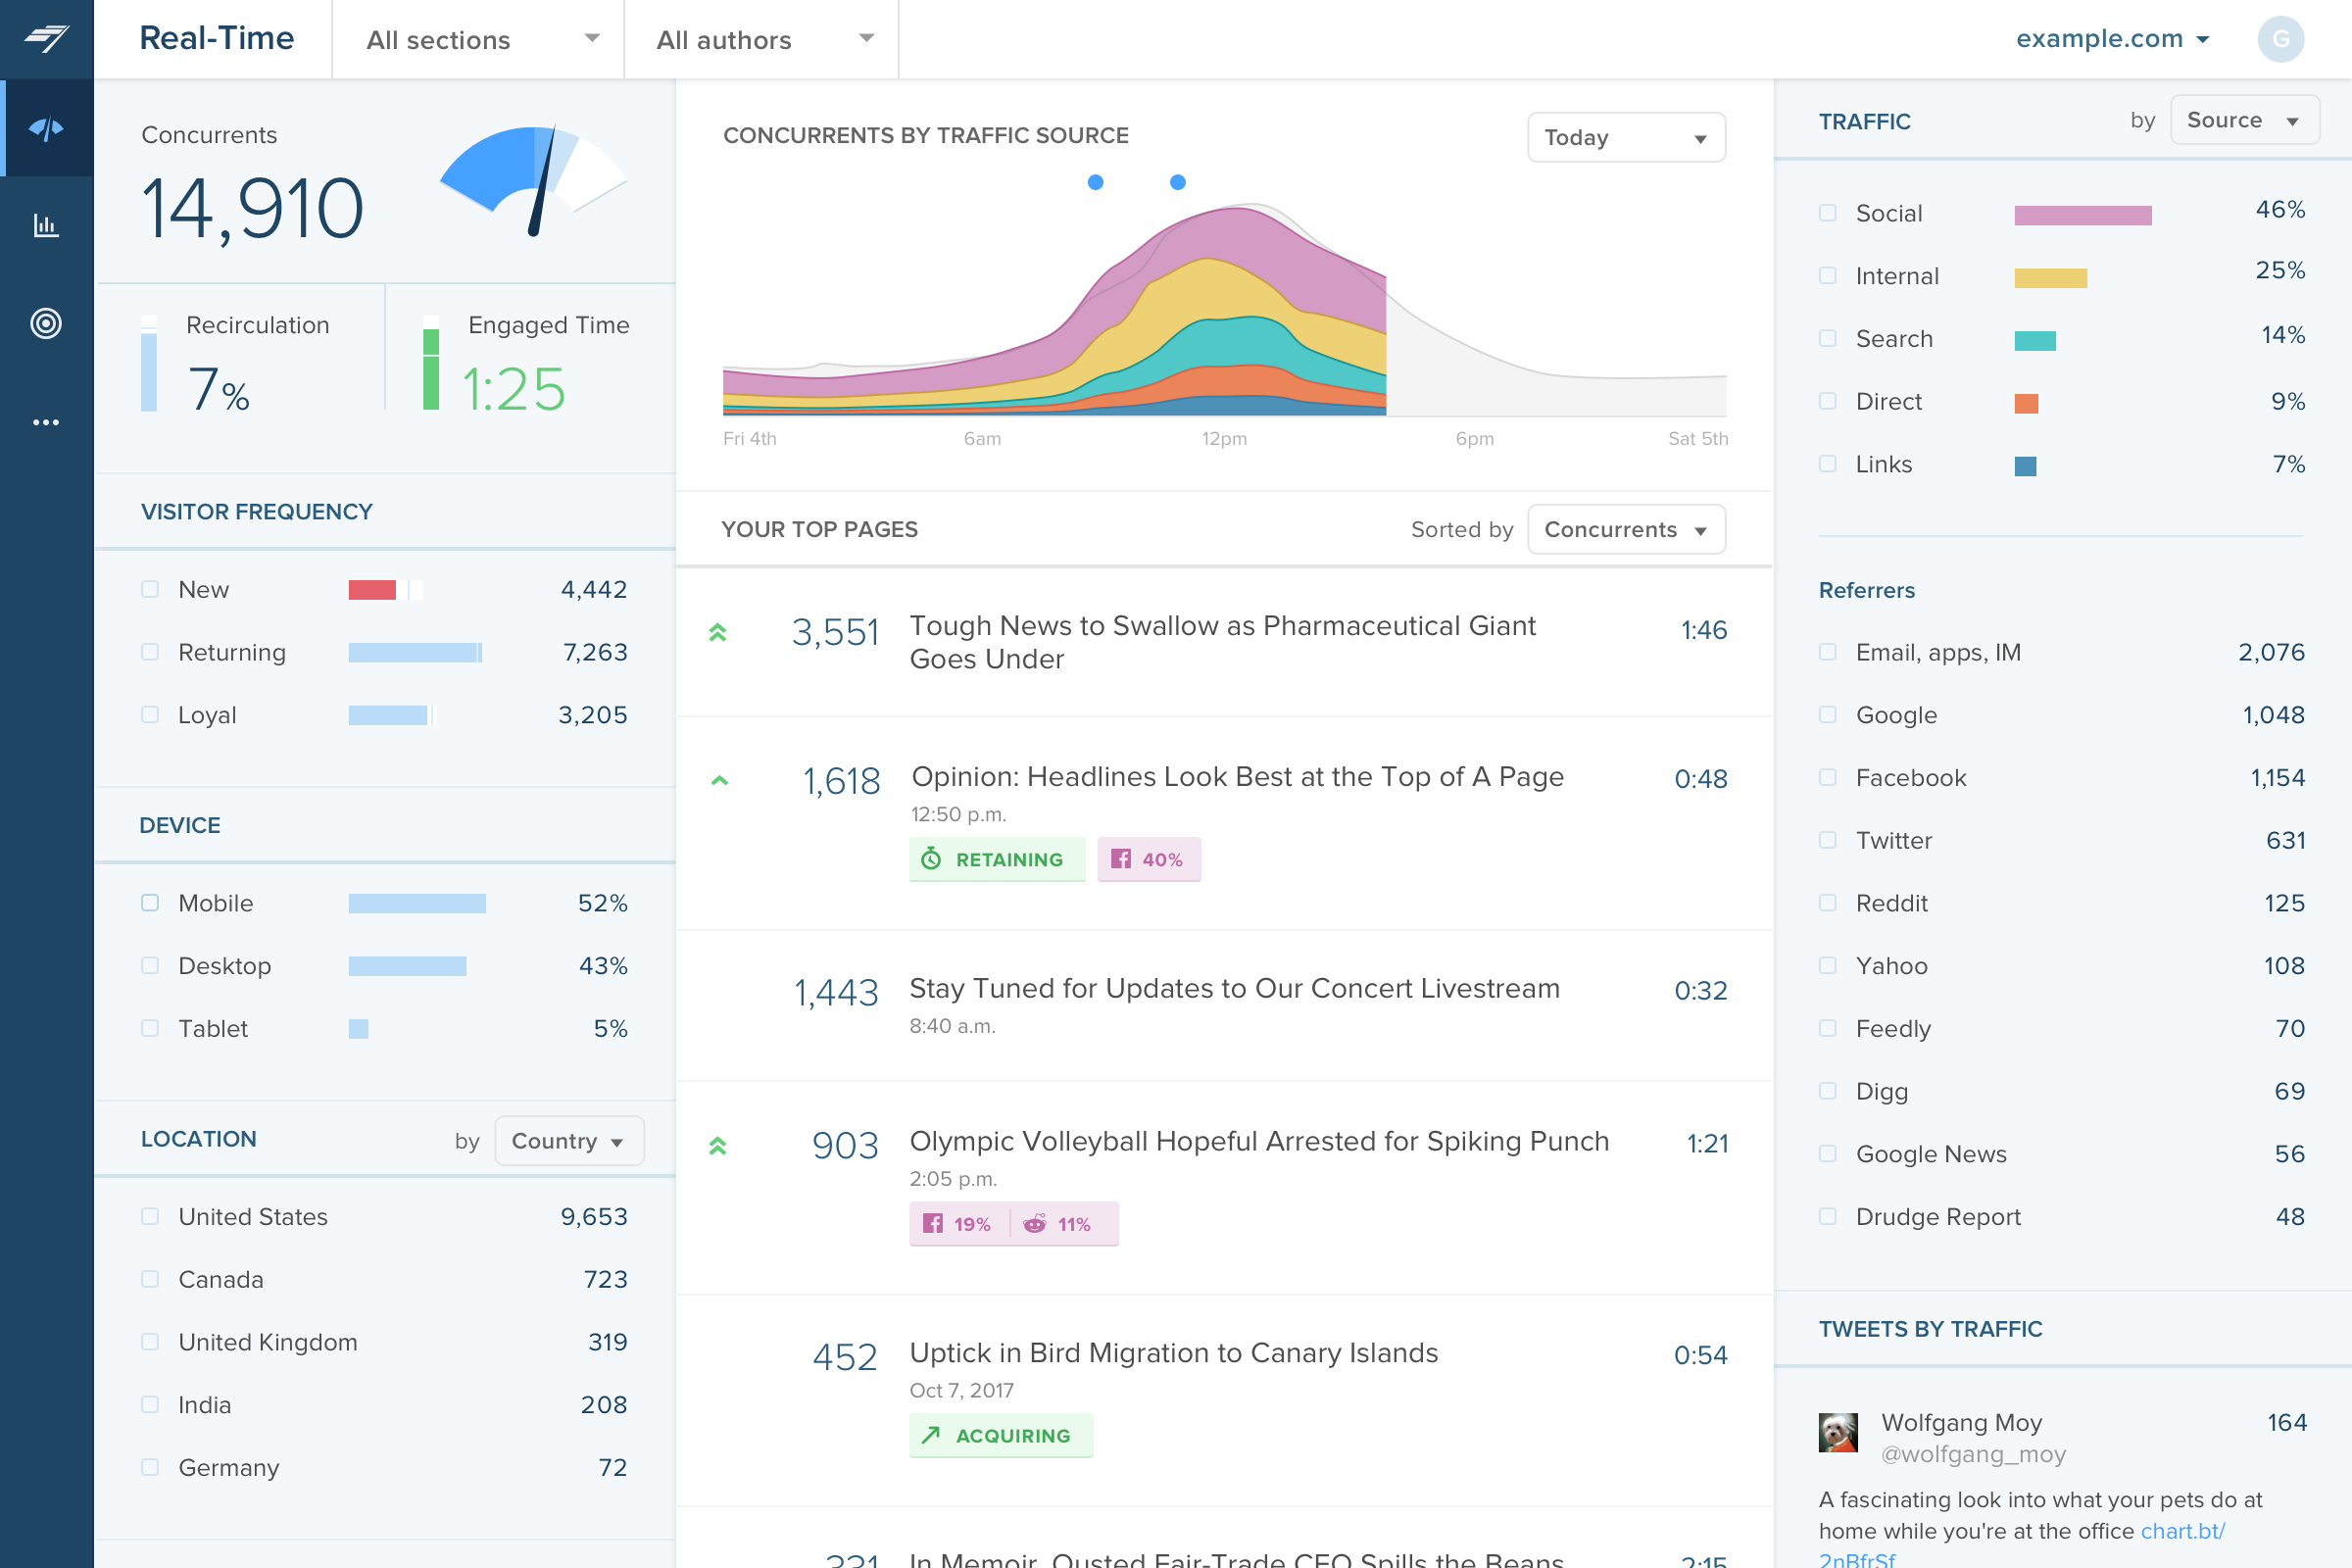     | GoSquared Screenshots 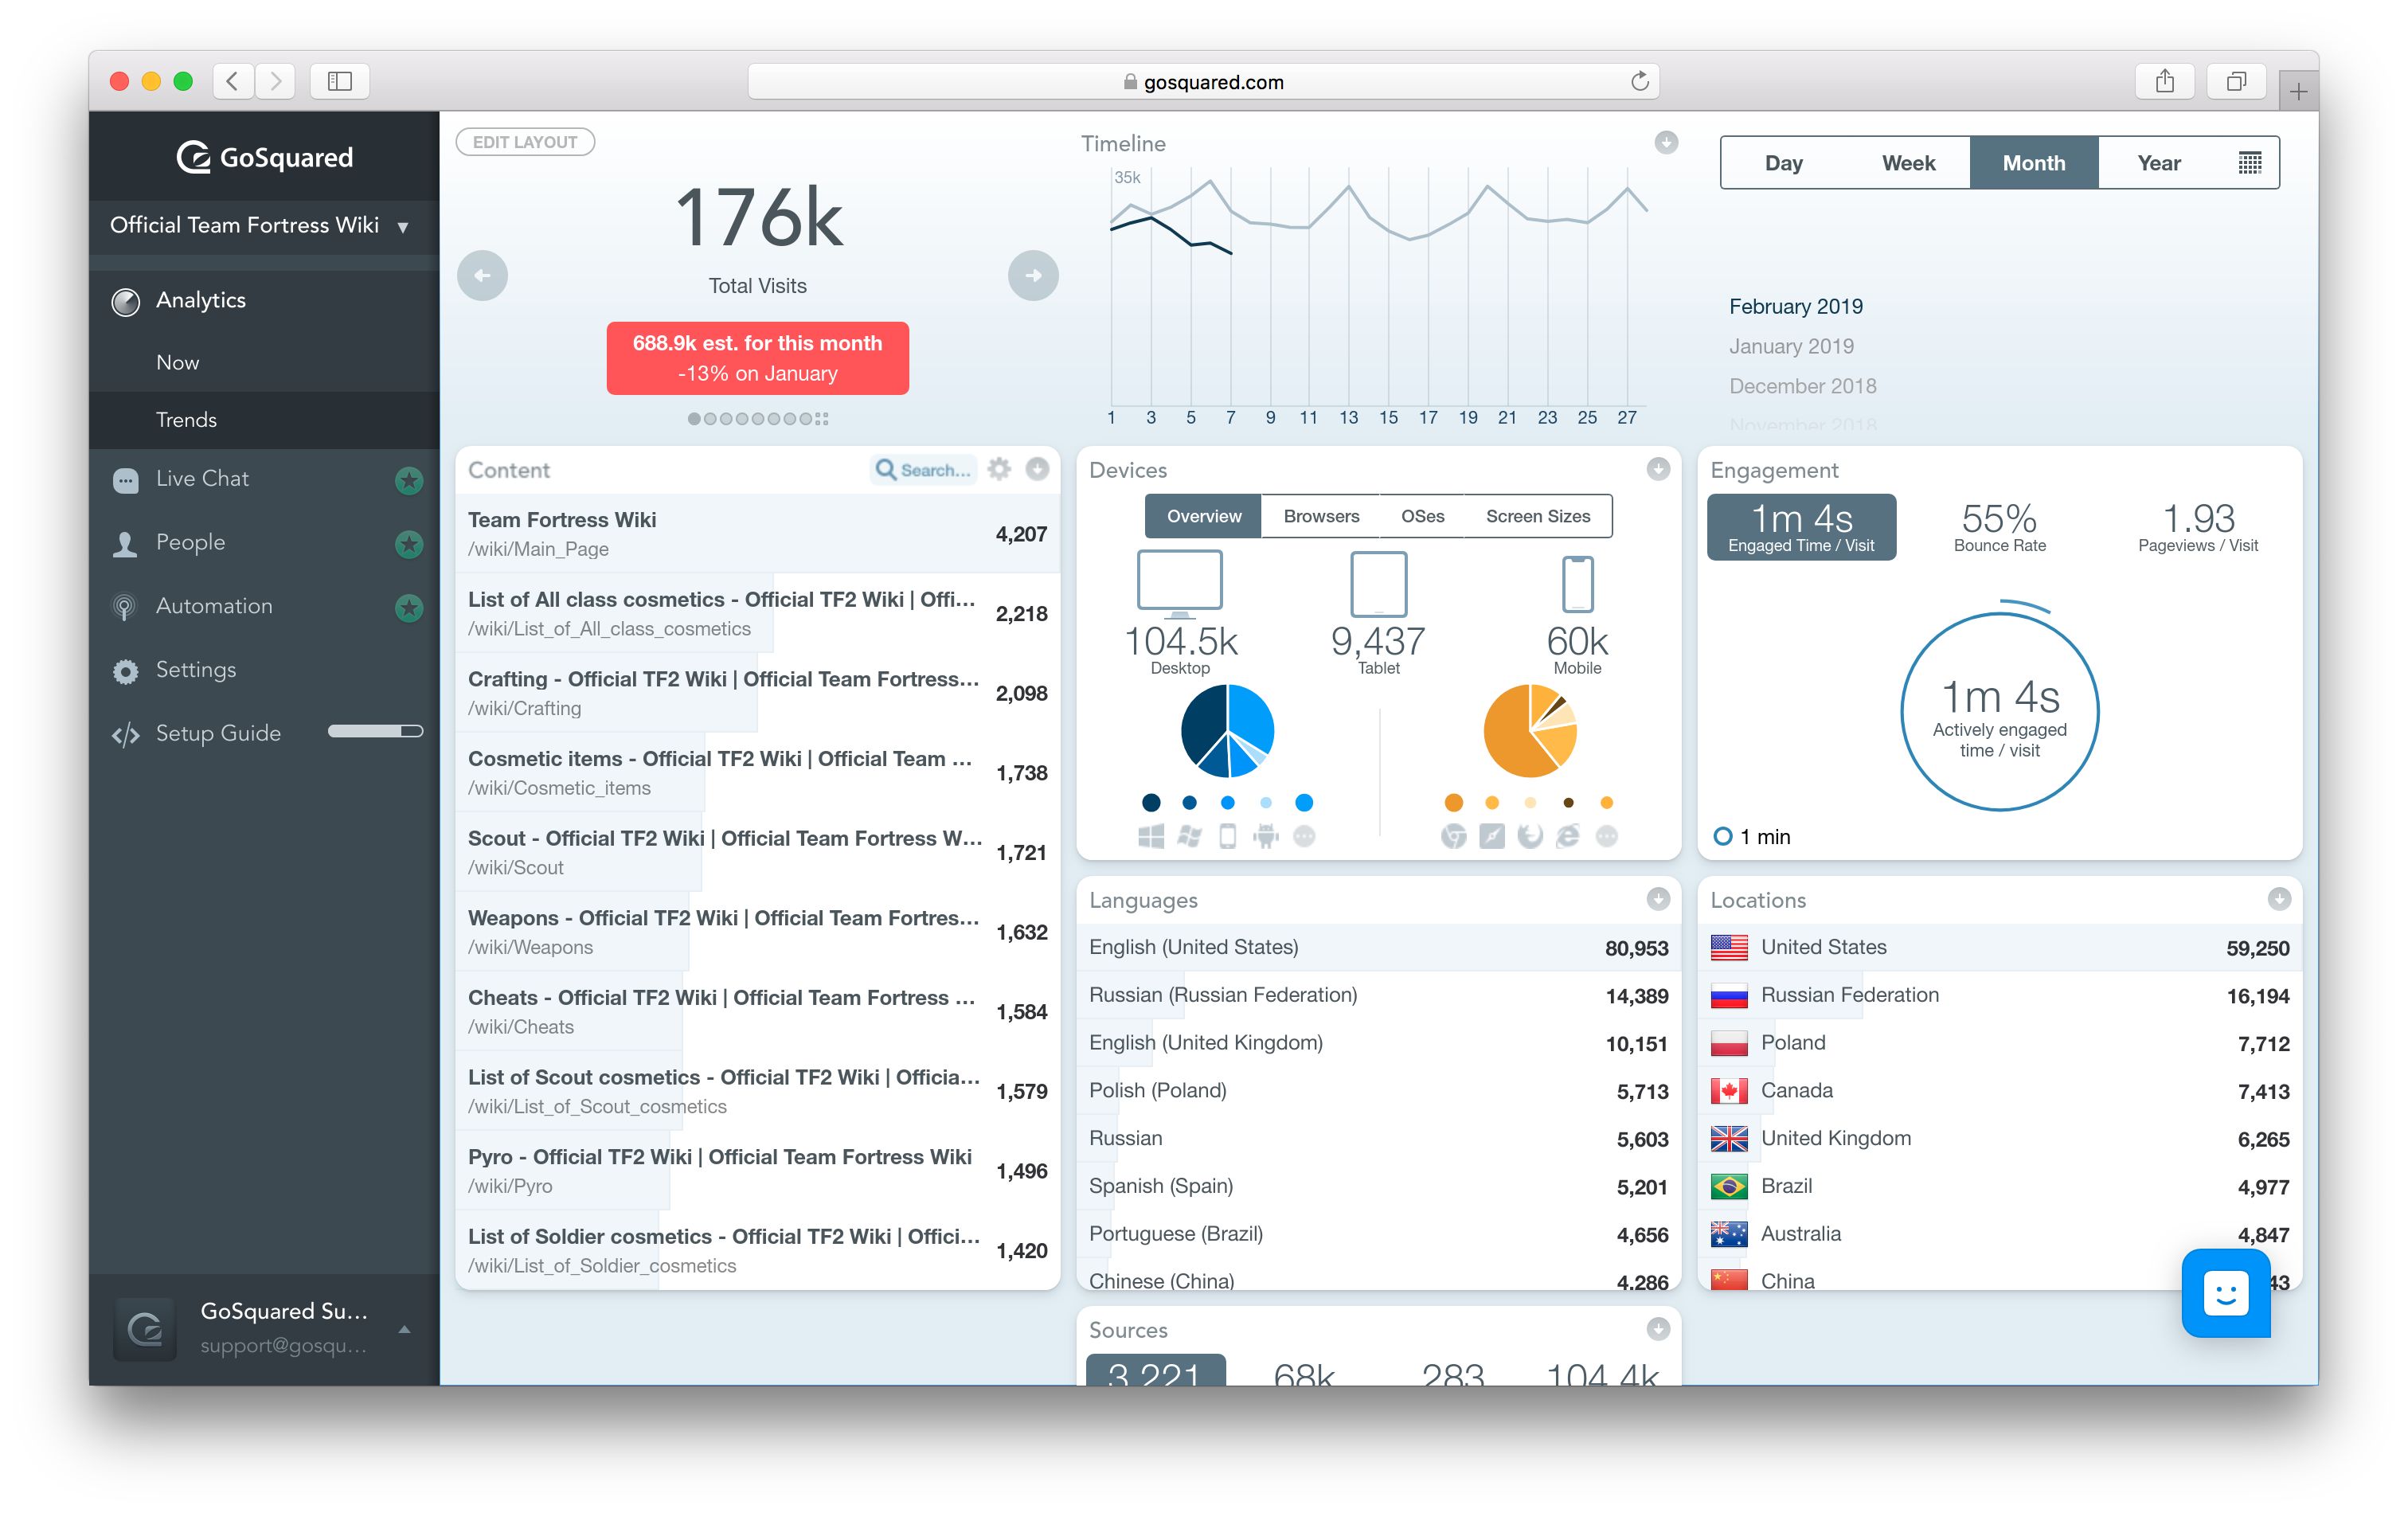 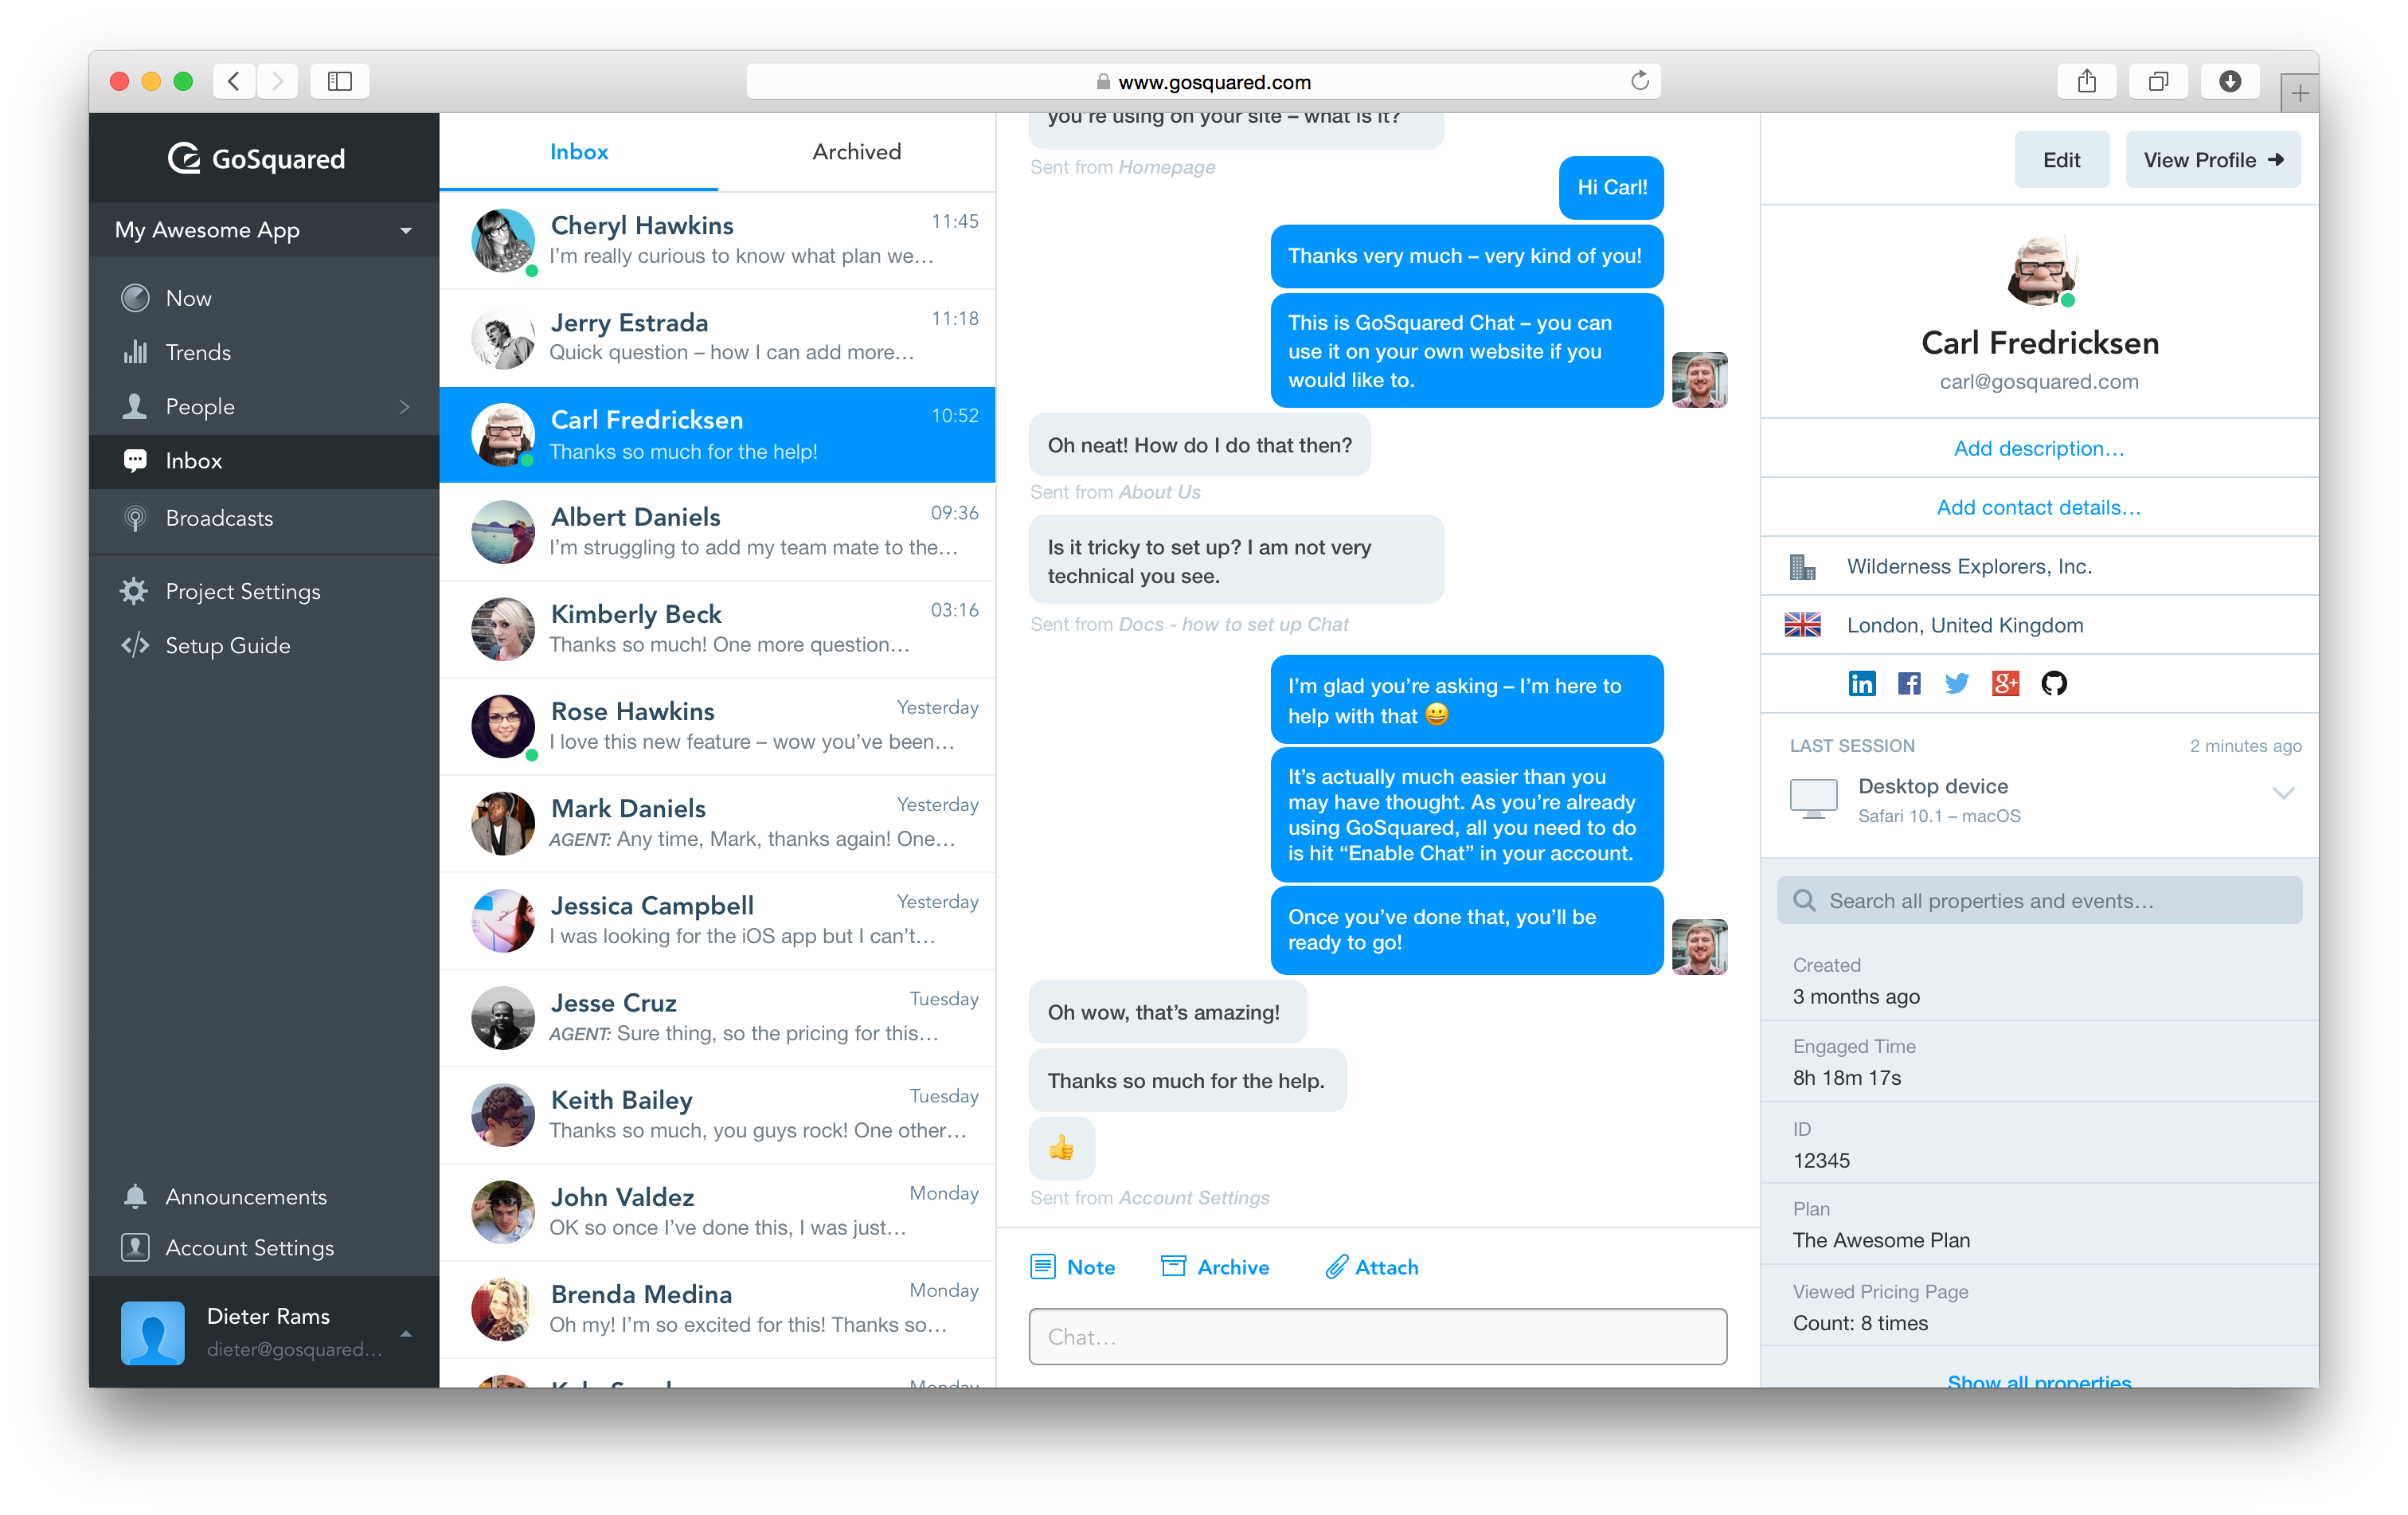 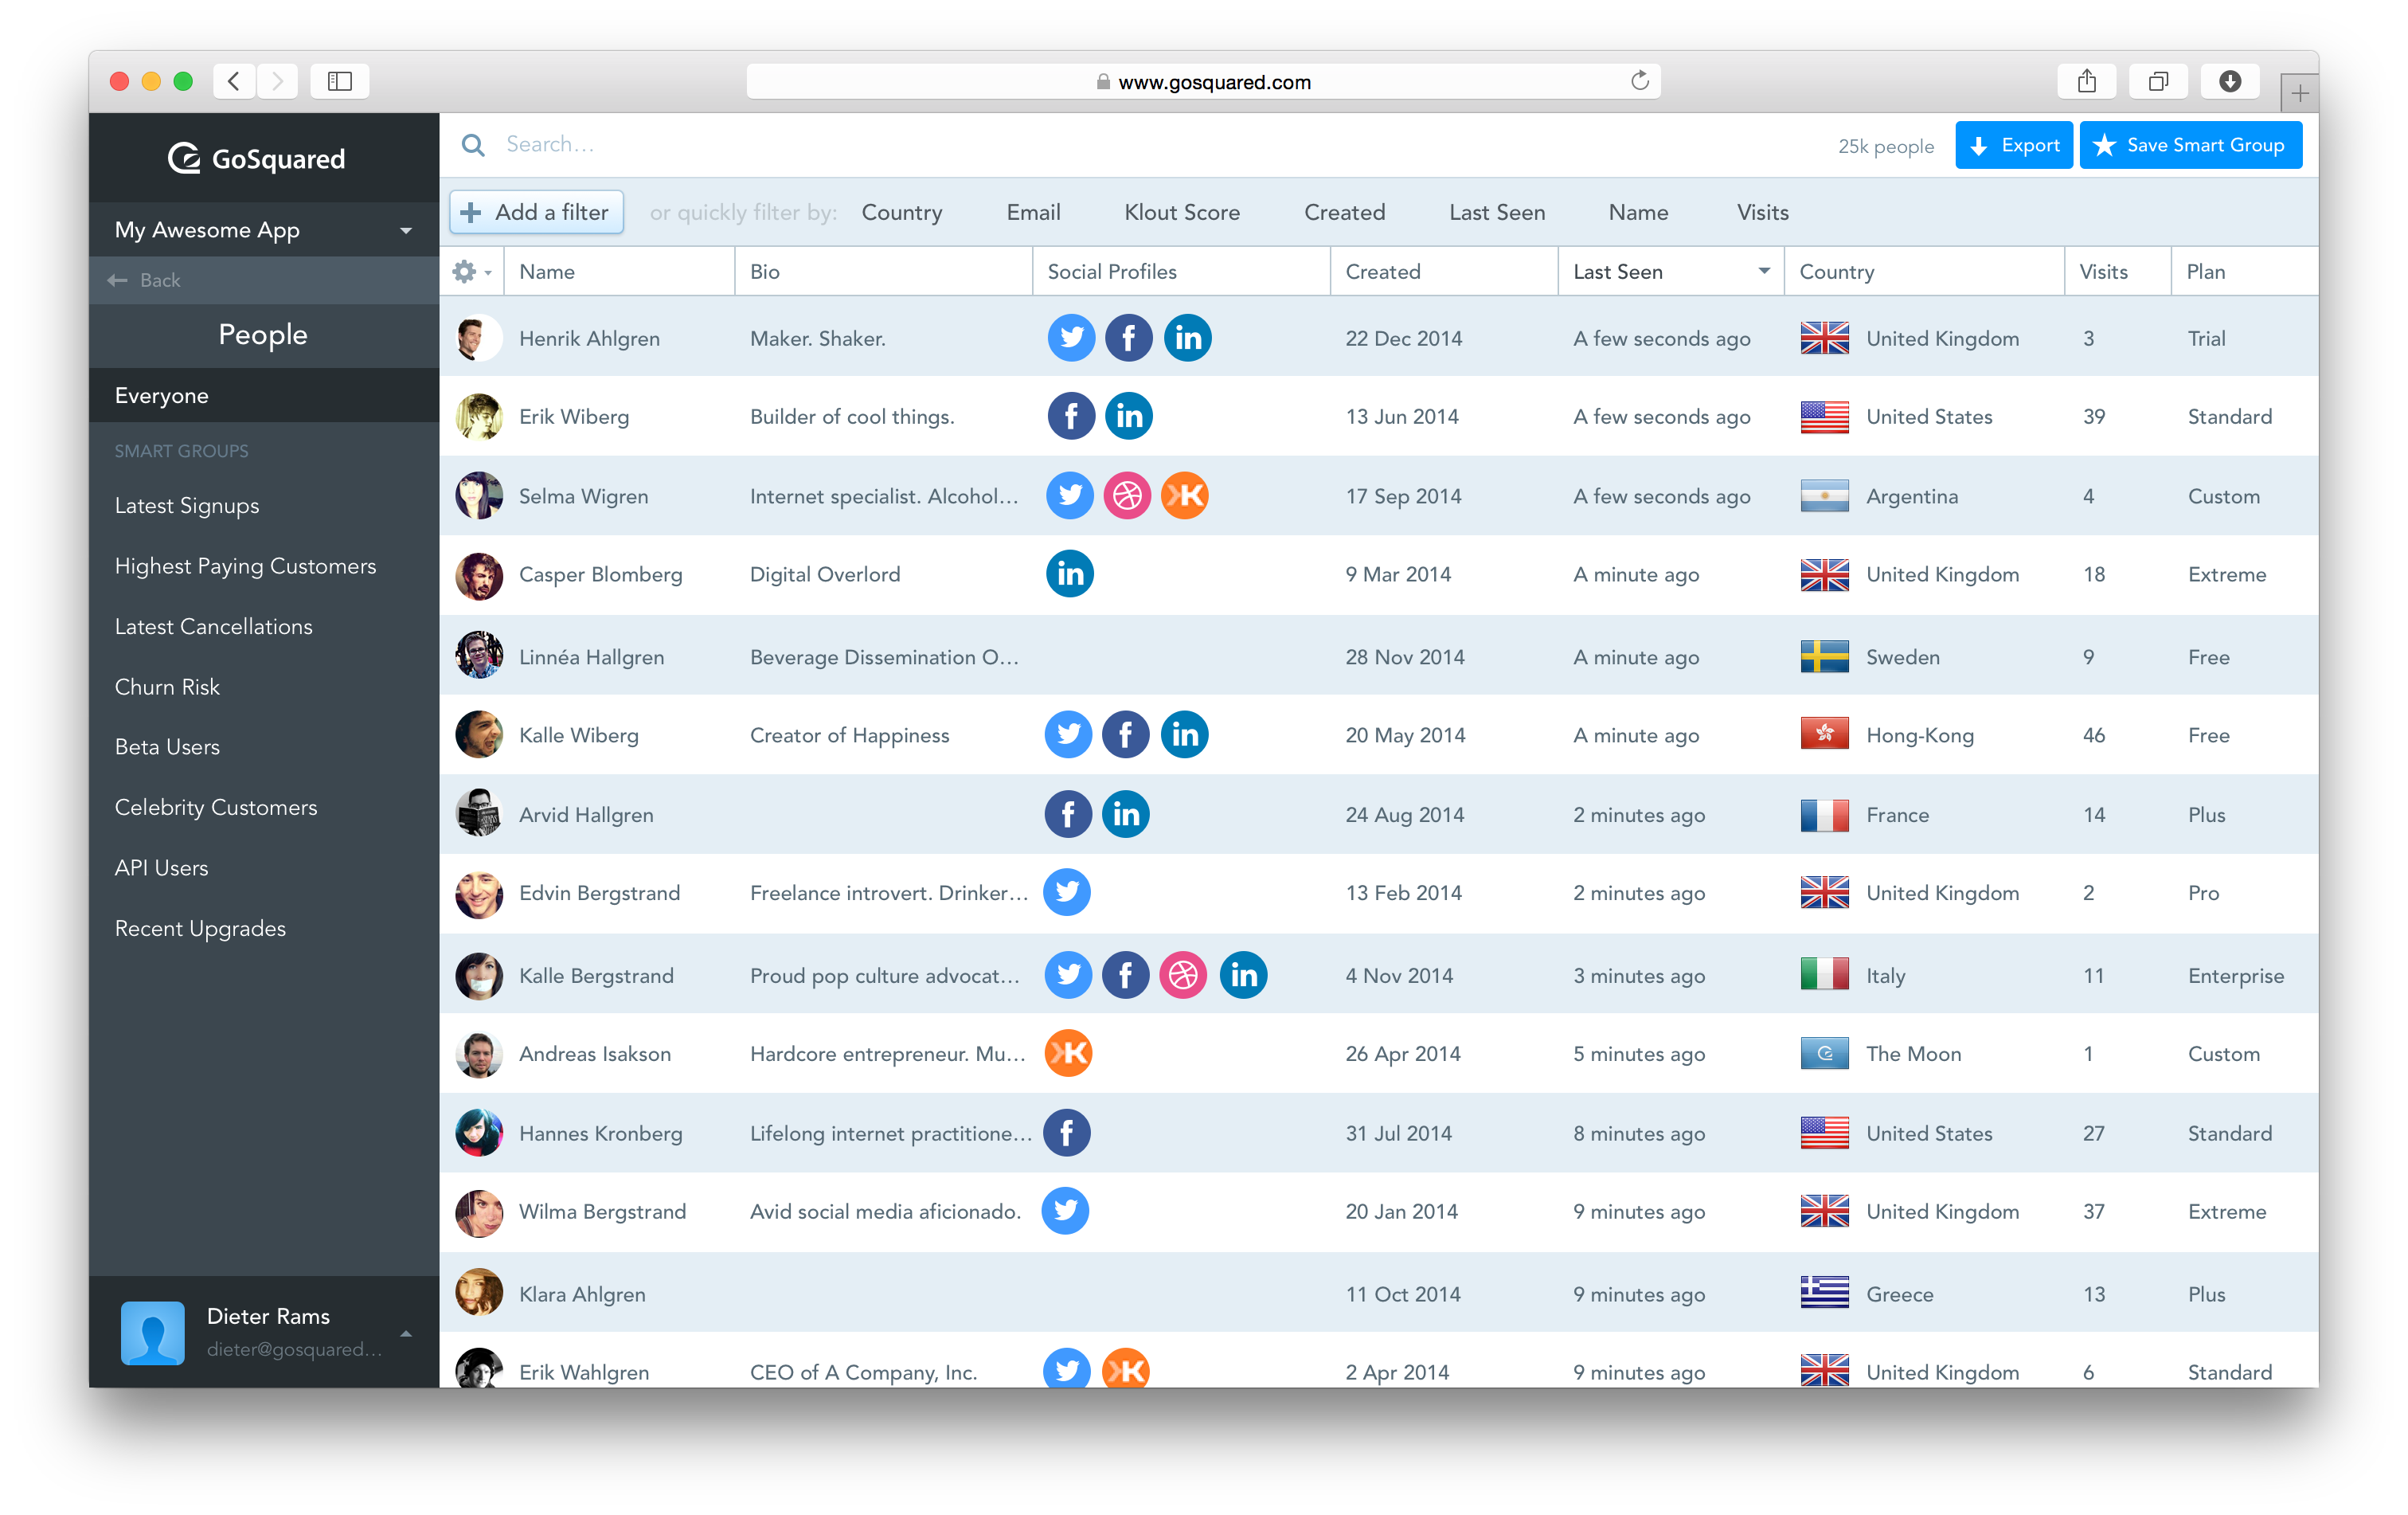 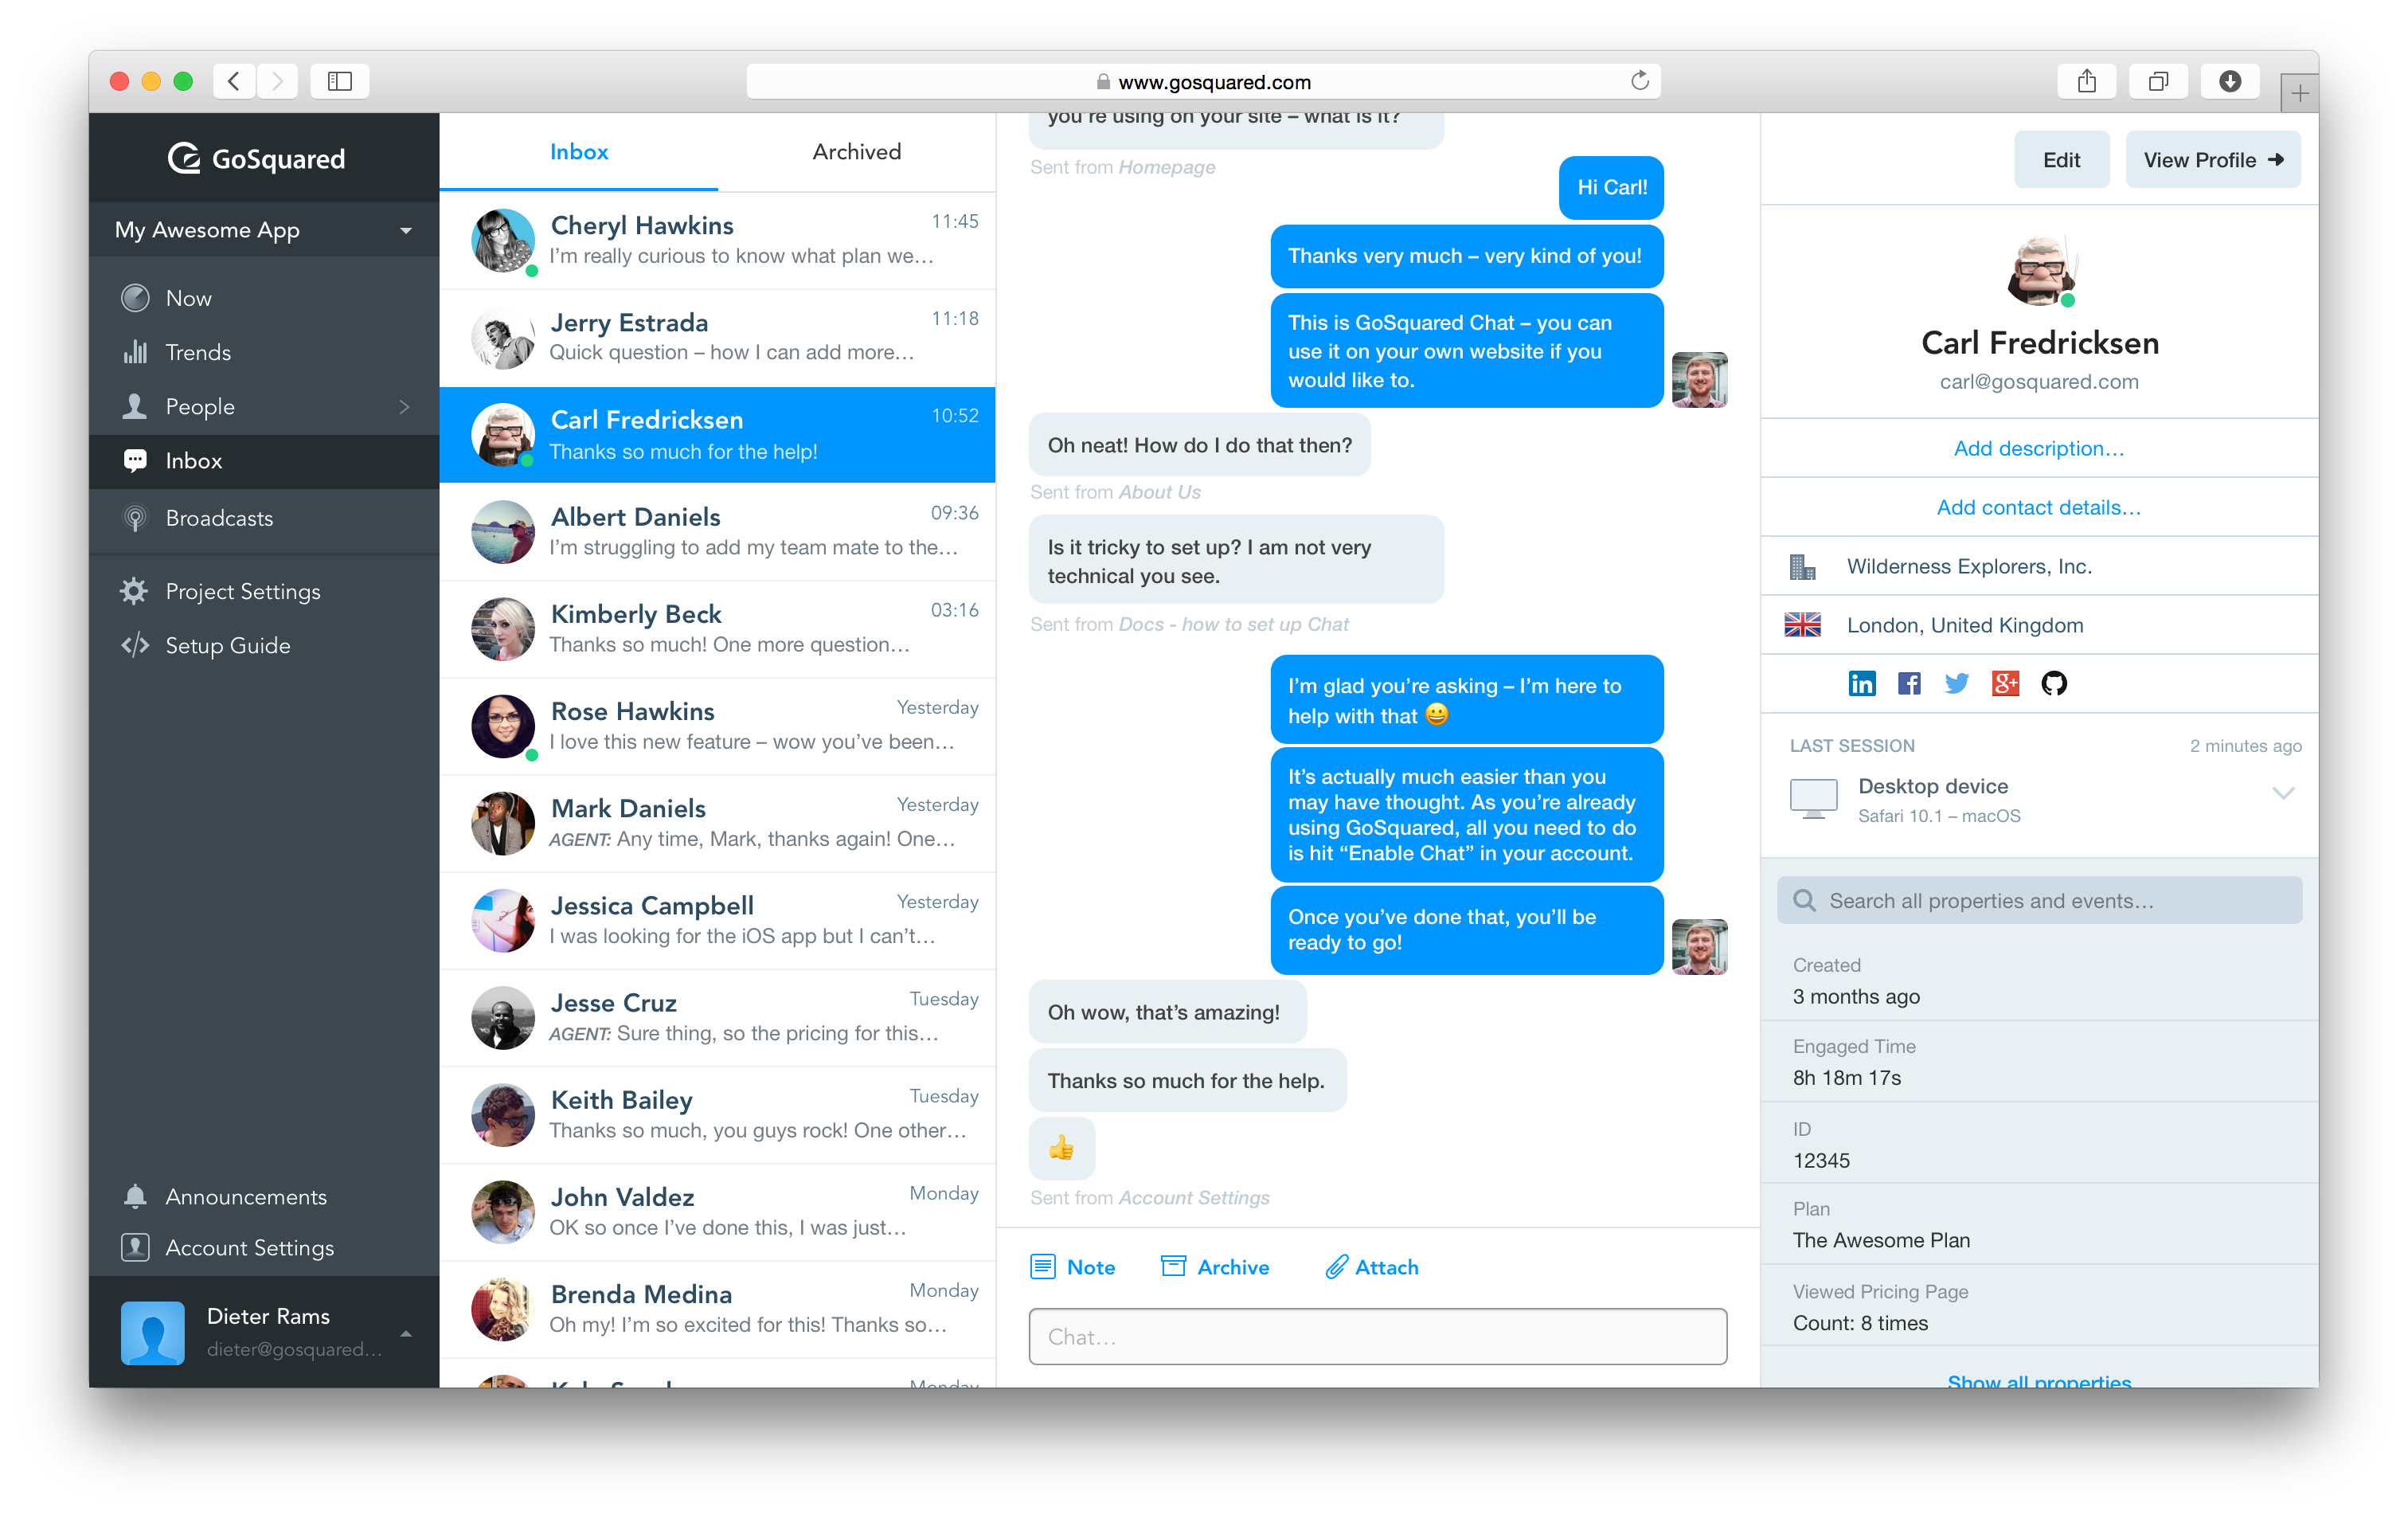 |
