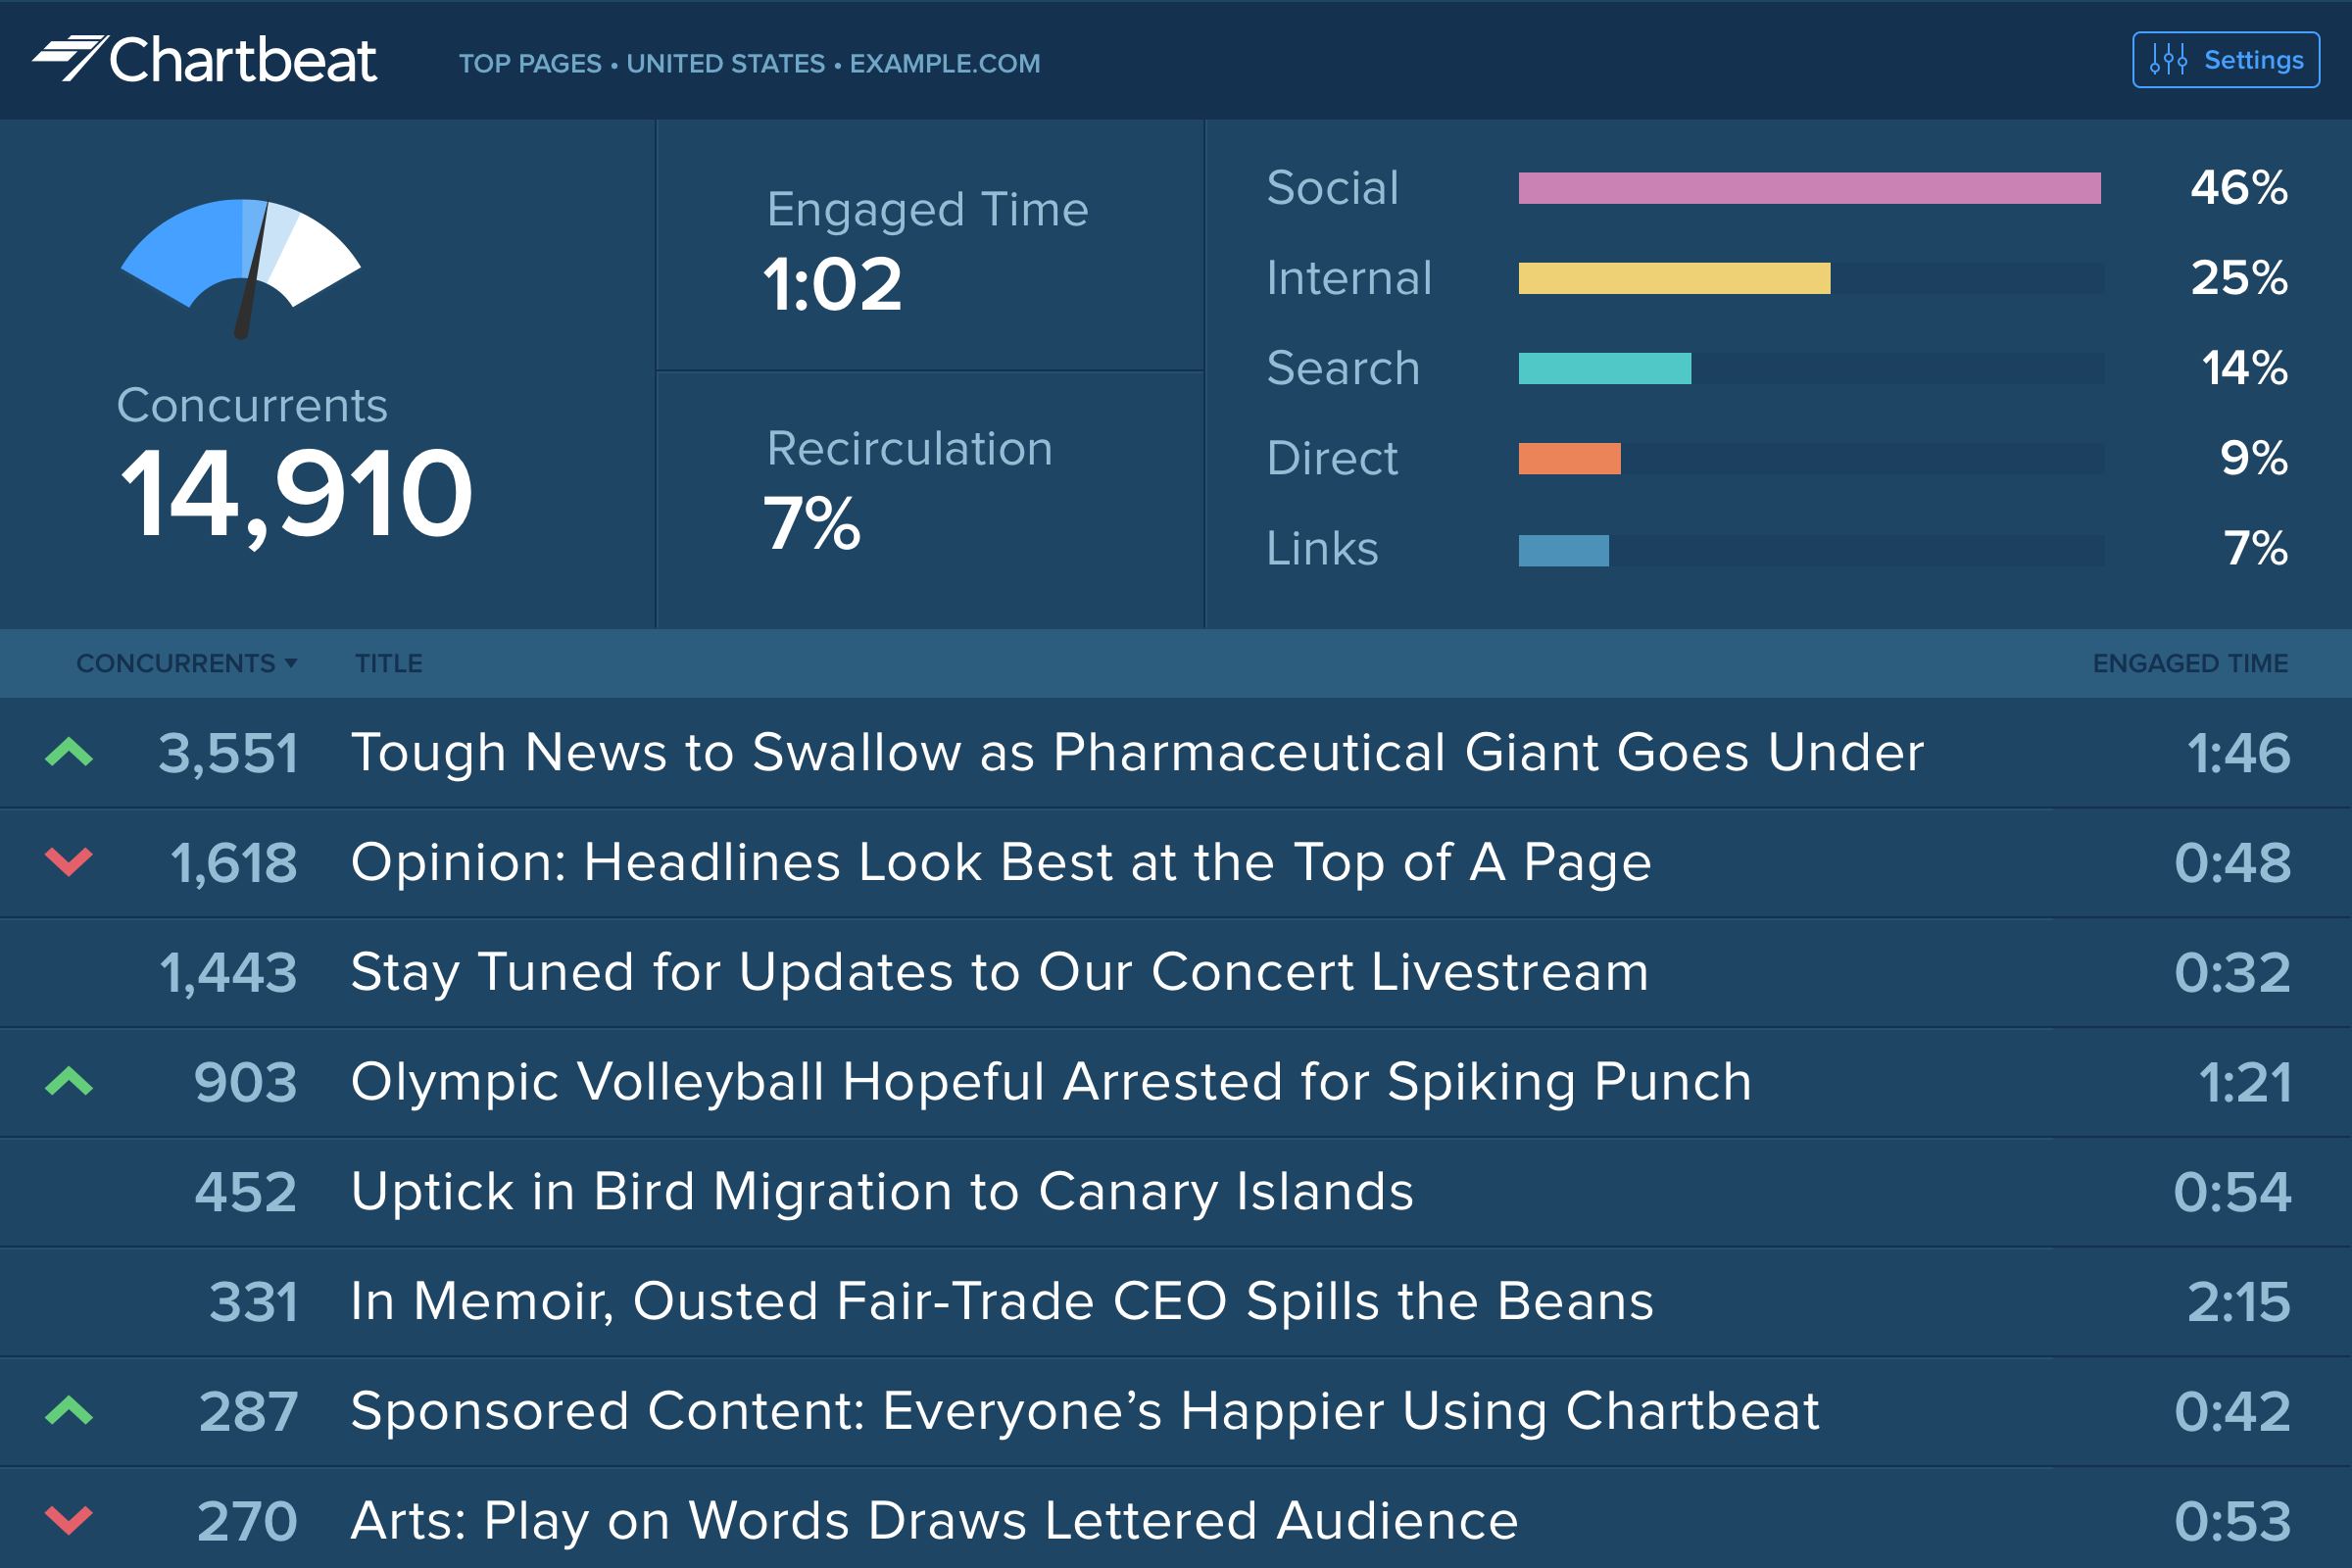
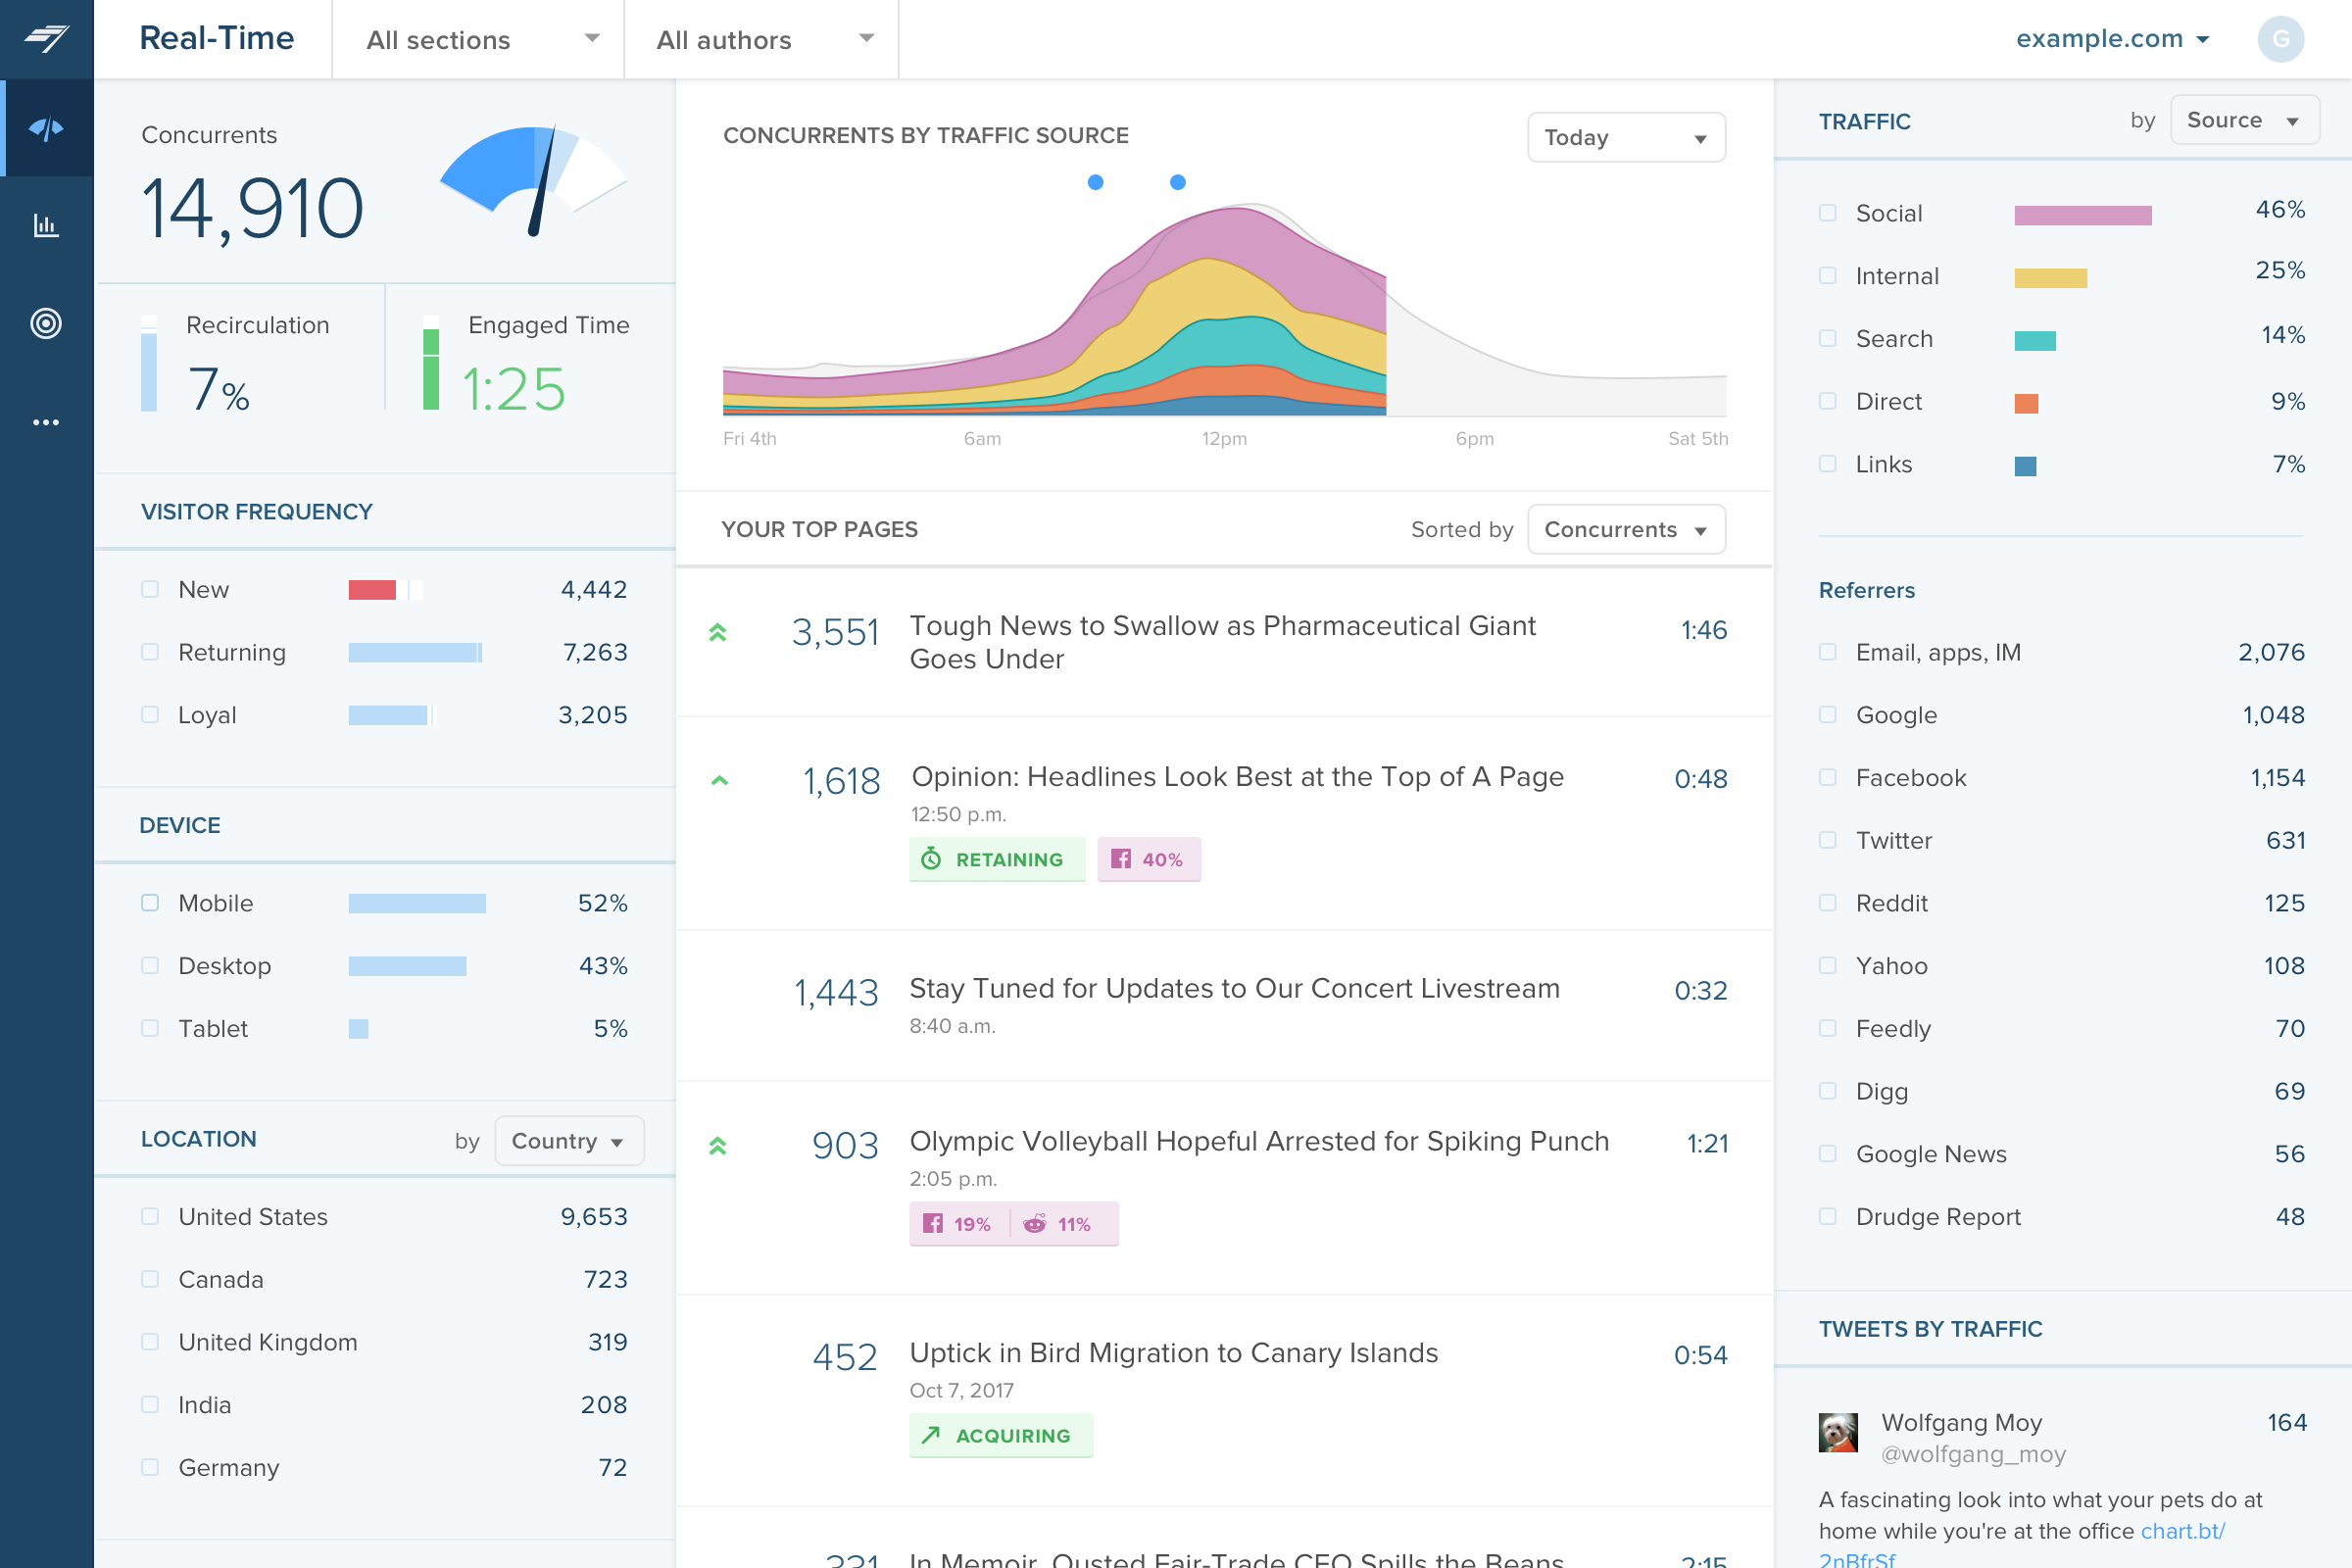
Chartbeat delivers real-time analytics, insights, and transformative tools for content teams around the world, to help improve audience engagement, inform editorial decisions, and increase loyalty.
N/A
Fullstory
Score 9.1 out of 10
N/A
Fullstory’s behavioral data platform helps technology leaders make better, more informed decisions by injecting digital behavioral data into their analytics stack. The technology's behavioral data transforms digital visit into actionable insights.
N/A
Pricing
Chartbeat
Fullstory
Editions & Modules
No answers on this topic
Business
Contact Sales
Enterprise
Contact Sales
Offerings
Pricing Offerings
Chartbeat
Fullstory
Free Trial
Yes
Yes
Free/Freemium Version
No
Yes
Premium Consulting/Integration Services
No
No
Entry-level Setup Fee
No setup fee
Optional
Additional Details
Chartbeat pricing is based on monthly site page views. Discounts are applied to multi-year contracts. The Basic Plan includes the Real-time Dashboard, Historical Dashboard, Heads Up Display, Reports, Big Board, iOS and Android app, and Real-time API endpoints.
The Plus Plan includes all of the Basic Plan features, plus ONE of the following Premium features: Headline Testing, Advanced Queries, or Multi-Site View.
The Premium Plan includes all of the Basic Plan features, plus ALL Premium features: Headline Testing, Advanced Queries, Multi-Site View, and enterprise-level support and custom trainings.
It is well suited to keeping me toward a specified goal, and gives me concrete numbers and gives me an idea of what we need to do to meet our goals. It's less appropriate if you want something more than pageviews, and doesn't really do a lot for video views.
It was extremely useful in identifying places in our product where things weren't functioning, or where it looked like action was available to the end user but in reality, it was not and therefore caused lots of confusion. It doesn't help as much in other scenarios to see what catches a user's Eye or where they go if they leave our application as well as an actual in-person interview would help with eye-tracking software.
Source of traffic needs improvement. Search and social make sense, but "internal" and "links" is a grey area. It would be helpful to define those with an organization and provide an information icon so users can easily remember what each of those buckets is tracking.
More ways to customize the real-time board. For example, with video content, that's great that I can see a user has started a video, but what is the completion rate, was that only on O&O or can that track Facebook, too?
Would like to see demo (age) information included as a way to slice the data so I can see what's working with my older and younger demo.
Can be a little confusing to know the exact time something happened, in local time or customer time? That's helpful for engineering to look into log files.
When looking for a specific session, it would be nice if you have a easier list of sessions with a little more info to choose from
It would be nice to be able to save flagged sessions and annotations under my profile to reference later
I gave Chartbeat a 5 for a renewal rating, because, while it delivers clear and understandable content, Google Analytics also provides many of the same features for free. For a small to medium website, I believe it would be more cost effective to use Google Analytics. A website with a high amount of traffic, however, could merit spending the money on Chartbeat to maximize their potential.
The metrics are hard to understand at times and inaccurate to the point of being unusable. I stopped pulling them and solely rely on Adobe Analytics for them. So far, I've only used FS to watch sessions and determine behaviors
Chartbeat is really pretty straightforward. The only things that may cause confusion are the string of sidebar features and tools at the left of the screen. I mostly use the big leader board in real-time and the historical feature (looking at the monthly or weekly performance of my team's content) and then generate reports automatically from there.
I have had limited experience of support for Chartbeat but whenever I have needed help it has been there. Recently there was an issue of seeing different forms of data in real time - app and otherwise effectively, and the issue was being clearly dealt with and communicated back to us.
Yes, that is correct. FullStory has a dedicated support team that is available to assist with any issues or questions. The team is known for being responsive, knowledgeable, and helpful, and they are committed to ensuring that users get the most out of the FullStory platform. They helped us a lot to implement it with our web app
I was not involved in the initial implementation, but I have found it easy to pick up and use without any guidance, so it's very user-friendly, intuitive, and not difficult to get a sense of use, though it may be more difficult to master (I am not a Fullstory master... yet!).
Google Analytics has gradually become much more difficult to use, and much slower in its realtime reporting. It was the changes that came in with Google Analytics 4 that gave us the final push to work with Chartbeat - a product some of us were already familiar with from previous jobs. Things are just much harder to find in GA, and when time is always tight you can't afford to spend a long time looking for particular data - it should be quick and easy to locate
Fullstory is really the best at session recording. They are adding new and more features to become more competitive with other web analytics tools (like Pendo, Heap, and GA). But we ultimately keep them because they make it so easy to actually see how people interact with your site. It is one thing to see a report that says customers fall off a page, it is another thing to actually be able to watch what they do as they fall off.
We reduced our payment error rate by 20% using FullStory.
Our product design team is able to get initial designs approved 95% of the time using FullStory data in order to explain to our stakeholders the reasoning behind decisions. We also do a before-and-after analysis, and we either net out the same with the new designs (just improved visuals) or improve the metric of whatever was designed. More often than not, we improve the metric.
We decreased the time to A/B testing insights by 50%.
We can usually visualize a production issue via FullStory within 10 minutes.